| Param | Original file | Final file |
|---|---|---|
| Filename | modeM0/AS1T03_249T01_9000003934_27493cztM0_level2.evt | modeM0/AS1T03_249T01_9000003934_27493cztM0_level2_quad_clean.evt |
| Size (bytes) | 592,655,040 | 88,012,800 |
| Size | 565.2 MB | 83.9 MB |
| Events in quadrant A | 3,840,568 | 544,651 |
| Events in quadrant B | 4,166,721 | 547,736 |
| Events in quadrant C | 3,843,465 | 520,566 |
| Events in quadrant D | 5,574,099 | 514,942 |
| Mode M0 | |||
|---|---|---|---|
| Quadrant | BADHDUFLAG | Total packets | Discarded packets |
| A | 0 | 16286 | 0 |
| B | 0 | 17150 | 0 |
| C | 0 | 16229 | 0 |
| D | 0 | 21763 | 0 |
| Mode M9 | |||
|---|---|---|---|
| Quadrant | BADHDUFLAG | Total packets | Discarded packets |
| A | 0 | 4 | 0 |
| B | 0 | 4 | 0 |
| C | 0 | 4 | 0 |
| D | 0 | 4 | 0 |
| Quadrant | Total seconds | Saturated seconds | Saturation percentage |
|---|---|---|---|
| A | 7728 | 246 | 3.183230% |
| B | 7729 | 329 | 4.256696% |
| C | 7729 | 308 | 3.984992% |
| D | 7728 | 575 | 7.440476% |
Noise dominated data is calculated using 1-second bins in cleaned event files. If a bin has >2000 counts, and if more than 50% of those come from <1% of pixels, then it is considered to be noise-dominated and hence unusable.
| Quadrant | # 1 sec bins | Bins with >0 counts | Bins with >2000 counts | High rate bins dominated by noise | Noise dominated (total time) | Noise dominated (detector-on time) | Marked lightcurve |
|---|---|---|---|---|---|---|---|
| A | 8048 | 7728 | 7 | 7 | 0.09% | 0.09% | 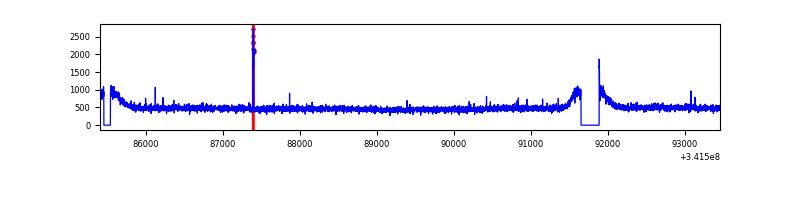 |
| B | 8049 | 7729 | 50 | 50 | 0.62% | 0.65% | 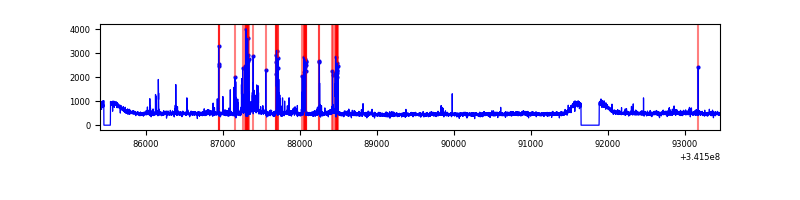 |
| C | 8049 | 7729 | 0 | 0 | 0.00% | 0.00% | 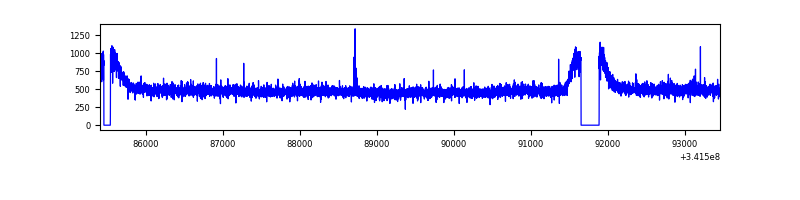 |
| D | 8048 | 7728 | 318 | 318 | 3.95% | 4.11% | 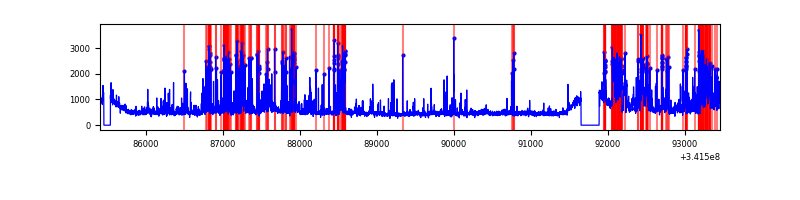 |
Top three noisy pixels from each quadrant. If the there are fewer than three noisy pixels in the level2.evt file, extra rows are filled as -1
| Pixel properties | Quadrant properties | ||||||
|---|---|---|---|---|---|---|---|
| Quadrant | DetID | PixID | Counts | Sigma | Mean | Median | Sigma |
| A | 6 | 16 | 24362 | 117.32 | 988 | 965 | 199.4 |
| A | 13 | 254 | 13191 | 61.31 | 988 | 965 | 199.4 |
| A | 3 | 137 | 9674 | 43.67 | 988 | 965 | 199.4 |
| B | 3 | 64 | 287665 | 1512.56 | 968 | 940 | 189.6 |
| B | 15 | 33 | 29698 | 151.7 | 968 | 940 | 189.6 |
| B | 12 | 111 | 23978 | 121.53 | 968 | 940 | 189.6 |
| C | 14 | 238 | 147193 | 654.19 | 941 | 944 | 223.6 |
| C | 8 | 128 | 11760 | 48.38 | 941 | 944 | 223.6 |
| C | 10 | 22 | 6756 | 26.0 | 941 | 944 | 223.6 |
| D | 1 | 52 | 1601733 | 7033.25 | 944 | 919 | 227.6 |
| D | 12 | 227 | 146070 | 637.73 | 944 | 919 | 227.6 |
| D | 14 | 35 | 94376 | 410.61 | 944 | 919 | 227.6 |
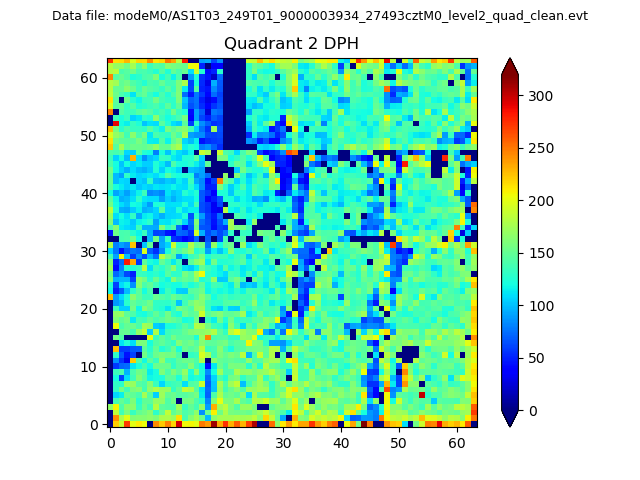
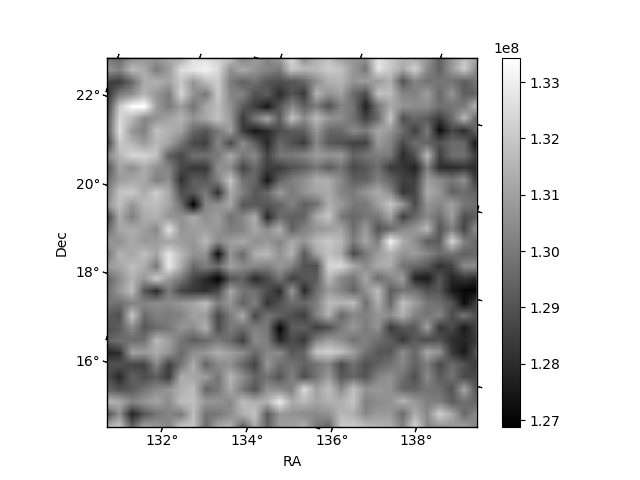
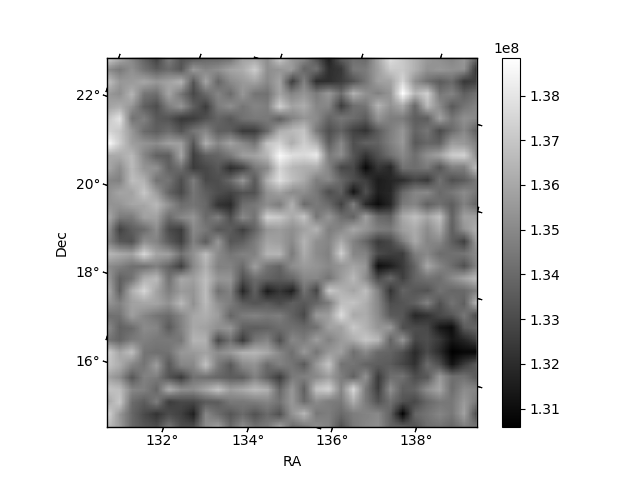
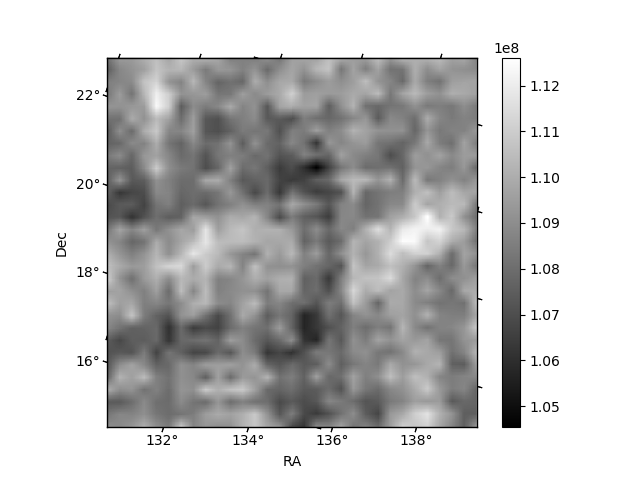
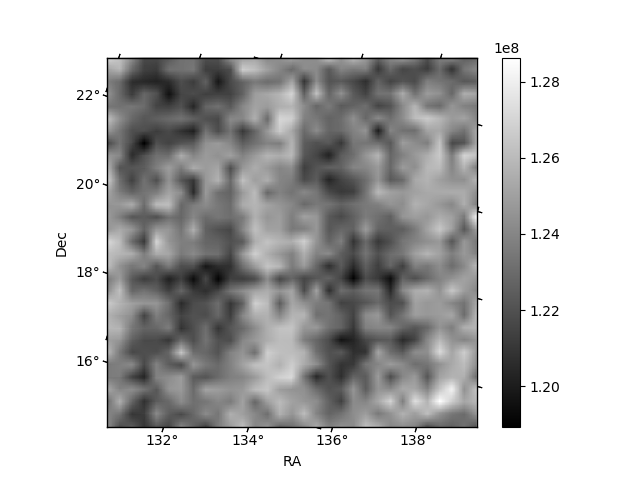
Histogram calculated using DETX and DETY for each event in the final _common_clean file
| Quadrant A | 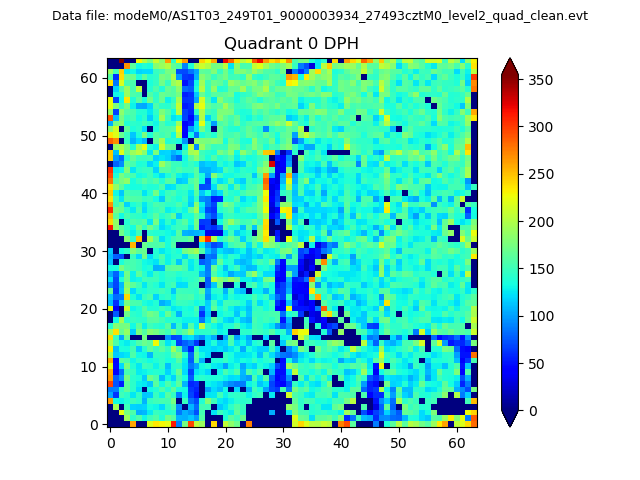 |
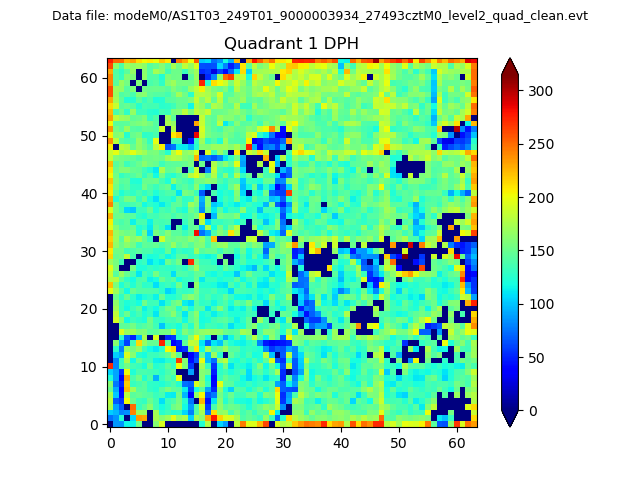 |
Quadrant B |
|---|---|---|---|
| Quadrant D | 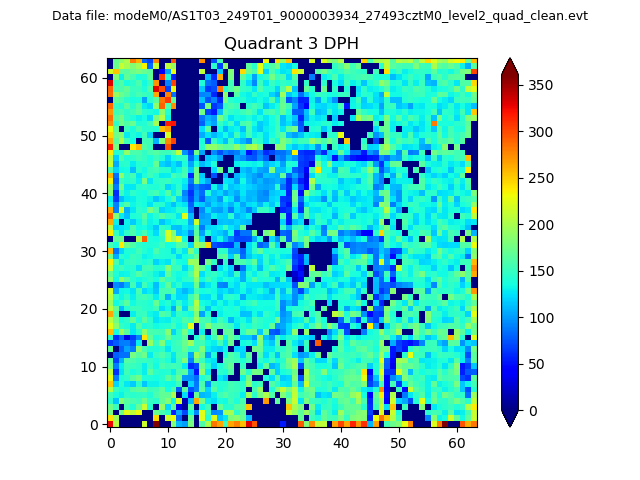 |
 |
Quadrant C |
| Plot type | Count rate plots | Images |
|---|---|---|
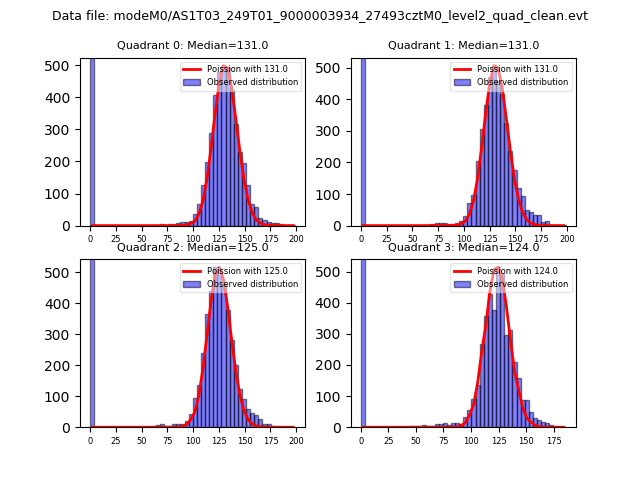
| Comparison with Poisson distribution Blue bars denote a histogram of data divided into 1 sec bins. Red curve is a Poisson curve with rate = median count rate of data. |
 |
 |
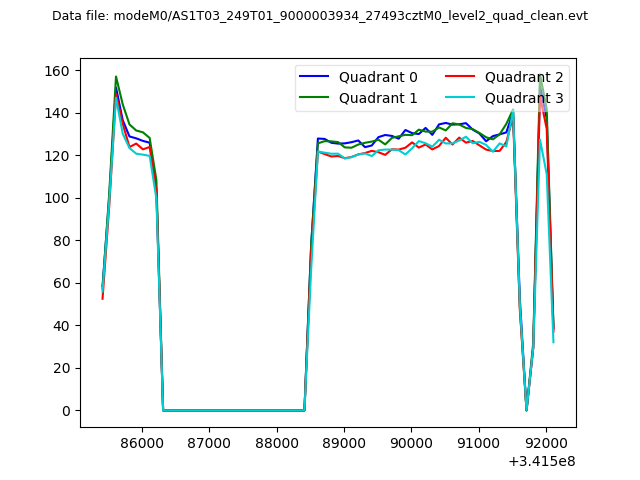
| Quadrant-wise count rates Data is divided into 100 sec bins |
 |
|
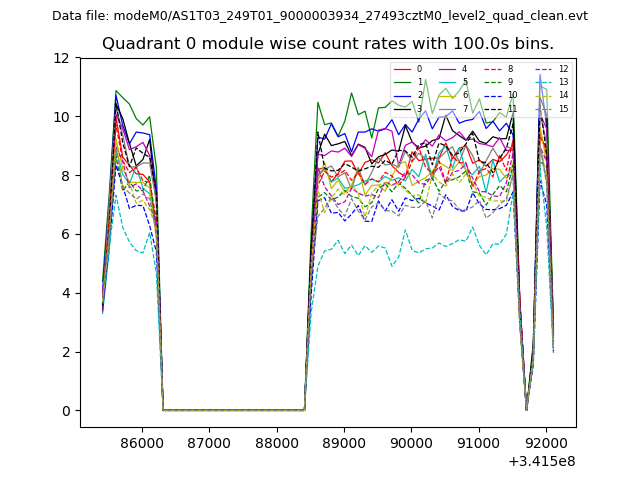
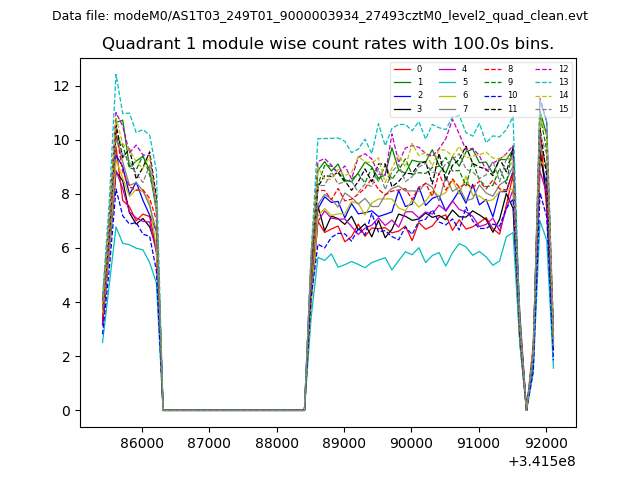
| Module-wise count rates for Quadrant A Data is divided into 100 sec bins |
 |
 |
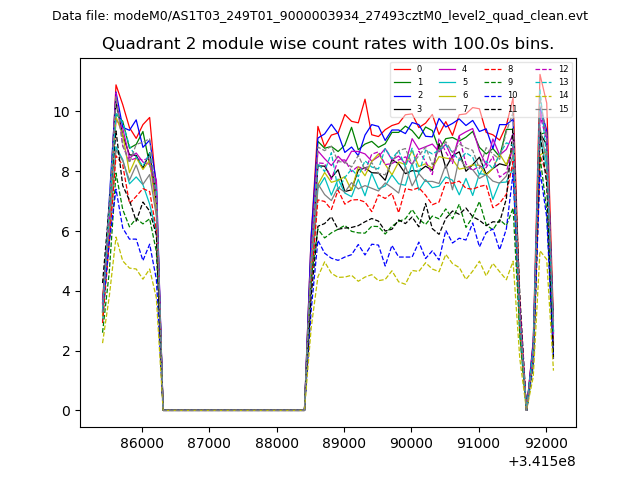
| Module-wise count rates for Quadrant B Data is divided into 100 sec bins |
 |
 |
| Module-wise count rates for Quadrant C Data is divided into 100 sec bins |
 |
 |
| Module-wise count rates for Quadrant D Data is divided into 100 sec bins |
 |
 |
| Parameter | Plot |
|---|---|
| CZT HV Monitor | 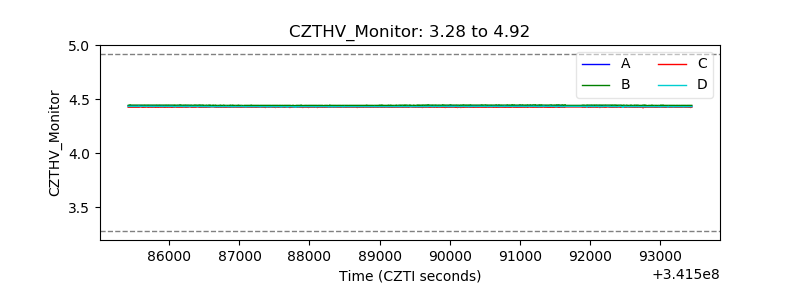 |
| D_VDD | 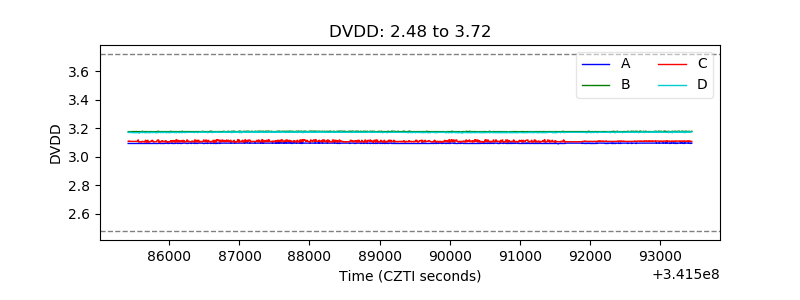 |
| Temperature 1 | 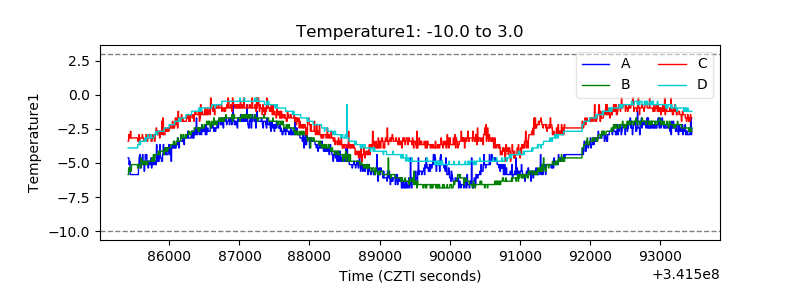 |
| Veto HV Monitor | 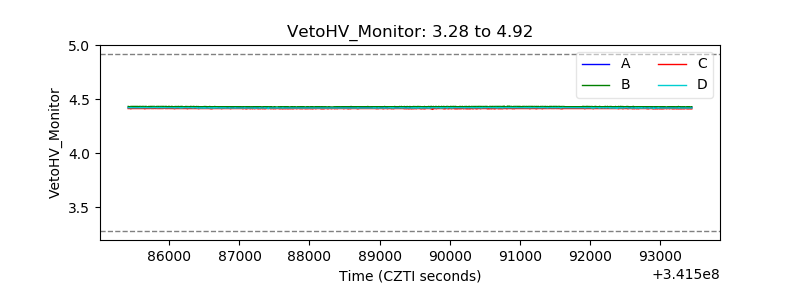 |
| Veto LLD | 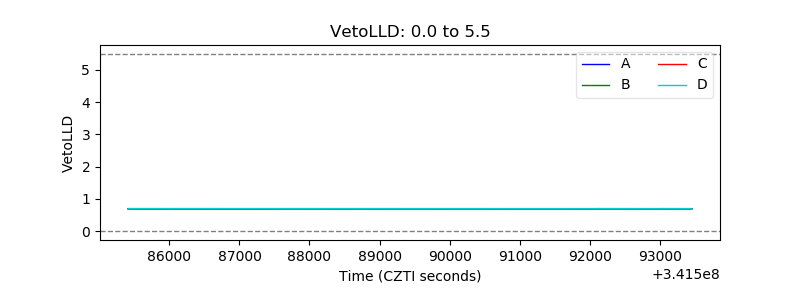 |
| Alpha Counter | 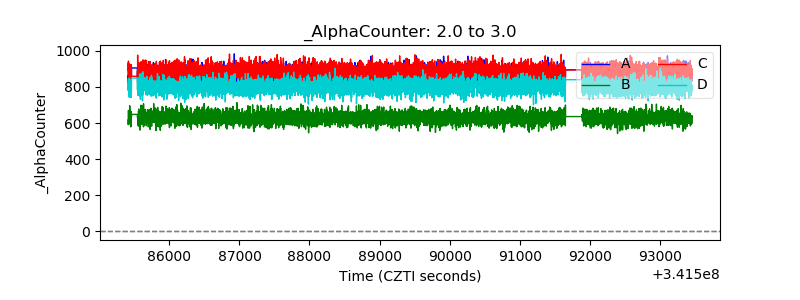 |
| _CPM_Rate | 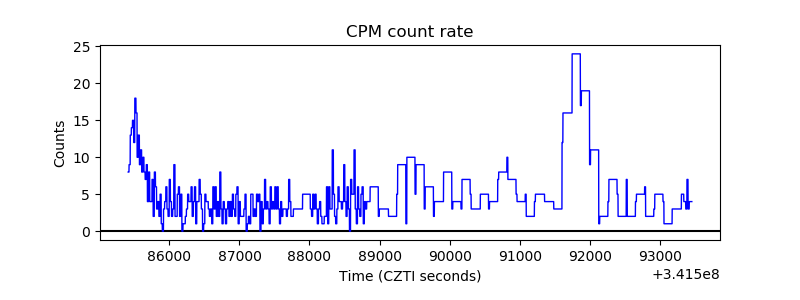 |
| CZT Counter | 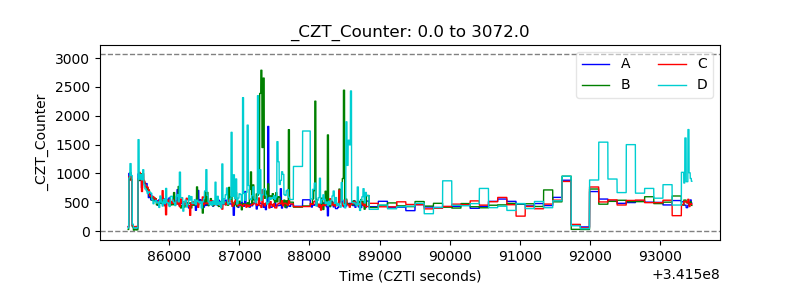 |
| +2.5 Volts monitor |  |
| +5 Volts monitor |  |
| _ROLL_ROT | 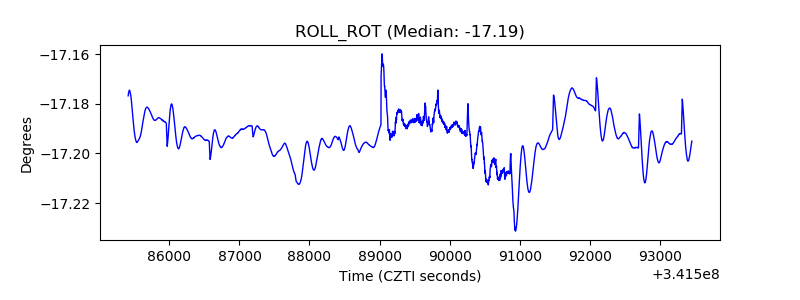 |
| _Roll_DEC | 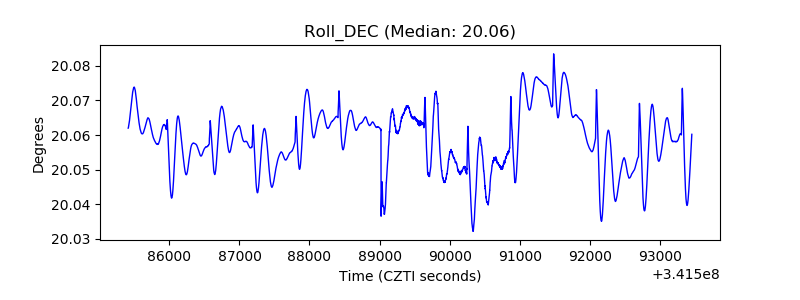 |
| _Roll_RA | 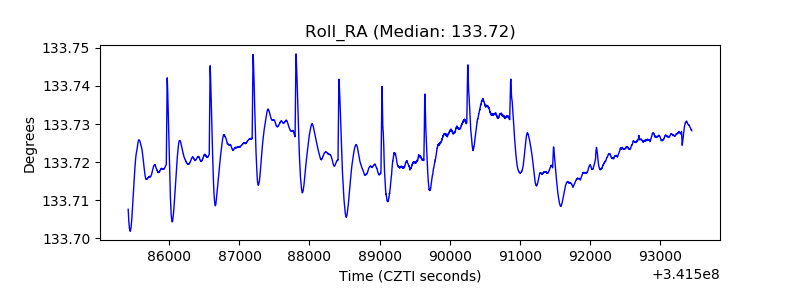 |
| Veto Counter | 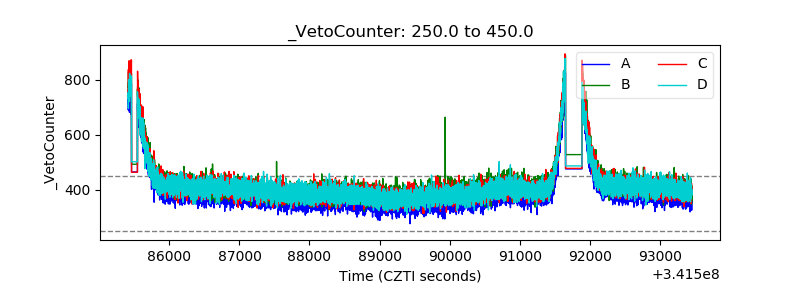 |