| Param | Original file | Final file |
|---|---|---|
| Filename | modeM0/AS1T03_249T01_9000003934_27496cztM0_level2.evt | modeM0/AS1T03_249T01_9000003934_27496cztM0_level2_quad_clean.evt |
| Size (bytes) | 1,313,982,720 | 201,885,120 |
| Size | 1.2 GB | 192.5 MB |
| Events in quadrant A | 7,345,240 | 1,302,522 |
| Events in quadrant B | 9,082,446 | 1,266,524 |
| Events in quadrant C | 7,449,121 | 1,242,075 |
| Events in quadrant D | 14,851,131 | 1,213,096 |
| Mode M0 | |||
|---|---|---|---|
| Quadrant | BADHDUFLAG | Total packets | Discarded packets |
| A | 0 | 32116 | 0 |
| B | 0 | 37085 | 0 |
| C | 0 | 32336 | 0 |
| D | 0 | 55147 | 0 |
| Mode M9 | |||
|---|---|---|---|
| Quadrant | BADHDUFLAG | Total packets | Discarded packets |
| A | 0 | 11 | 0 |
| B | 0 | 11 | 0 |
| C | 0 | 11 | 0 |
| D | 0 | 11 | 0 |
| Quadrant | Total seconds | Saturated seconds | Saturation percentage |
|---|---|---|---|
| A | 15795 | 73 | 0.462172% |
| B | 15795 | 559 | 3.539095% |
| C | 15795 | 147 | 0.930674% |
| D | 15795 | 1392 | 8.812915% |
Noise dominated data is calculated using 1-second bins in cleaned event files. If a bin has >2000 counts, and if more than 50% of those come from <1% of pixels, then it is considered to be noise-dominated and hence unusable.
| Quadrant | # 1 sec bins | Bins with >0 counts | Bins with >2000 counts | High rate bins dominated by noise | Noise dominated (total time) | Noise dominated (detector-on time) | Marked lightcurve |
|---|---|---|---|---|---|---|---|
| A | 16940 | 15796 | 2 | 2 | 0.01% | 0.01% | 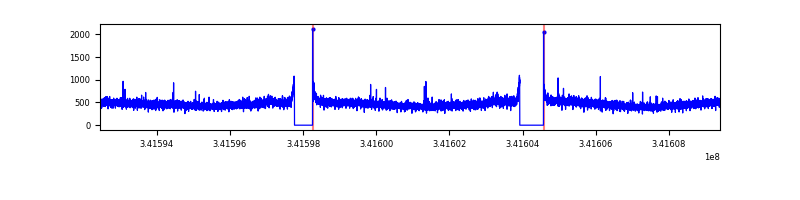 |
| B | 16940 | 15795 | 416 | 416 | 2.46% | 2.63% | 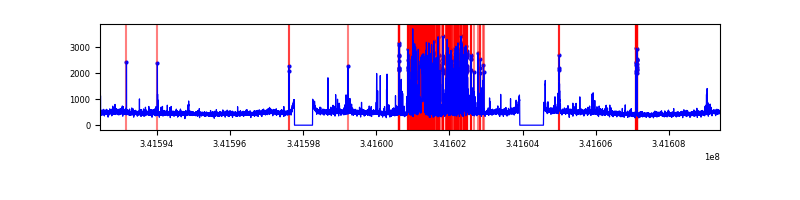 |
| C | 16940 | 15796 | 6 | 6 | 0.04% | 0.04% | 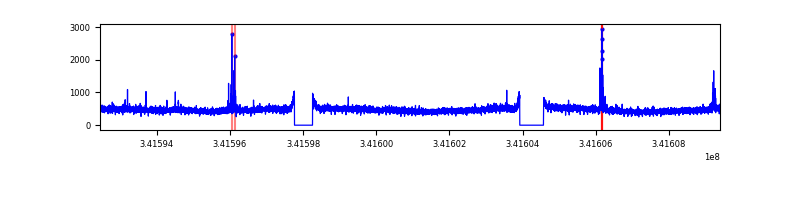 |
| D | 16940 | 15796 | 1210 | 1210 | 7.14% | 7.66% | 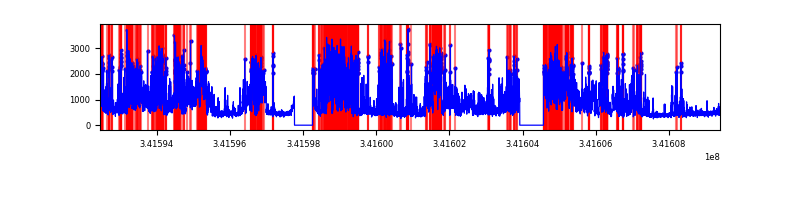 |
Top three noisy pixels from each quadrant. If the there are fewer than three noisy pixels in the level2.evt file, extra rows are filled as -1
| Pixel properties | Quadrant properties | ||||||
|---|---|---|---|---|---|---|---|
| Quadrant | DetID | PixID | Counts | Sigma | Mean | Median | Sigma |
| A | 13 | 254 | 25812 | 62.89 | 1899 | 1855 | 380.9 |
| A | 3 | 137 | 18311 | 43.2 | 1899 | 1855 | 380.9 |
| A | 0 | 226 | 16064 | 37.3 | 1899 | 1855 | 380.9 |
| B | 3 | 64 | 1703721 | 4732.69 | 1856 | 1810 | 359.6 |
| B | 12 | 111 | 44446 | 118.56 | 1856 | 1810 | 359.6 |
| B | 11 | 111 | 40537 | 107.69 | 1856 | 1810 | 359.6 |
| C | 14 | 238 | 291016 | 676.33 | 1811 | 1816 | 427.6 |
| C | 10 | 22 | 57750 | 130.81 | 1811 | 1816 | 427.6 |
| C | 15 | 208 | 44341 | 99.45 | 1811 | 1816 | 427.6 |
| D | 1 | 52 | 7419922 | 17423.02 | 1786 | 1739 | 425.8 |
| D | 7 | 80 | 201091 | 468.22 | 1786 | 1739 | 425.8 |
| D | 2 | 250 | 193192 | 449.66 | 1786 | 1739 | 425.8 |
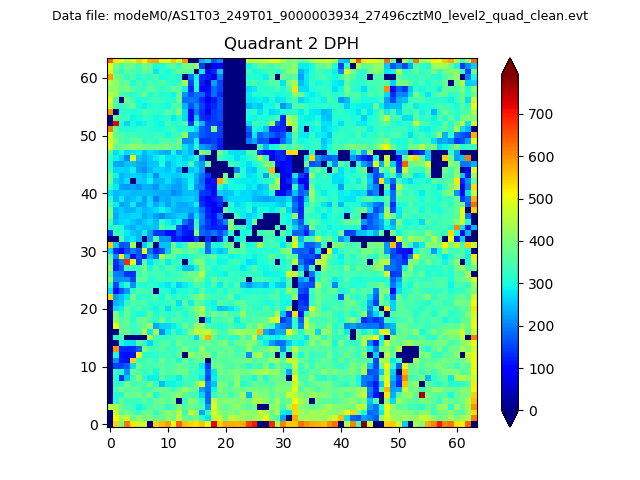
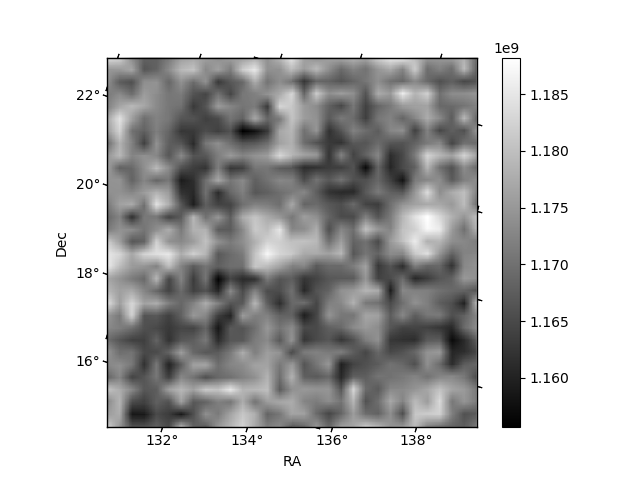
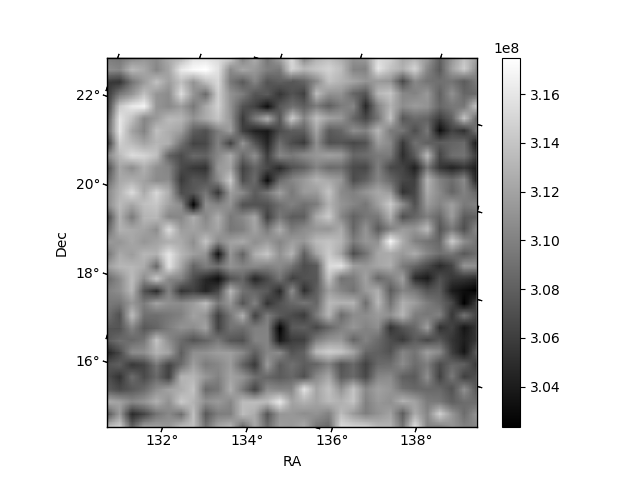
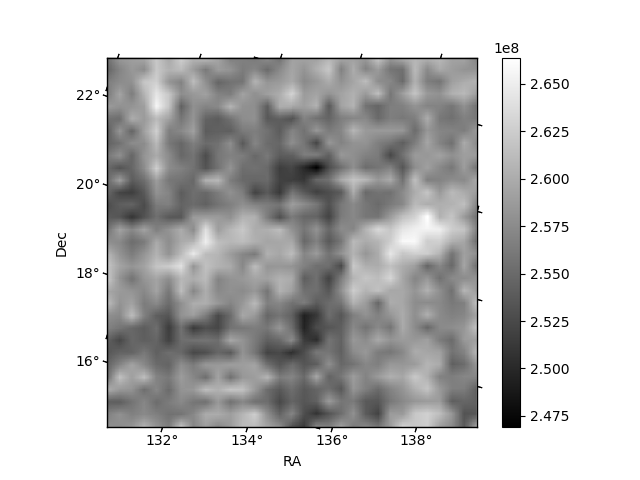
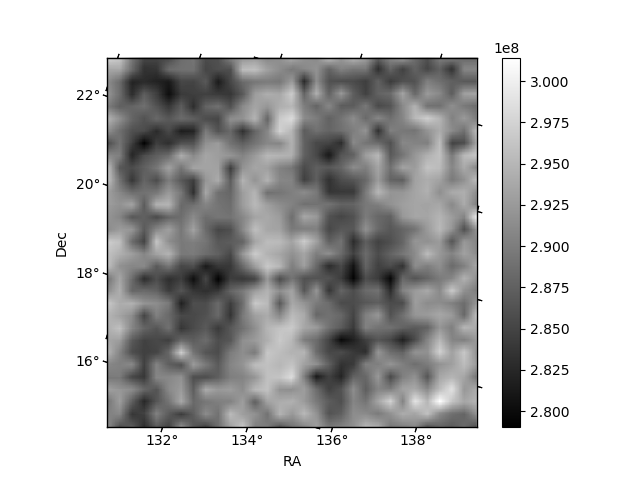
Histogram calculated using DETX and DETY for each event in the final _common_clean file
| Quadrant A | 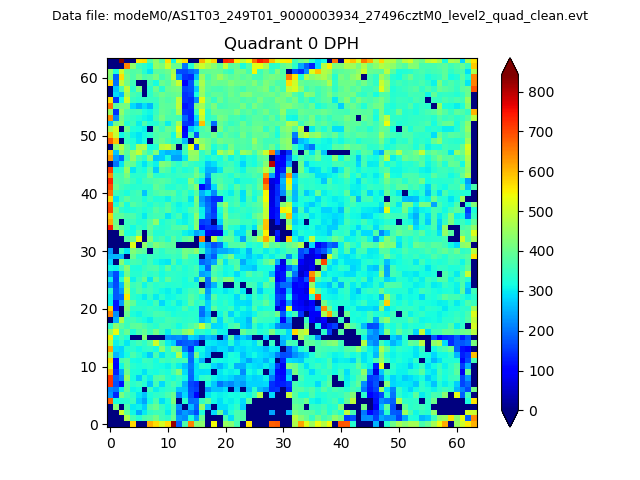 |
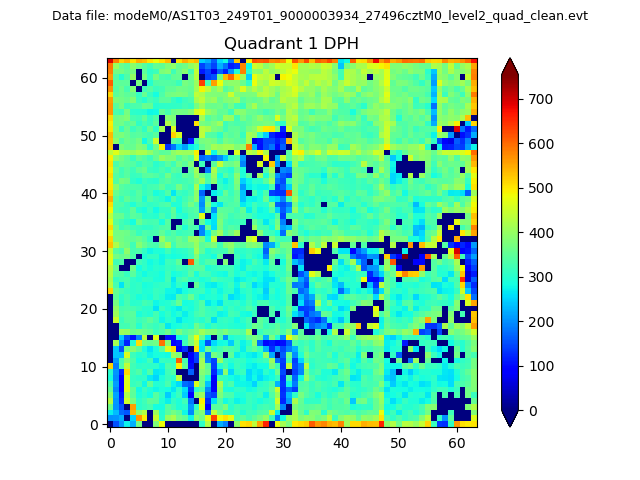 |
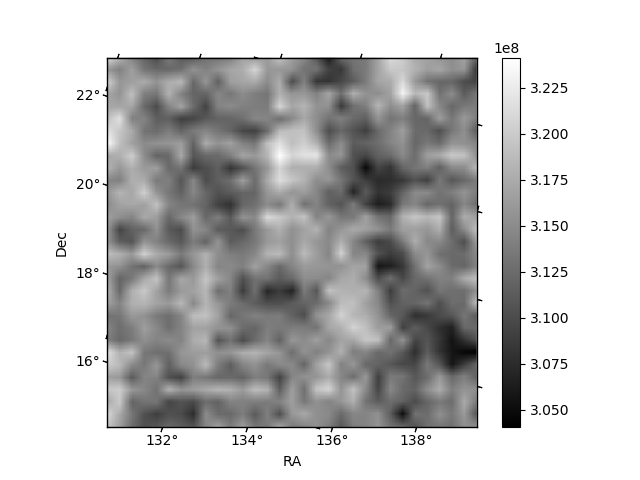
Quadrant B |
|---|---|---|---|
| Quadrant D | 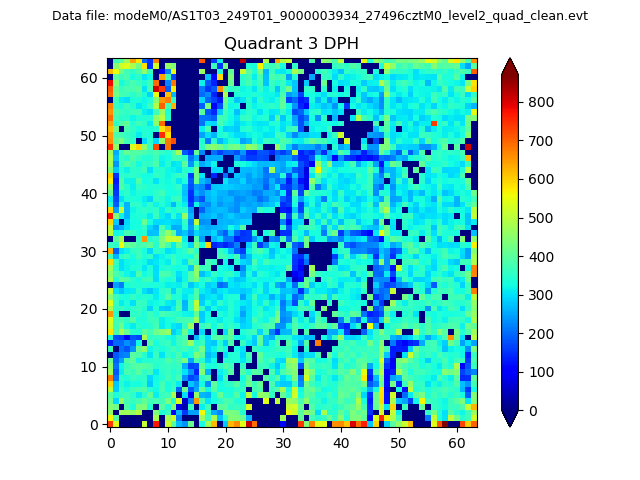 |
 |
Quadrant C |
| Plot type | Count rate plots | Images |
|---|---|---|
| Comparison with Poisson distribution Blue bars denote a histogram of data divided into 1 sec bins. Red curve is a Poisson curve with rate = median count rate of data. |
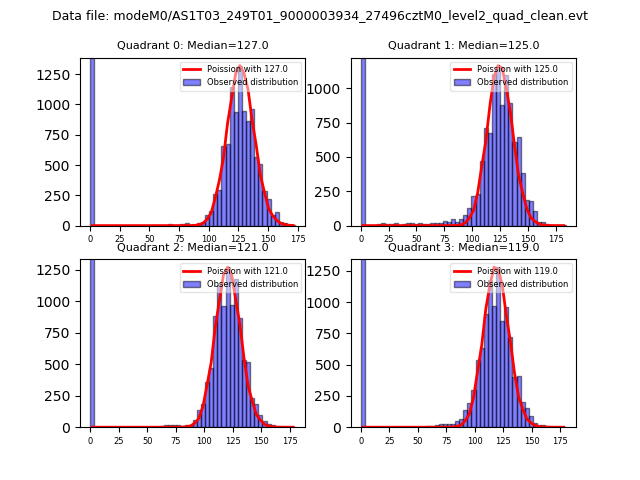 |
 |
| Quadrant-wise count rates Data is divided into 100 sec bins |
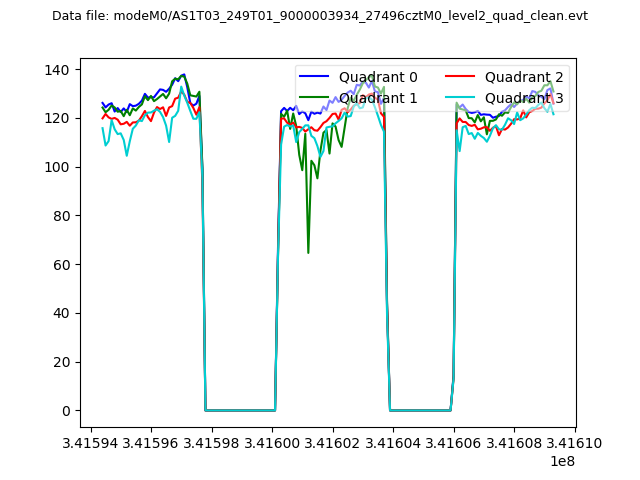 |
|
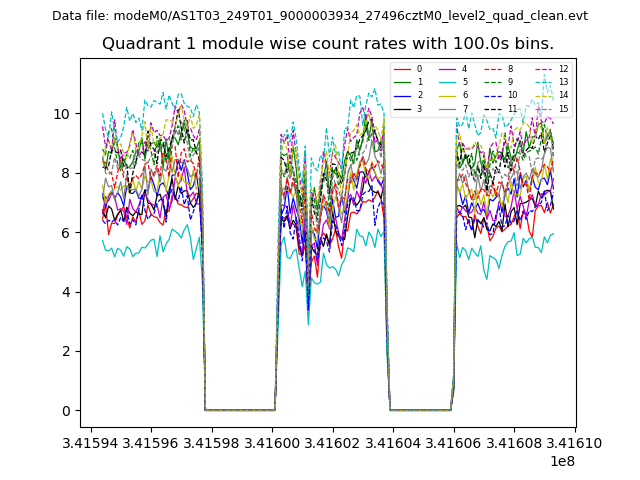
| Module-wise count rates for Quadrant A Data is divided into 100 sec bins |
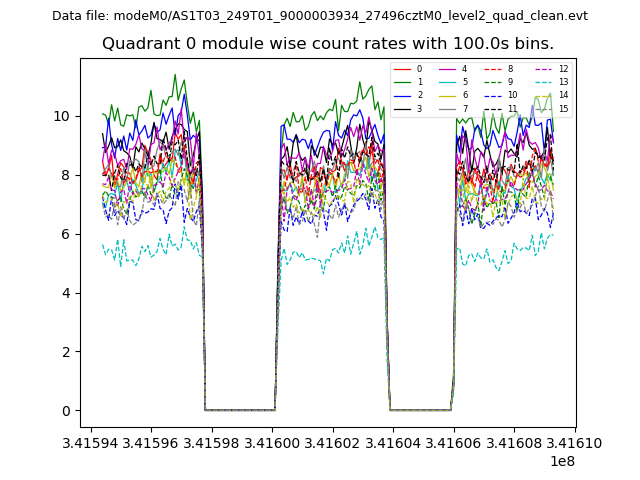 |
 |
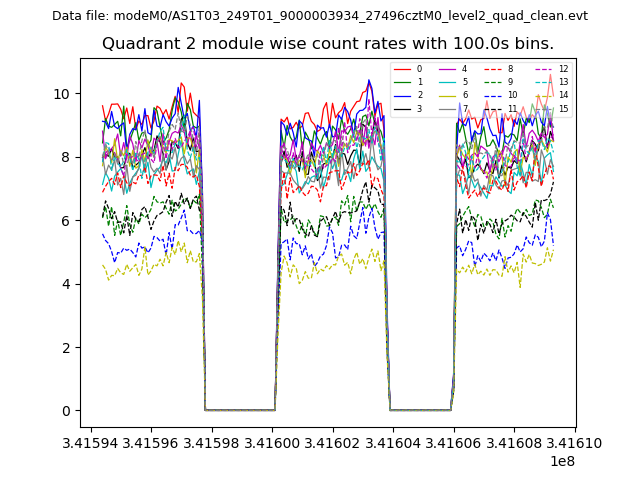
| Module-wise count rates for Quadrant B Data is divided into 100 sec bins |
 |
 |
| Module-wise count rates for Quadrant C Data is divided into 100 sec bins |
 |
 |
| Module-wise count rates for Quadrant D Data is divided into 100 sec bins |
 |
 |
| Parameter | Plot |
|---|---|
| CZT HV Monitor | 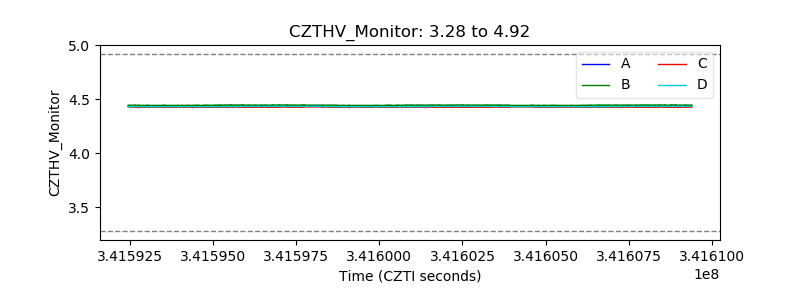 |
| D_VDD | 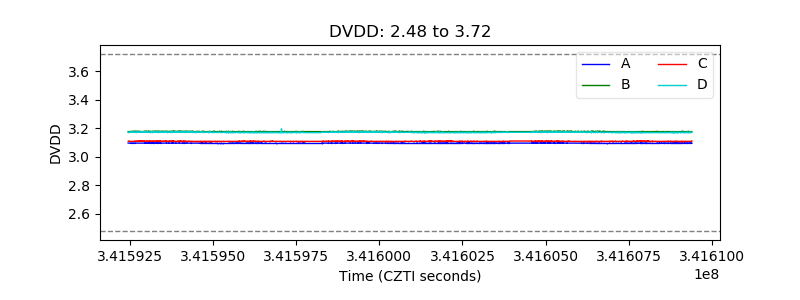 |
| Temperature 1 | 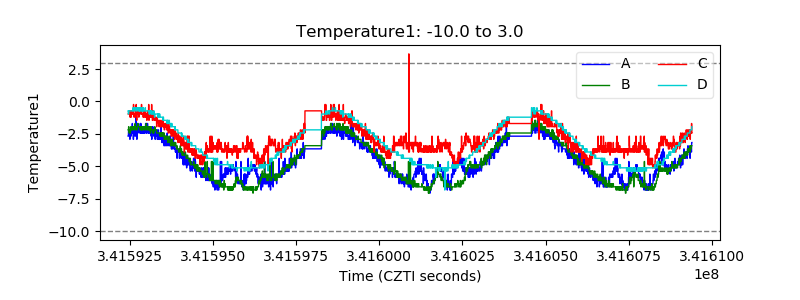 |
| Veto HV Monitor | 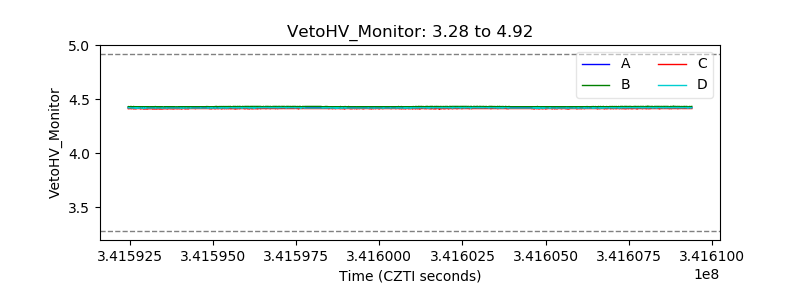 |
| Veto LLD | 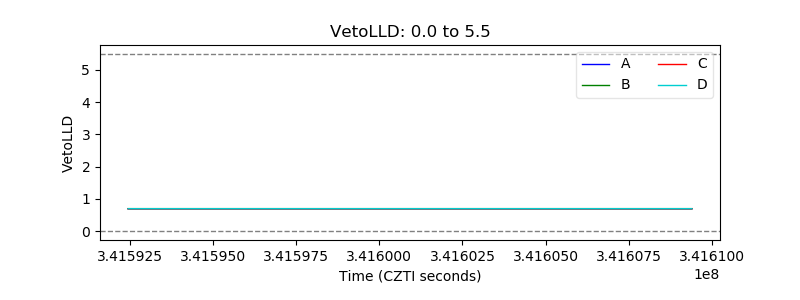 |
| Alpha Counter | 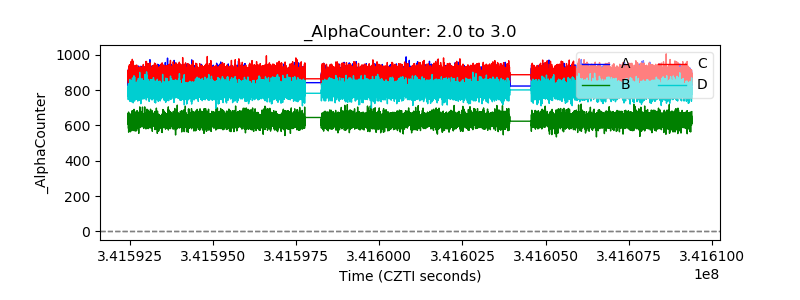 |
| _CPM_Rate | 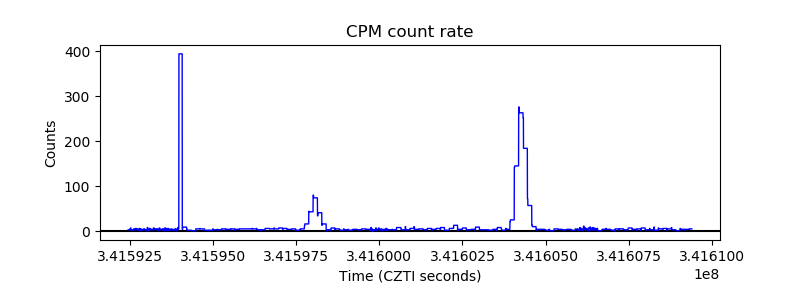 |
| CZT Counter | 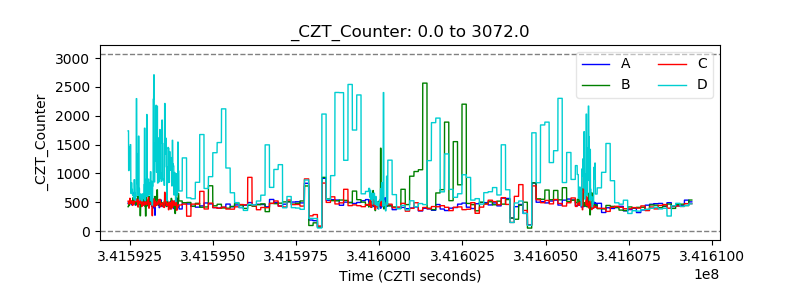 |
| +2.5 Volts monitor | 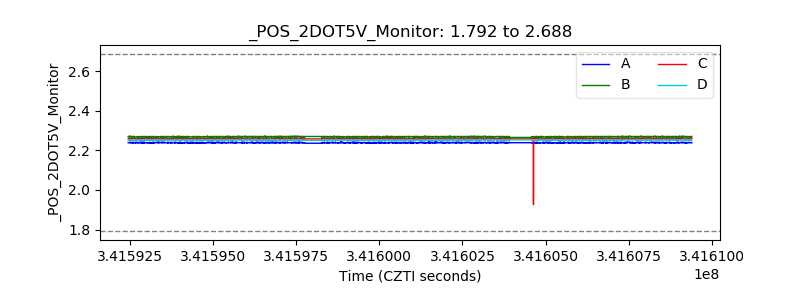 |
| +5 Volts monitor | 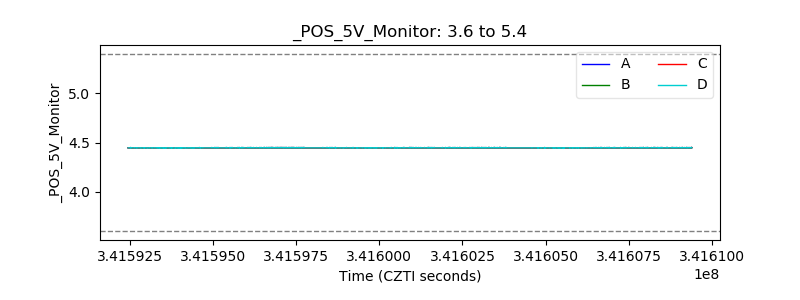 |
| _ROLL_ROT | 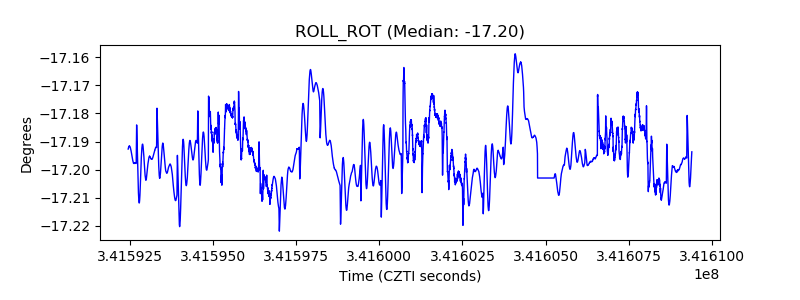 |
| _Roll_DEC | 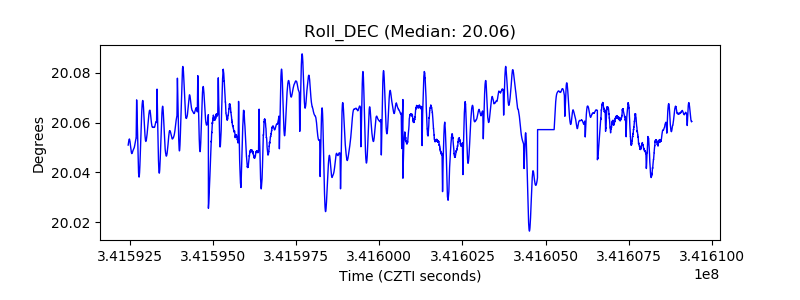 |
| _Roll_RA | 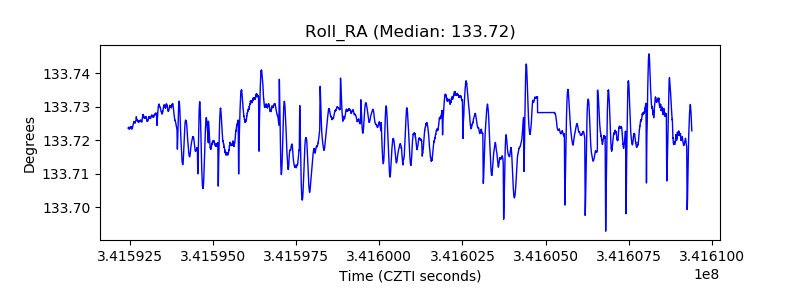 |
| Veto Counter | 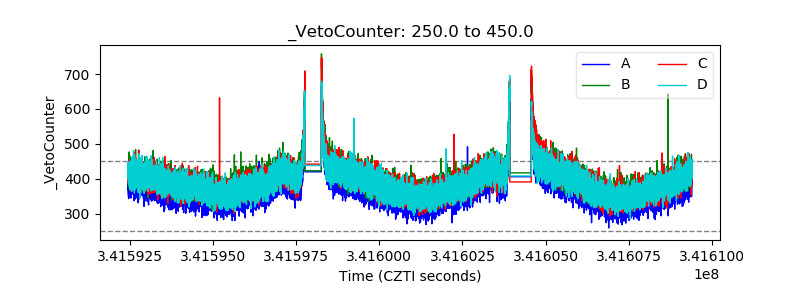 |