| Param | Original file | Final file |
|---|---|---|
| Filename | modeM0/AS1T03_249T01_9000003934_27497cztM0_level2.evt | modeM0/AS1T03_249T01_9000003934_27497cztM0_level2_quad_clean.evt |
| Size (bytes) | 630,028,800 | 93,323,520 |
| Size | 600.8 MB | 89.0 MB |
| Events in quadrant A | 3,582,813 | 593,886 |
| Events in quadrant B | 4,394,864 | 596,334 |
| Events in quadrant C | 3,609,591 | 570,772 |
| Events in quadrant D | 6,997,608 | 555,513 |
| Mode M0 | |||
|---|---|---|---|
| Quadrant | BADHDUFLAG | Total packets | Discarded packets |
| A | 0 | 15306 | 0 |
| B | 0 | 17736 | 0 |
| C | 0 | 15365 | 0 |
| D | 0 | 25833 | 0 |
| Mode M9 | |||
|---|---|---|---|
| Quadrant | BADHDUFLAG | Total packets | Discarded packets |
| A | 0 | 19 | 0 |
| B | 0 | 19 | 0 |
| C | 0 | 19 | 0 |
| D | 0 | 19 | 0 |
| Quadrant | Total seconds | Saturated seconds | Saturation percentage |
|---|---|---|---|
| A | 7322 | 64 | 0.874078% |
| B | 7323 | 265 | 3.618735% |
| C | 7323 | 108 | 1.474805% |
| D | 7323 | 824 | 11.252219% |
Noise dominated data is calculated using 1-second bins in cleaned event files. If a bin has >2000 counts, and if more than 50% of those come from <1% of pixels, then it is considered to be noise-dominated and hence unusable.
| Quadrant | # 1 sec bins | Bins with >0 counts | Bins with >2000 counts | High rate bins dominated by noise | Noise dominated (total time) | Noise dominated (detector-on time) | Marked lightcurve |
|---|---|---|---|---|---|---|---|
| A | 9132 | 7322 | 0 | 0 | 0.00% | 0.00% | 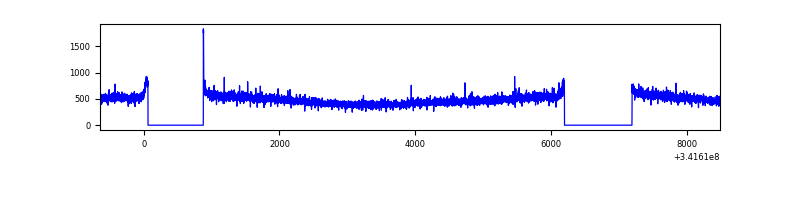 |
| B | 9133 | 7323 | 105 | 105 | 1.15% | 1.43% | 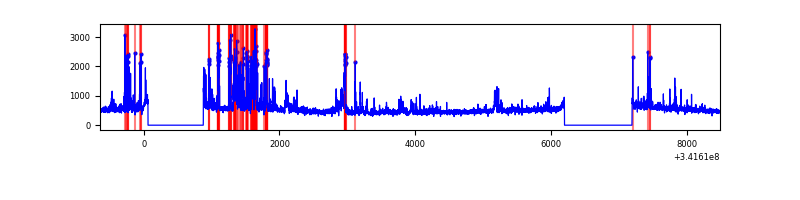 |
| C | 9133 | 7323 | 0 | 0 | 0.00% | 0.00% | 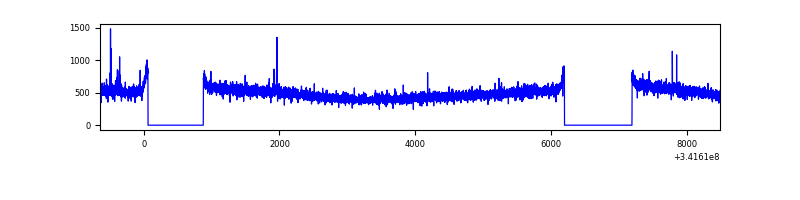 |
| D | 9133 | 7323 | 651 | 651 | 7.13% | 8.89% | 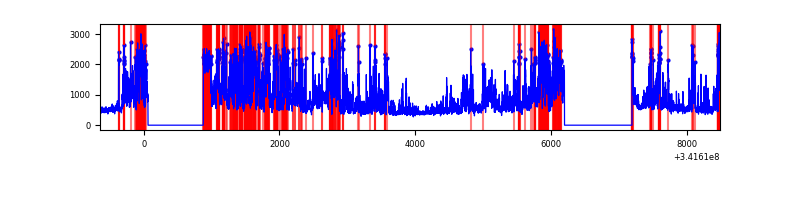 |
Top three noisy pixels from each quadrant. If the there are fewer than three noisy pixels in the level2.evt file, extra rows are filled as -1
| Pixel properties | Quadrant properties | ||||||
|---|---|---|---|---|---|---|---|
| Quadrant | DetID | PixID | Counts | Sigma | Mean | Median | Sigma |
| A | 13 | 254 | 12226 | 60.73 | 927 | 907 | 186.4 |
| A | 3 | 137 | 9005 | 43.45 | 927 | 907 | 186.4 |
| A | 0 | 226 | 7717 | 36.54 | 927 | 907 | 186.4 |
| B | 3 | 64 | 767143 | 4403.7 | 911 | 889 | 174.0 |
| B | 0 | 230 | 28780 | 160.29 | 911 | 889 | 174.0 |
| B | 12 | 111 | 21684 | 119.51 | 911 | 889 | 174.0 |
| C | 14 | 238 | 139974 | 666.43 | 885 | 891 | 208.7 |
| C | 10 | 22 | 10218 | 44.69 | 885 | 891 | 208.7 |
| C | 15 | 208 | 9060 | 39.14 | 885 | 891 | 208.7 |
| D | 1 | 52 | 3369307 | 16124.09 | 868 | 844 | 208.9 |
| D | 7 | 80 | 121302 | 576.61 | 868 | 844 | 208.9 |
| D | 2 | 250 | 98873 | 469.24 | 868 | 844 | 208.9 |
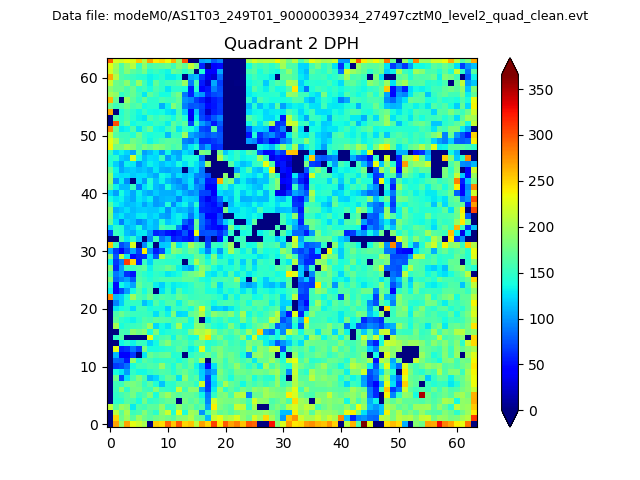
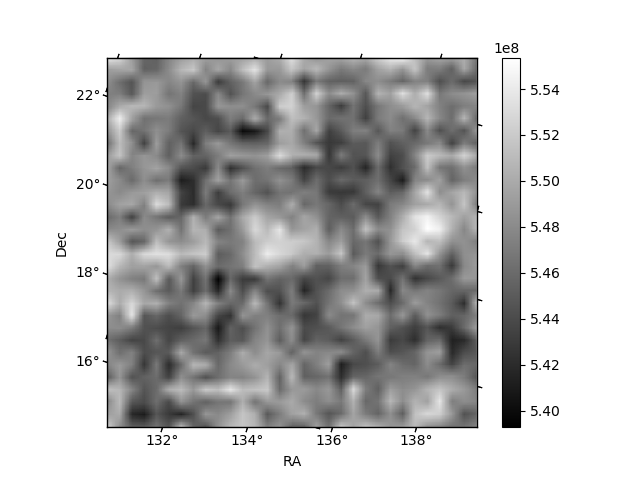
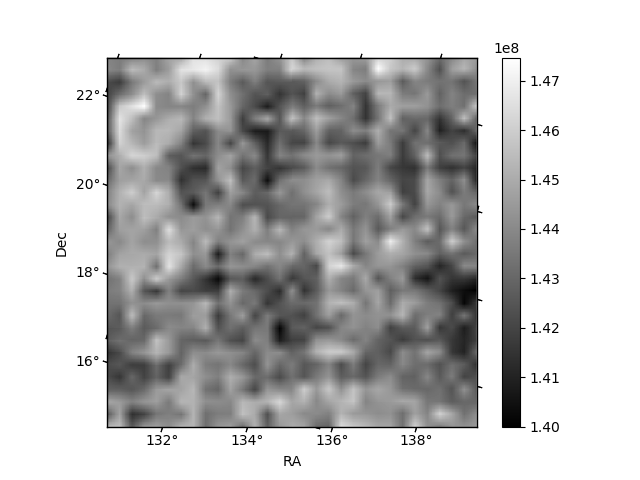
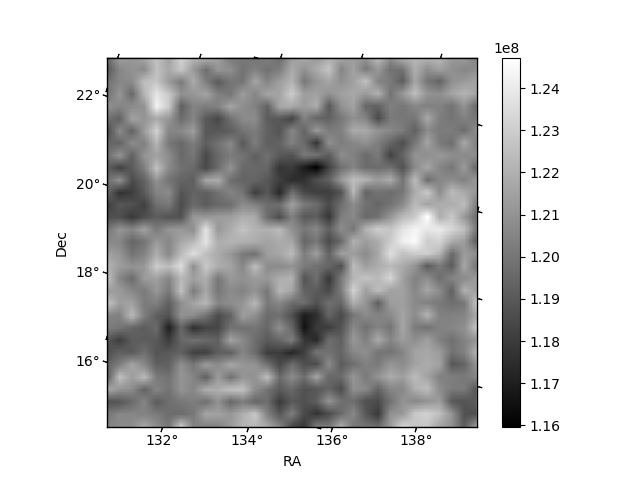
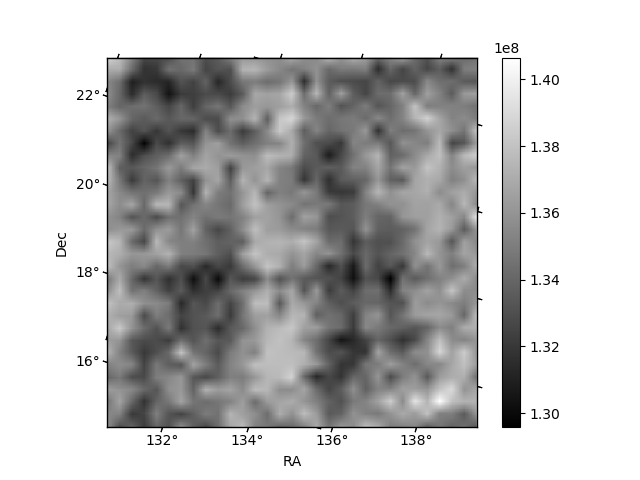
Histogram calculated using DETX and DETY for each event in the final _common_clean file
| Quadrant A | 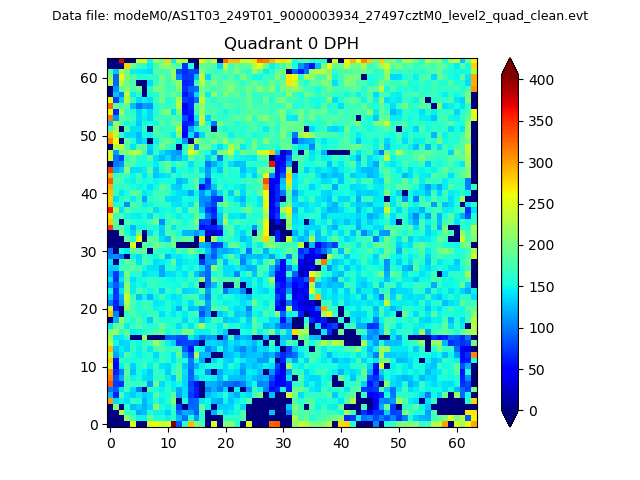 |
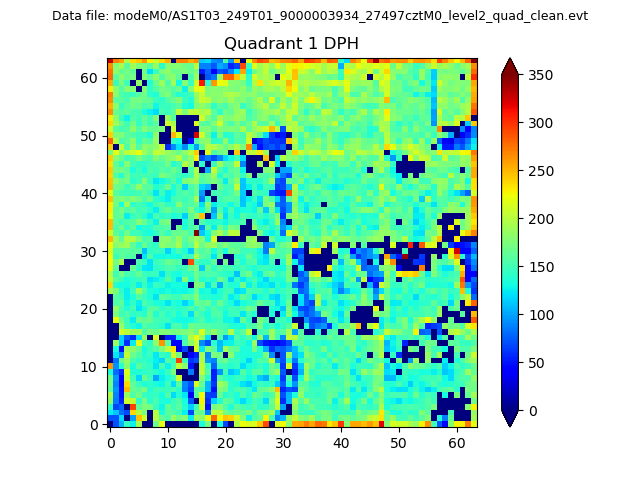 |
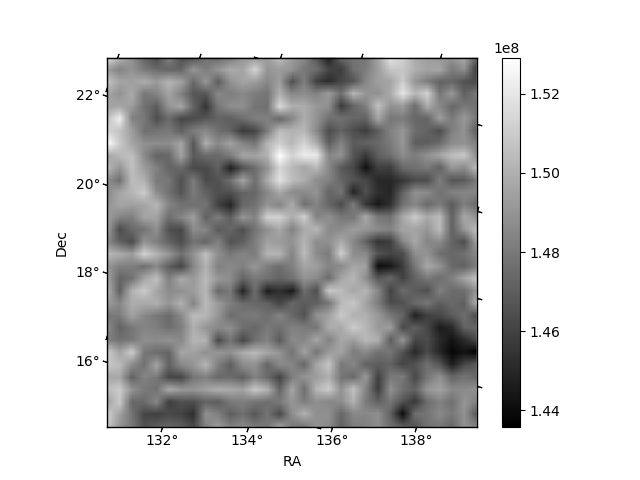
Quadrant B |
|---|---|---|---|
| Quadrant D | 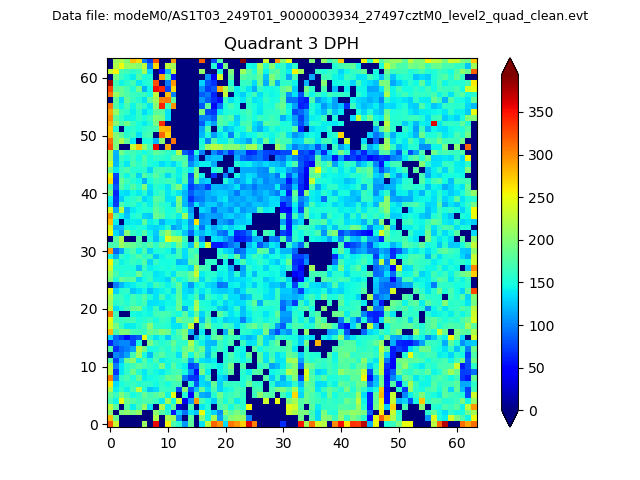 |
 |
Quadrant C |
| Plot type | Count rate plots | Images |
|---|---|---|
| Comparison with Poisson distribution Blue bars denote a histogram of data divided into 1 sec bins. Red curve is a Poisson curve with rate = median count rate of data. |
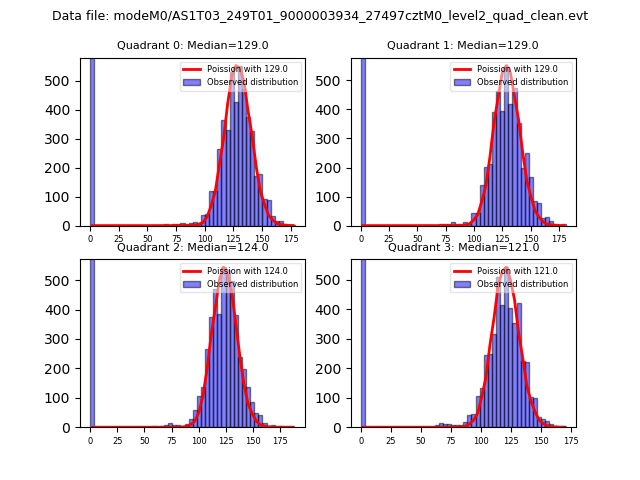 |
 |
| Quadrant-wise count rates Data is divided into 100 sec bins |
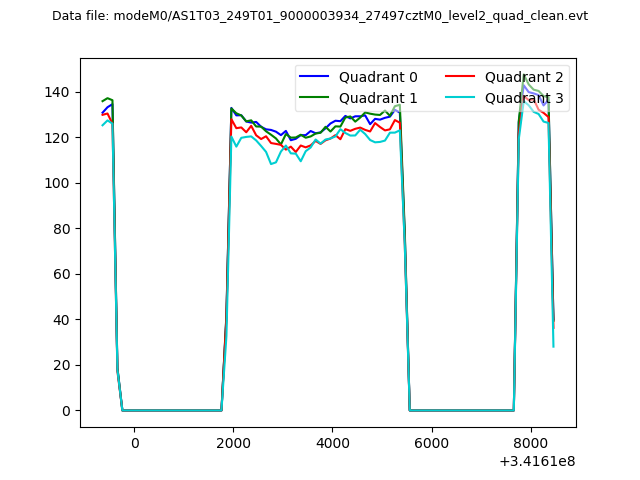 |
|
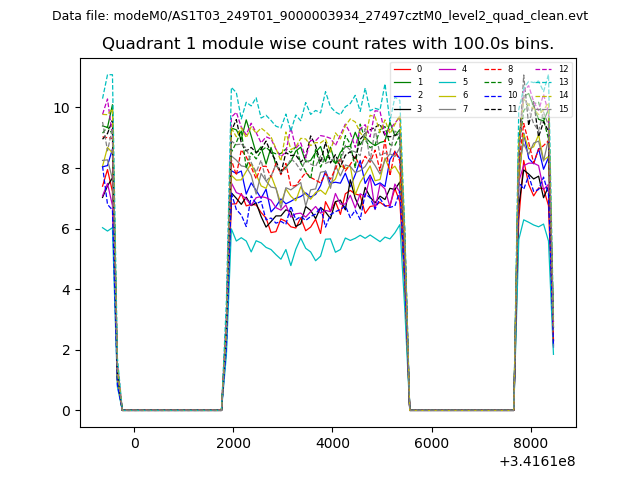
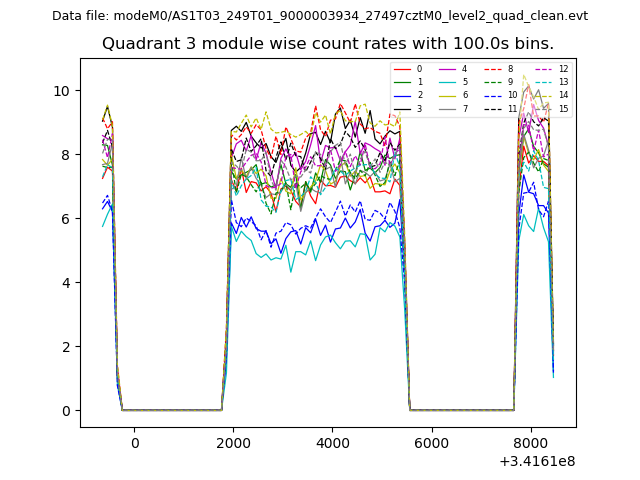
| Module-wise count rates for Quadrant A Data is divided into 100 sec bins |
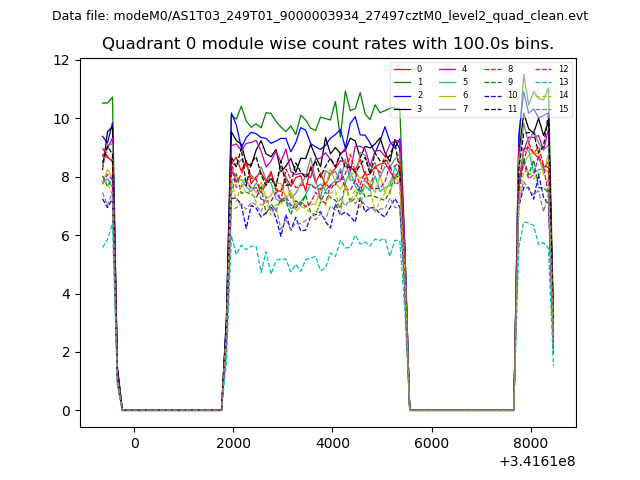 |
 |
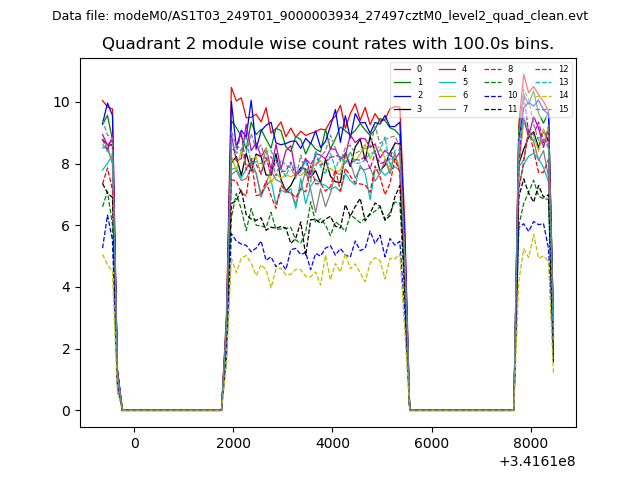
| Module-wise count rates for Quadrant B Data is divided into 100 sec bins |
 |
 |
| Module-wise count rates for Quadrant C Data is divided into 100 sec bins |
 |
 |
| Module-wise count rates for Quadrant D Data is divided into 100 sec bins |
 |
 |
| Parameter | Plot |
|---|---|
| CZT HV Monitor | 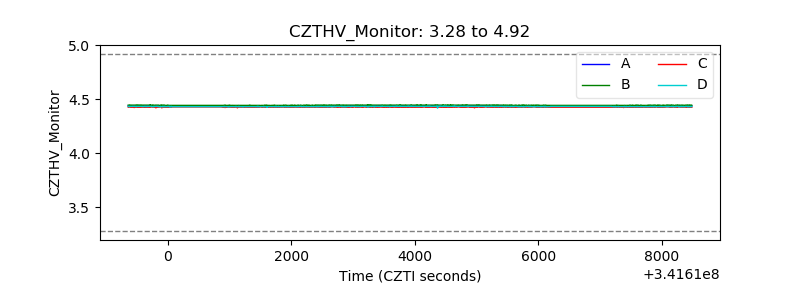 |
| D_VDD | 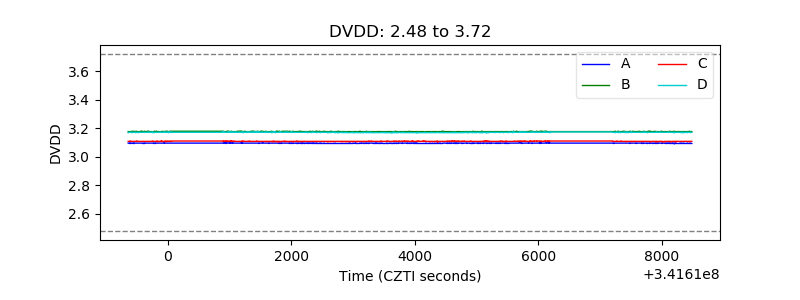 |
| Temperature 1 | 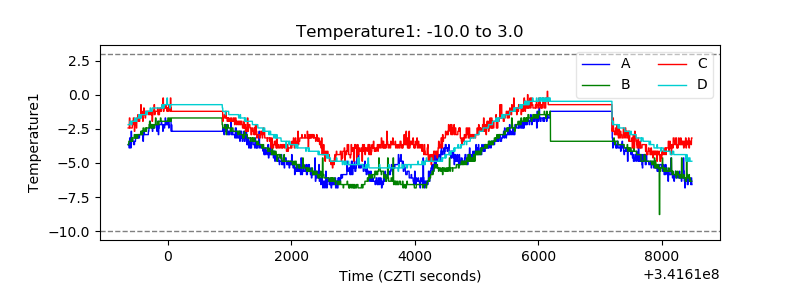 |
| Veto HV Monitor |  |
| Veto LLD | 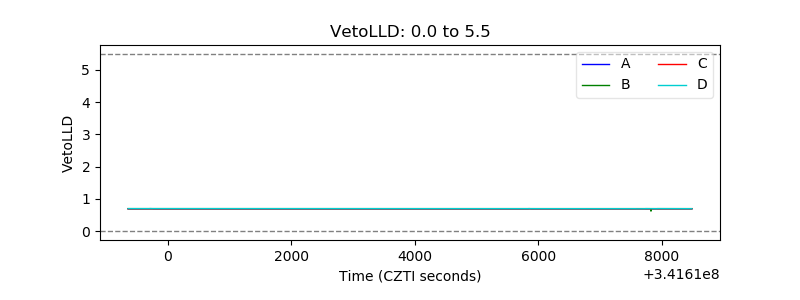 |
| Alpha Counter | 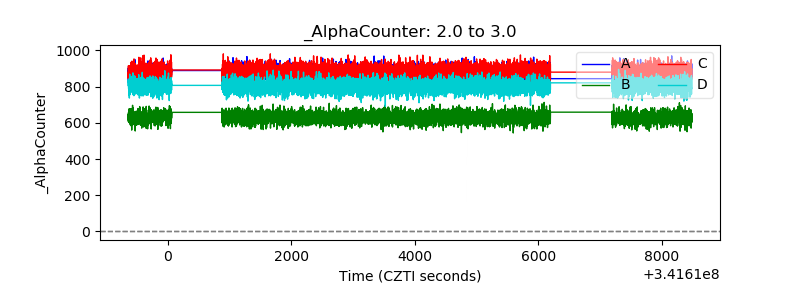 |
| _CPM_Rate | 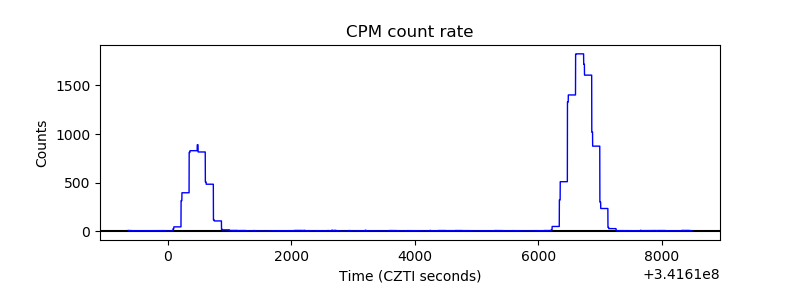 |
| CZT Counter | 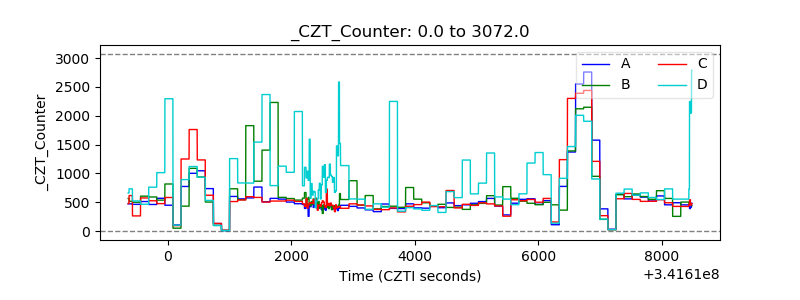 |
| +2.5 Volts monitor | 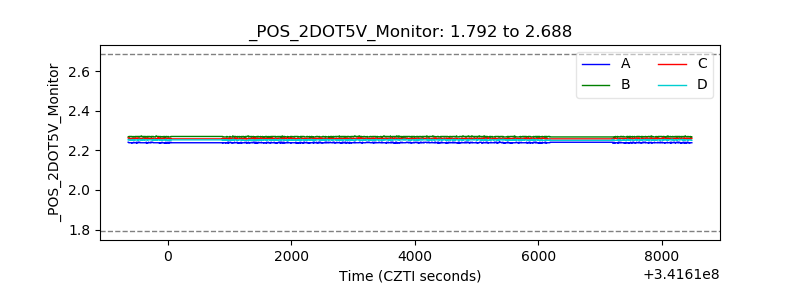 |
| +5 Volts monitor |  |
| _ROLL_ROT | 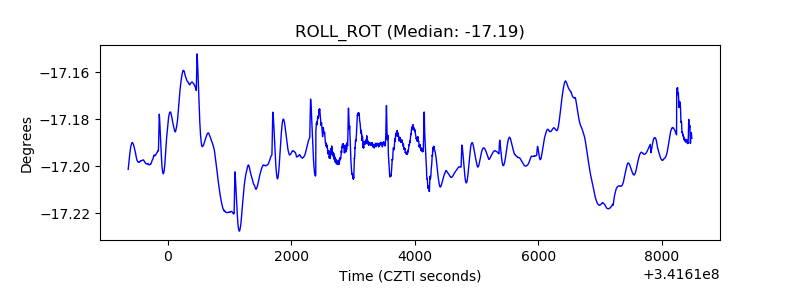 |
| _Roll_DEC | 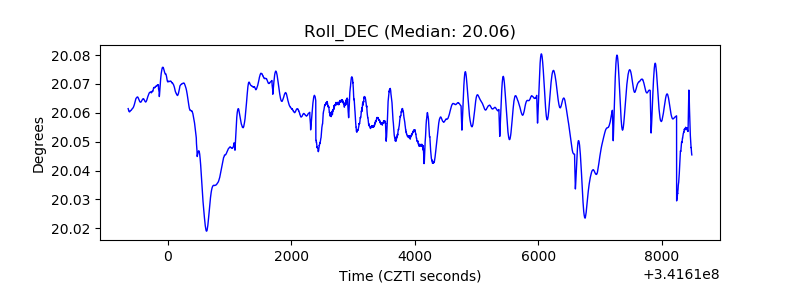 |
| _Roll_RA | 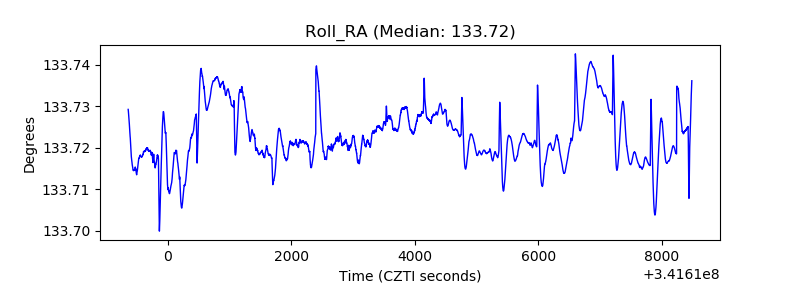 |
| Veto Counter | 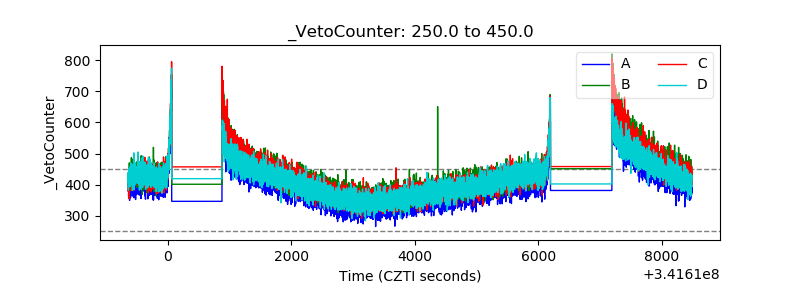 |