| Param | Original file | Final file |
|---|---|---|
| Filename | modeM0/AS1T03_249T01_9000003934_27499cztM0_level2.evt | modeM0/AS1T03_249T01_9000003934_27499cztM0_level2_quad_clean.evt |
| Size (bytes) | 501,091,200 | 99,567,360 |
| Size | 477.9 MB | 95.0 MB |
| Events in quadrant A | 3,288,348 | 654,089 |
| Events in quadrant B | 3,553,402 | 661,139 |
| Events in quadrant C | 3,329,178 | 626,899 |
| Events in quadrant D | 4,551,704 | 607,948 |
| Mode M0 | |||
|---|---|---|---|
| Quadrant | BADHDUFLAG | Total packets | Discarded packets |
| A | 0 | 14128 | 0 |
| B | 0 | 14997 | 0 |
| C | 0 | 14247 | 0 |
| D | 0 | 17995 | 0 |
| Mode M9 | |||
|---|---|---|---|
| Quadrant | BADHDUFLAG | Total packets | Discarded packets |
| A | 0 | 21 | 0 |
| B | 0 | 21 | 0 |
| C | 0 | 21 | 0 |
| D | 0 | 21 | 0 |
| Quadrant | Total seconds | Saturated seconds | Saturation percentage |
|---|---|---|---|
| A | 6672 | 62 | 0.929257% |
| B | 6673 | 119 | 1.783306% |
| C | 6673 | 112 | 1.678406% |
| D | 6673 | 274 | 4.106099% |
Noise dominated data is calculated using 1-second bins in cleaned event files. If a bin has >2000 counts, and if more than 50% of those come from <1% of pixels, then it is considered to be noise-dominated and hence unusable.
| Quadrant | # 1 sec bins | Bins with >0 counts | Bins with >2000 counts | High rate bins dominated by noise | Noise dominated (total time) | Noise dominated (detector-on time) | Marked lightcurve |
|---|---|---|---|---|---|---|---|
| A | 8772 | 6672 | 1 | 1 | 0.01% | 0.01% | 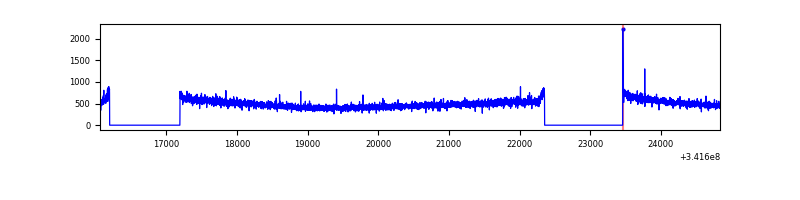 |
| B | 8773 | 6673 | 33 | 33 | 0.38% | 0.49% | 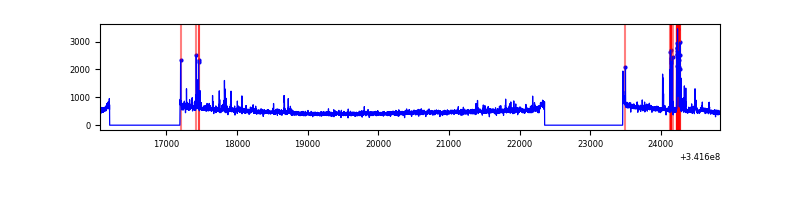 |
| C | 8773 | 6673 | 3 | 3 | 0.03% | 0.04% | 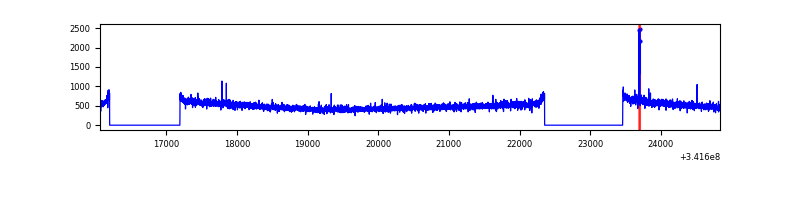 |
| D | 8773 | 6674 | 222 | 222 | 2.53% | 3.33% | 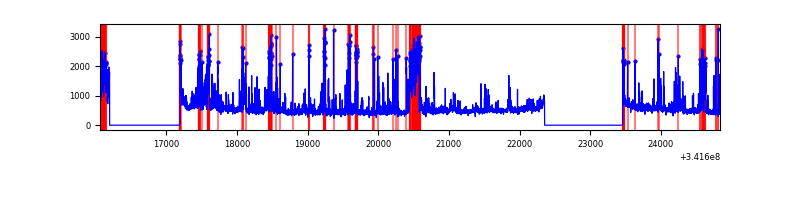 |
Top three noisy pixels from each quadrant. If the there are fewer than three noisy pixels in the level2.evt file, extra rows are filled as -1
| Pixel properties | Quadrant properties | ||||||
|---|---|---|---|---|---|---|---|
| Quadrant | DetID | PixID | Counts | Sigma | Mean | Median | Sigma |
| A | 13 | 254 | 11441 | 62.35 | 850 | 833 | 170.1 |
| A | 3 | 137 | 7996 | 42.1 | 850 | 833 | 170.1 |
| A | 0 | 226 | 7253 | 37.73 | 850 | 833 | 170.1 |
| B | 3 | 64 | 191526 | 1184.35 | 844 | 821 | 161.0 |
| B | 0 | 230 | 25299 | 152.02 | 844 | 821 | 161.0 |
| B | 12 | 111 | 19792 | 117.82 | 844 | 821 | 161.0 |
| C | 14 | 238 | 129539 | 667.79 | 816 | 821 | 192.8 |
| C | 10 | 22 | 18278 | 90.57 | 816 | 821 | 192.8 |
| C | 13 | 61 | 5472 | 24.13 | 816 | 821 | 192.8 |
| D | 1 | 52 | 1238572 | 6395.4 | 807 | 787 | 193.5 |
| D | 7 | 80 | 69568 | 355.38 | 807 | 787 | 193.5 |
| D | 14 | 35 | 65554 | 334.64 | 807 | 787 | 193.5 |
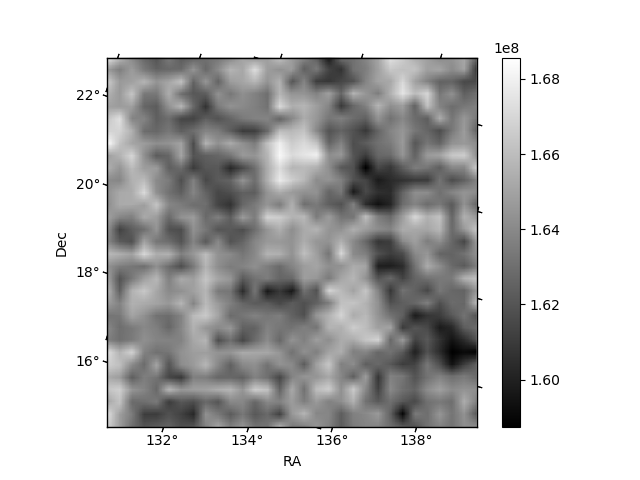
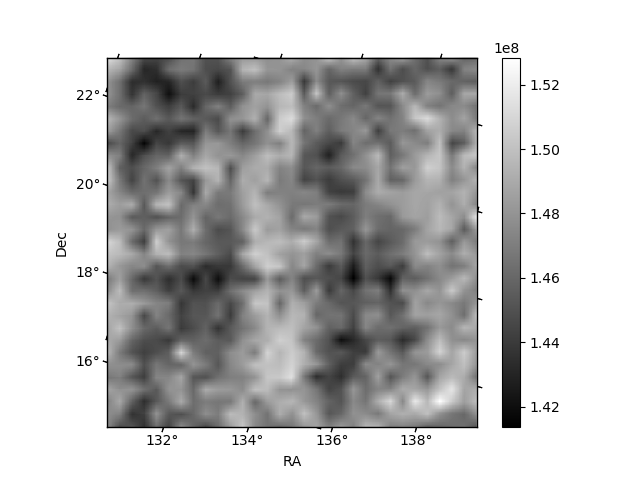
Histogram calculated using DETX and DETY for each event in the final _common_clean file
| Quadrant A | 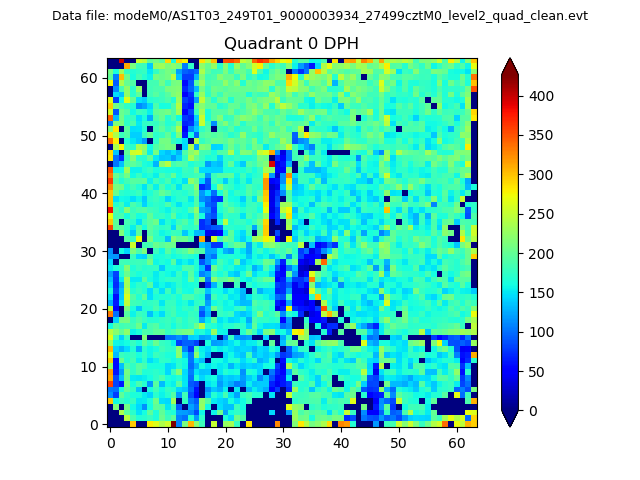 |
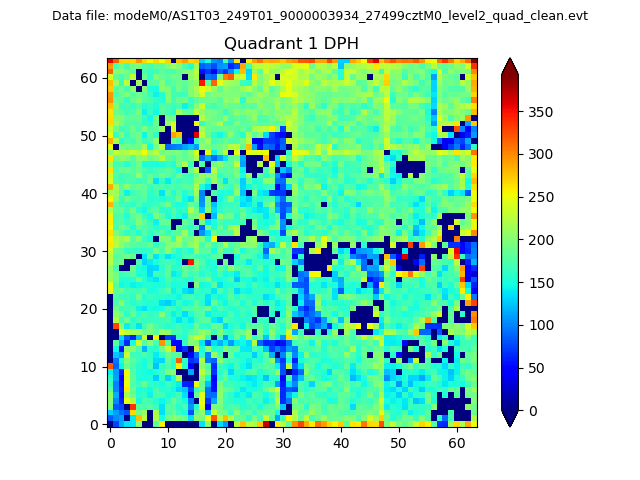 |
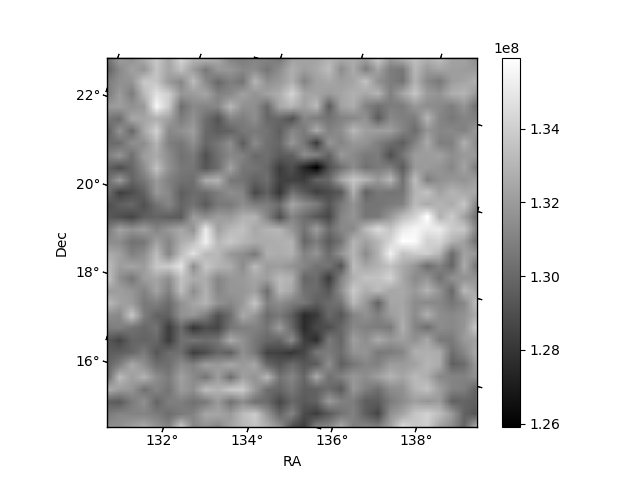
Quadrant B |
|---|---|---|---|
| Quadrant D | 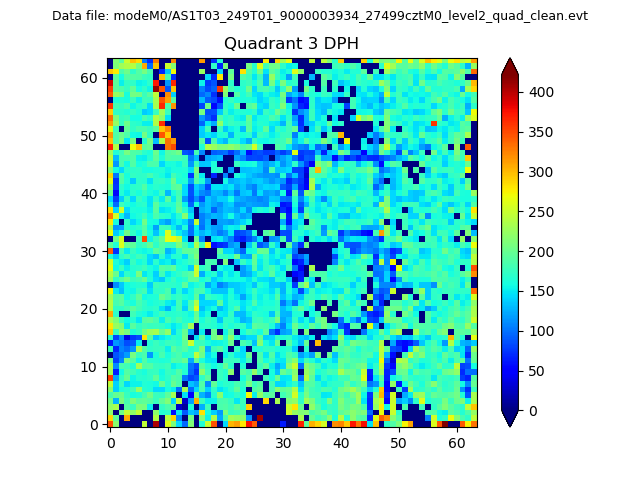 |
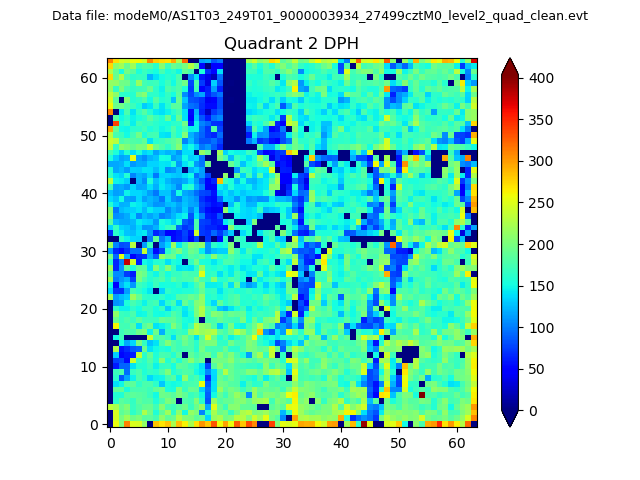 |
Quadrant C |
| Plot type | Count rate plots | Images |
|---|---|---|
| Comparison with Poisson distribution Blue bars denote a histogram of data divided into 1 sec bins. Red curve is a Poisson curve with rate = median count rate of data. |
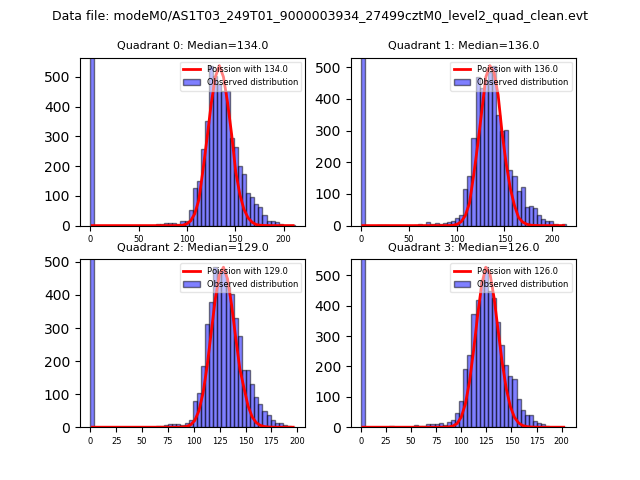 |
 |
| Quadrant-wise count rates Data is divided into 100 sec bins |
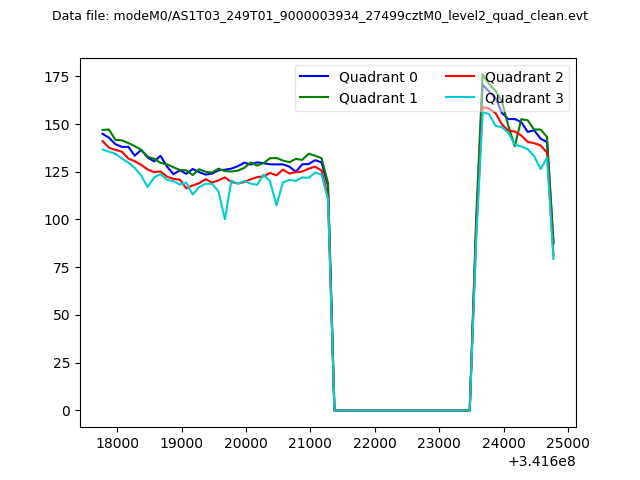 |
|
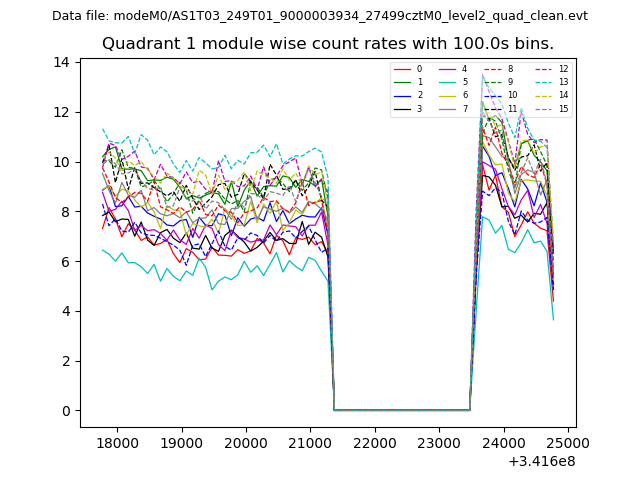
| Module-wise count rates for Quadrant A Data is divided into 100 sec bins |
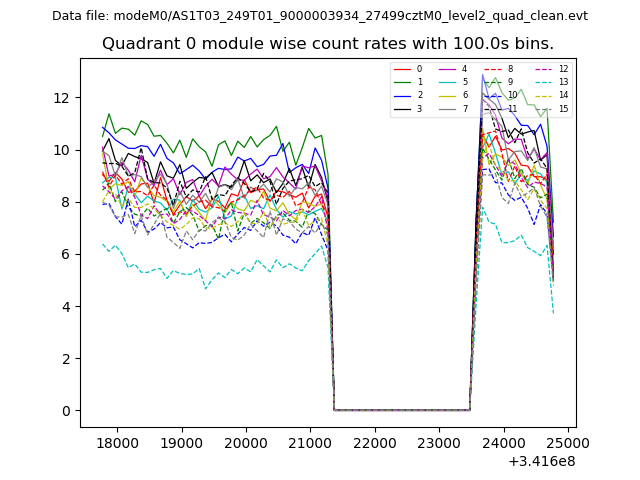 |
 |
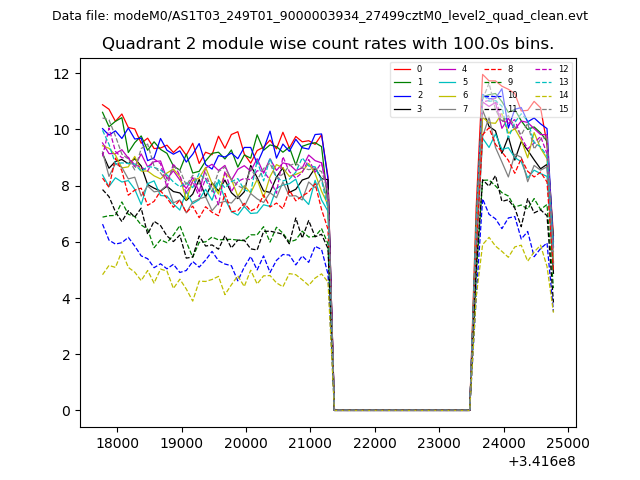
| Module-wise count rates for Quadrant B Data is divided into 100 sec bins |
 |
 |
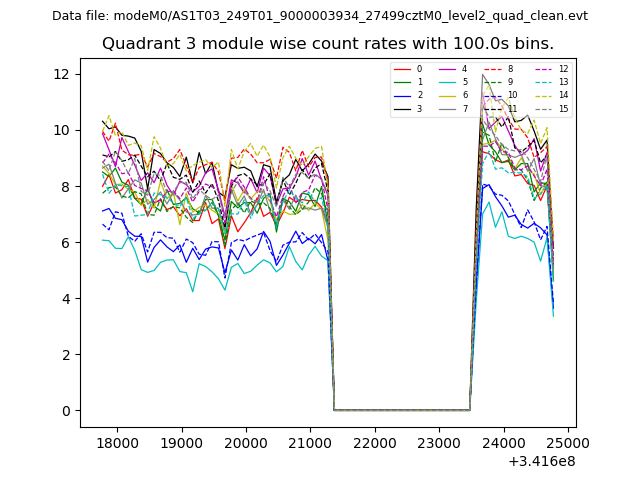
| Module-wise count rates for Quadrant C Data is divided into 100 sec bins |
 |
 |
| Module-wise count rates for Quadrant D Data is divided into 100 sec bins |
 |
 |
| Parameter | Plot |
|---|---|
| CZT HV Monitor | 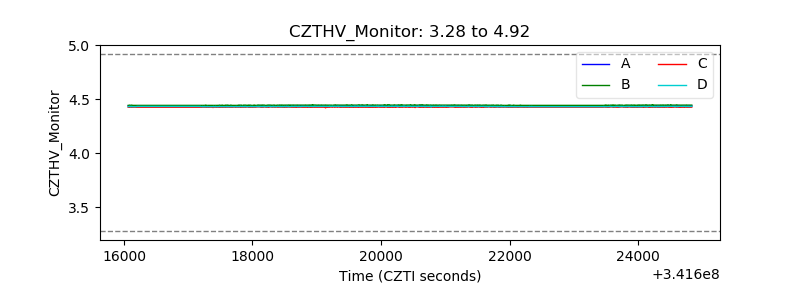 |
| D_VDD | 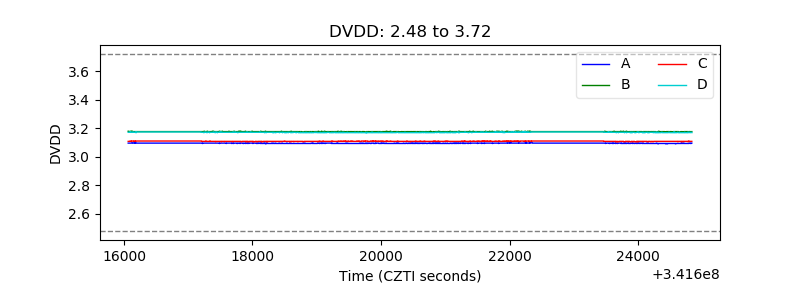 |
| Temperature 1 | 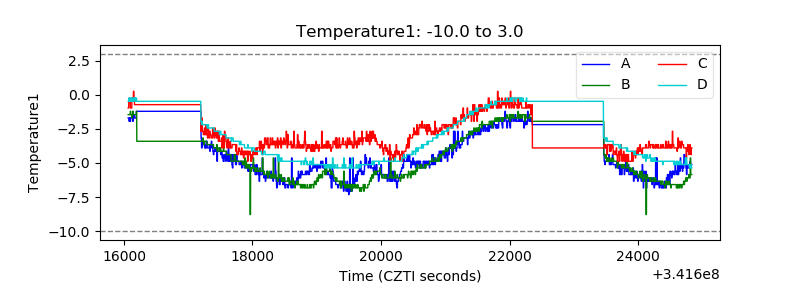 |
| Veto HV Monitor | 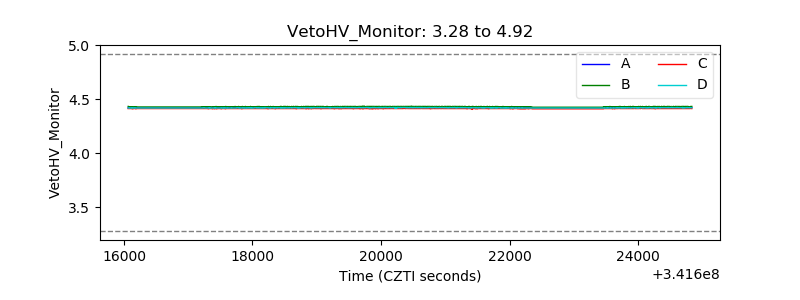 |
| Veto LLD | 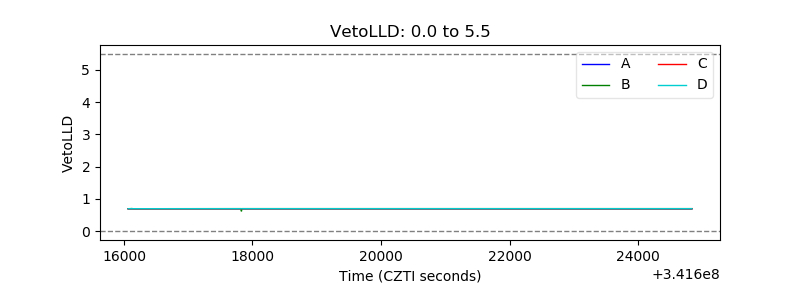 |
| Alpha Counter | 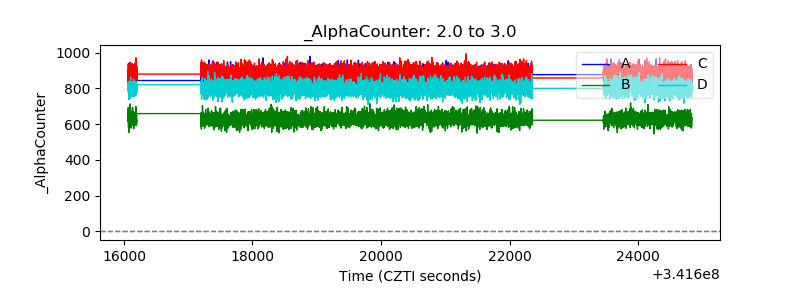 |
| _CPM_Rate | 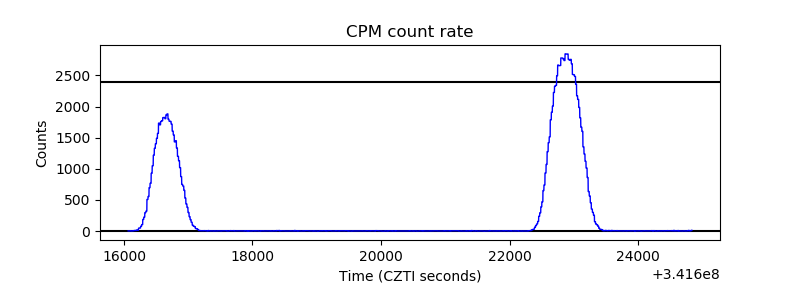 |
| CZT Counter | 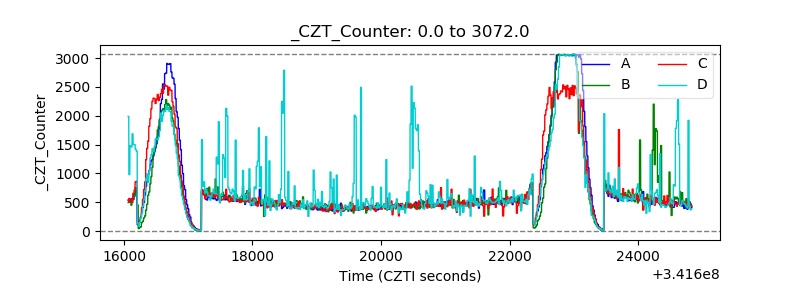 |
| +2.5 Volts monitor | 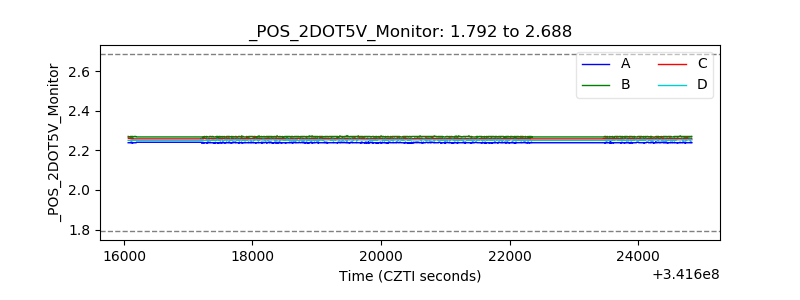 |
| +5 Volts monitor |  |
| _ROLL_ROT | 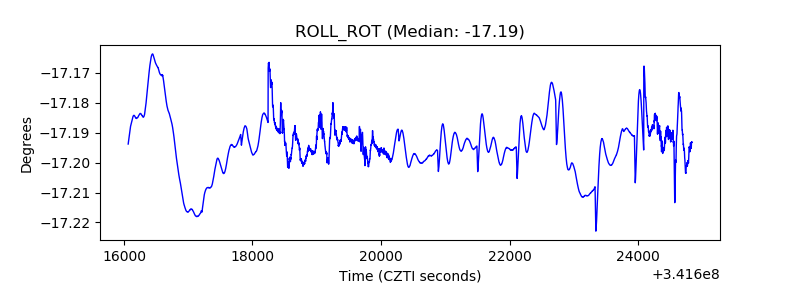 |
| _Roll_DEC | 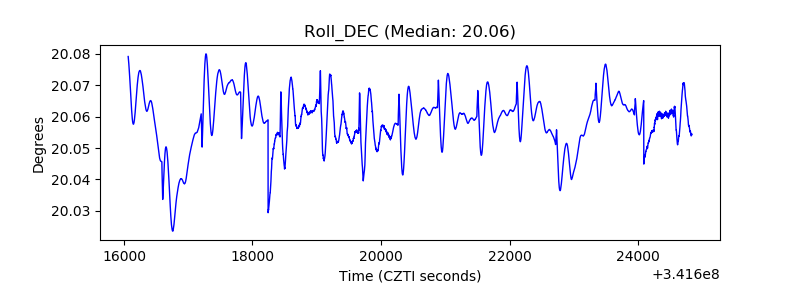 |
| _Roll_RA | 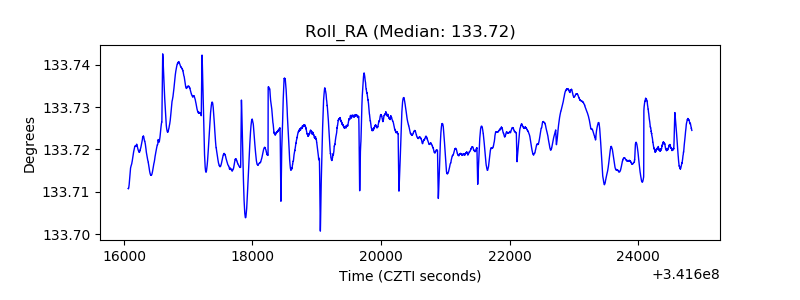 |
| Veto Counter | 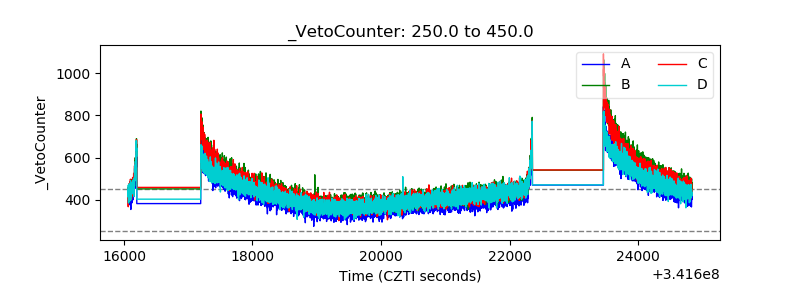 |