| Param | Original file | Final file |
|---|---|---|
| Filename | modeM0/AS1T03_249T01_9000003934_27501cztM0_level2.evt | modeM0/AS1T03_249T01_9000003934_27501cztM0_level2_quad_clean.evt |
| Size (bytes) | 505,255,680 | 114,868,800 |
| Size | 481.8 MB | 109.5 MB |
| Events in quadrant A | 3,376,352 | 777,169 |
| Events in quadrant B | 4,037,528 | 785,144 |
| Events in quadrant C | 3,400,768 | 742,454 |
| Events in quadrant D | 4,041,713 | 716,518 |
| Mode M0 | |||
|---|---|---|---|
| Quadrant | BADHDUFLAG | Total packets | Discarded packets |
| A | 0 | 14033 | 0 |
| B | 0 | 16138 | 0 |
| C | 0 | 14133 | 0 |
| D | 0 | 16306 | 0 |
| Mode M9 | |||
|---|---|---|---|
| Quadrant | BADHDUFLAG | Total packets | Discarded packets |
| A | 0 | 17 | 0 |
| B | 0 | 18 | 0 |
| C | 0 | 18 | 0 |
| D | 0 | 18 | 0 |
| Quadrant | Total seconds | Saturated seconds | Saturation percentage |
|---|---|---|---|
| A | 6566 | 30 | 0.456899% |
| B | 6566 | 227 | 3.457204% |
| C | 6566 | 77 | 1.172708% |
| D | 6566 | 154 | 2.345416% |
Noise dominated data is calculated using 1-second bins in cleaned event files. If a bin has >2000 counts, and if more than 50% of those come from <1% of pixels, then it is considered to be noise-dominated and hence unusable.
| Quadrant | # 1 sec bins | Bins with >0 counts | Bins with >2000 counts | High rate bins dominated by noise | Noise dominated (total time) | Noise dominated (detector-on time) | Marked lightcurve |
|---|---|---|---|---|---|---|---|
| A | 7866 | 6567 | 2 | 2 | 0.03% | 0.03% | 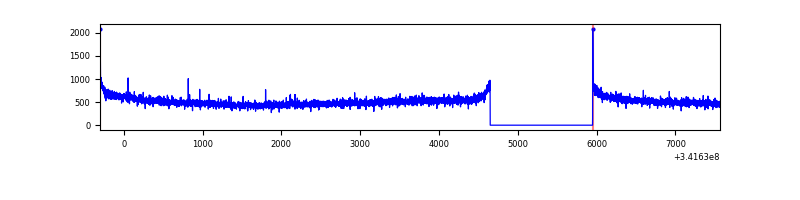 |
| B | 7866 | 6567 | 121 | 121 | 1.54% | 1.84% | 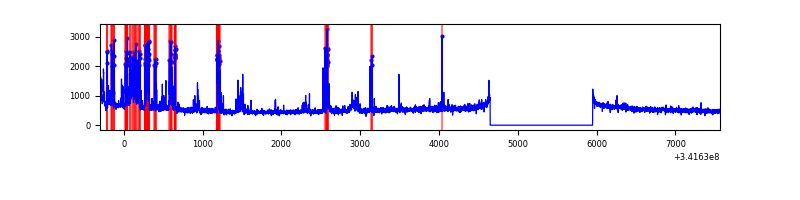 |
| C | 7866 | 6567 | 1 | 1 | 0.01% | 0.02% | 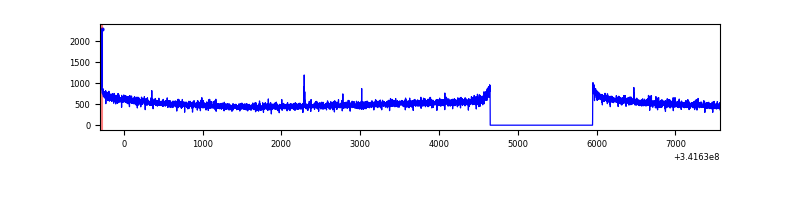 |
| D | 7866 | 6567 | 146 | 146 | 1.86% | 2.22% | 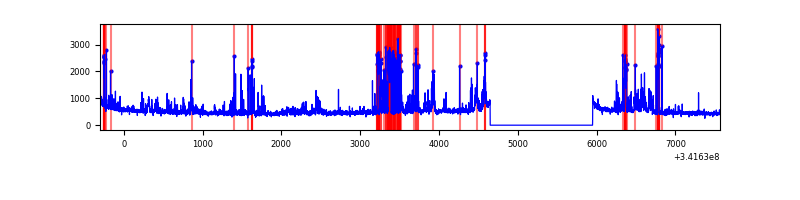 |
Top three noisy pixels from each quadrant. If the there are fewer than three noisy pixels in the level2.evt file, extra rows are filled as -1
| Pixel properties | Quadrant properties | ||||||
|---|---|---|---|---|---|---|---|
| Quadrant | DetID | PixID | Counts | Sigma | Mean | Median | Sigma |
| A | 8 | 192 | 11907 | 63.8 | 872 | 857 | 173.2 |
| A | 13 | 254 | 9940 | 52.44 | 872 | 857 | 173.2 |
| A | 3 | 137 | 7743 | 39.76 | 872 | 857 | 173.2 |
| B | 3 | 64 | 638726 | 3936.79 | 865 | 844 | 162.0 |
| B | 12 | 111 | 19278 | 113.77 | 865 | 844 | 162.0 |
| B | 11 | 111 | 17334 | 101.77 | 865 | 844 | 162.0 |
| C | 14 | 238 | 136283 | 699.38 | 833 | 840 | 193.7 |
| C | 10 | 22 | 11793 | 56.56 | 833 | 840 | 193.7 |
| C | 15 | 208 | 6498 | 29.22 | 833 | 840 | 193.7 |
| D | 1 | 52 | 834784 | 4224.54 | 824 | 803 | 197.4 |
| D | 2 | 250 | 56415 | 281.7 | 824 | 803 | 197.4 |
| D | 2 | 234 | 23593 | 115.44 | 824 | 803 | 197.4 |
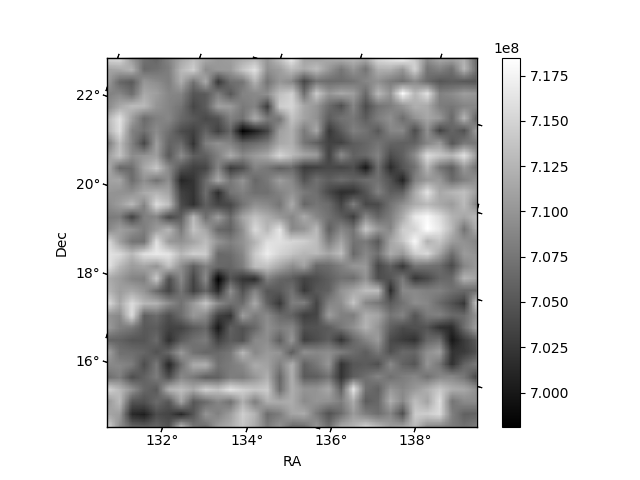
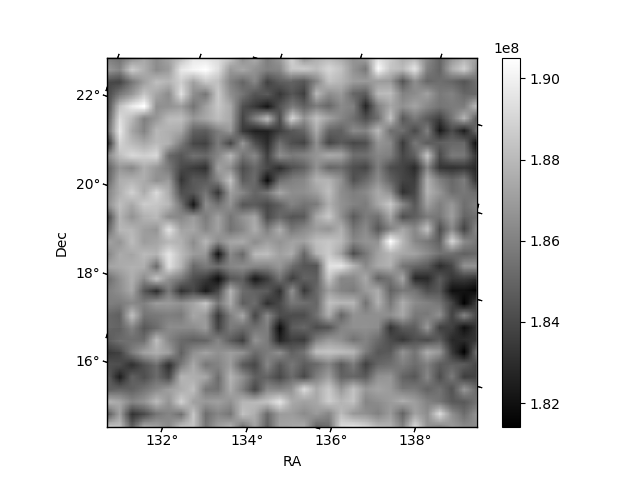
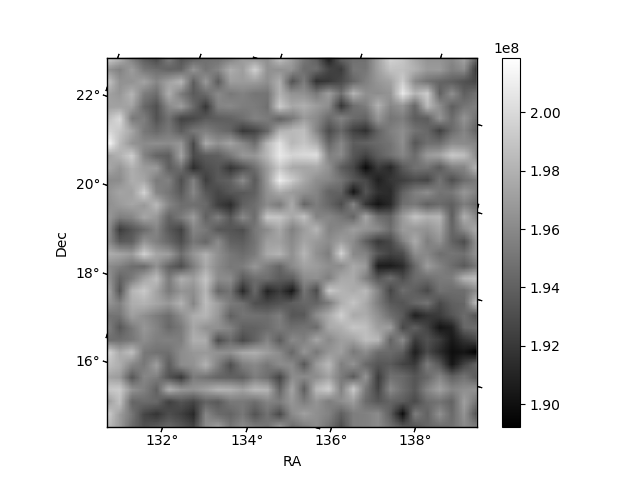
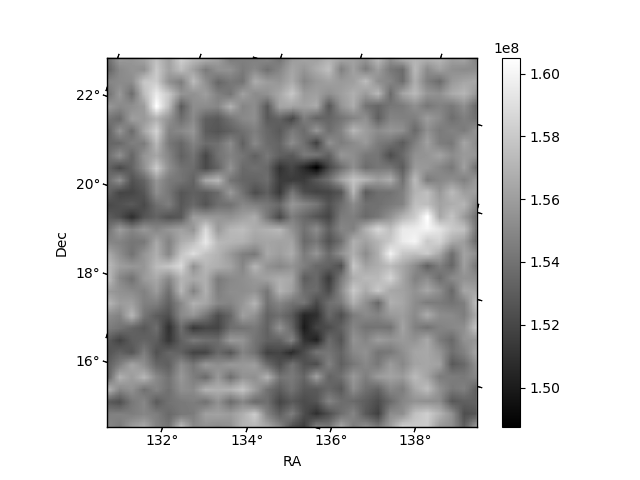
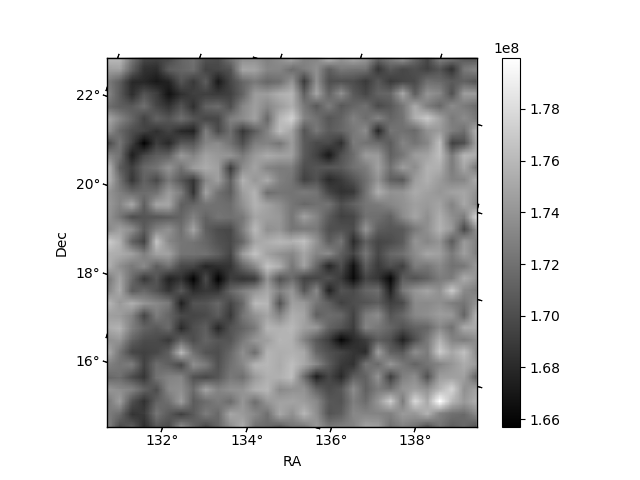
Histogram calculated using DETX and DETY for each event in the final _common_clean file
| Quadrant A | 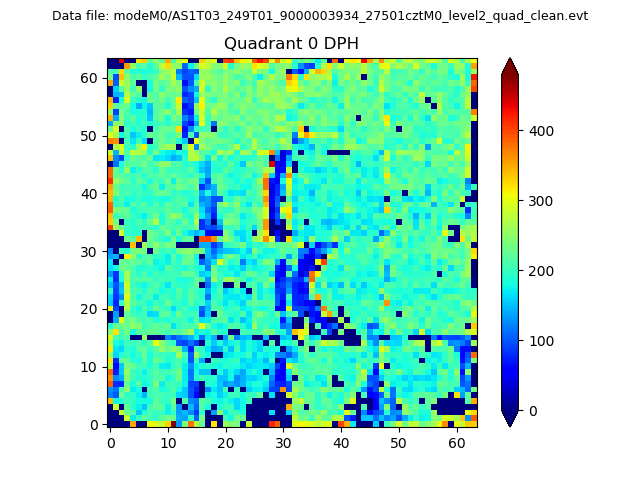 |
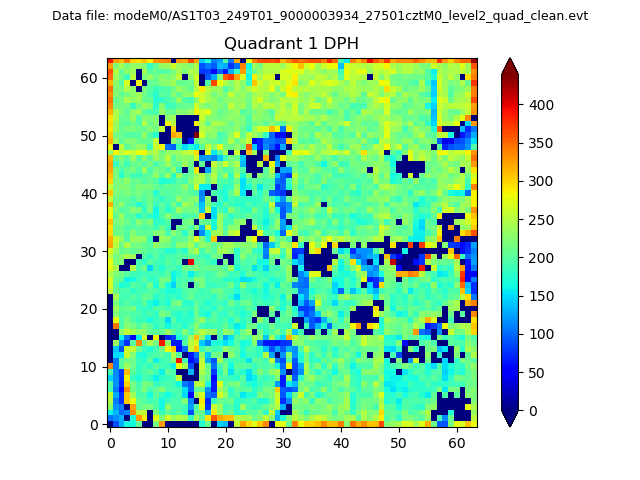 |
Quadrant B |
|---|---|---|---|
| Quadrant D | 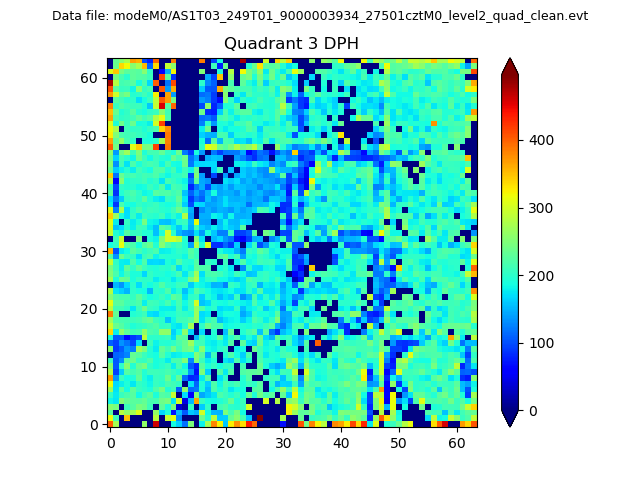 |
 |
Quadrant C |
| Plot type | Count rate plots | Images |
|---|---|---|
| Comparison with Poisson distribution Blue bars denote a histogram of data divided into 1 sec bins. Red curve is a Poisson curve with rate = median count rate of data. |
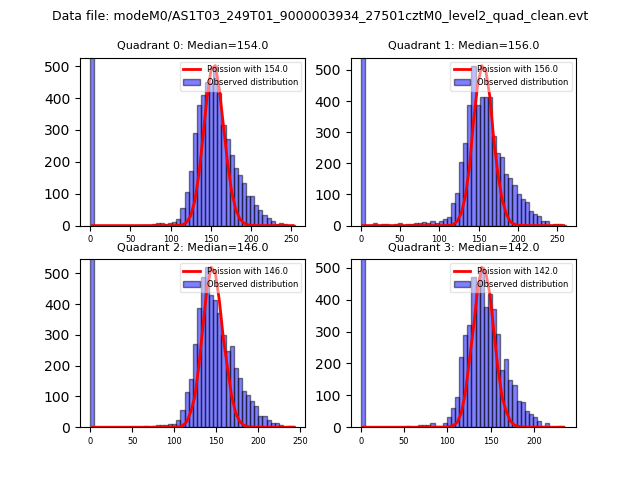 |
 |
| Quadrant-wise count rates Data is divided into 100 sec bins |
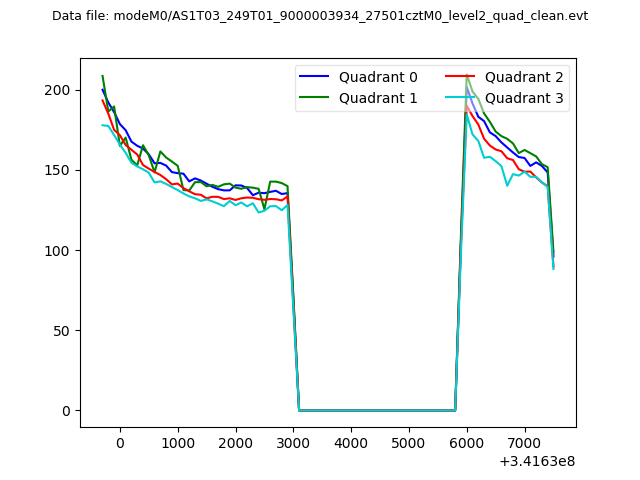 |
|
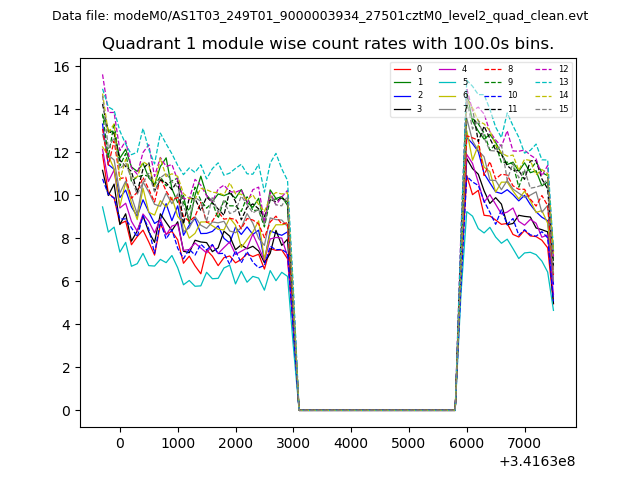
| Module-wise count rates for Quadrant A Data is divided into 100 sec bins |
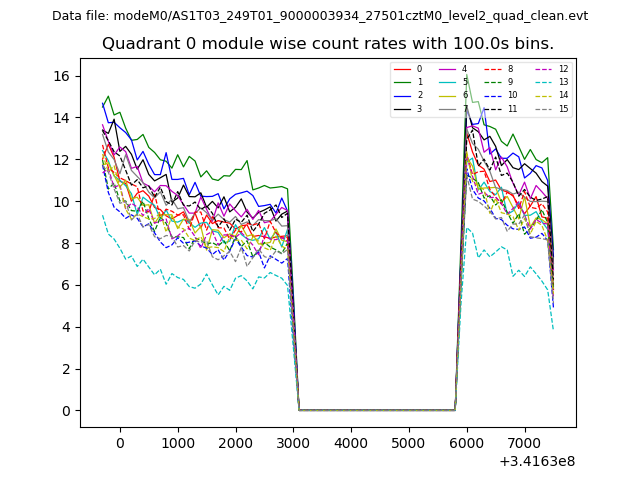 |
 |
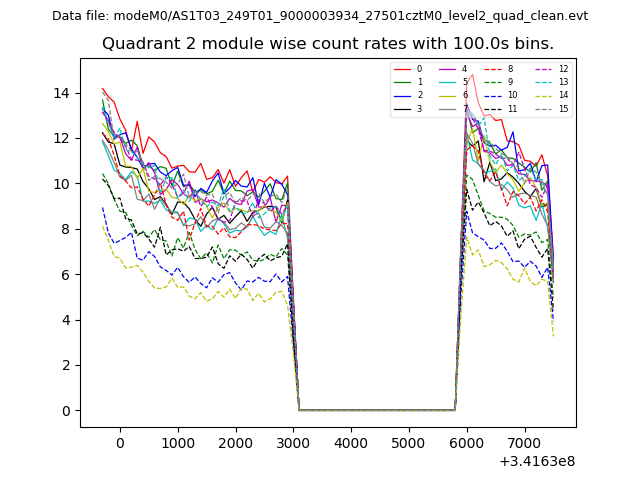
| Module-wise count rates for Quadrant B Data is divided into 100 sec bins |
 |
 |
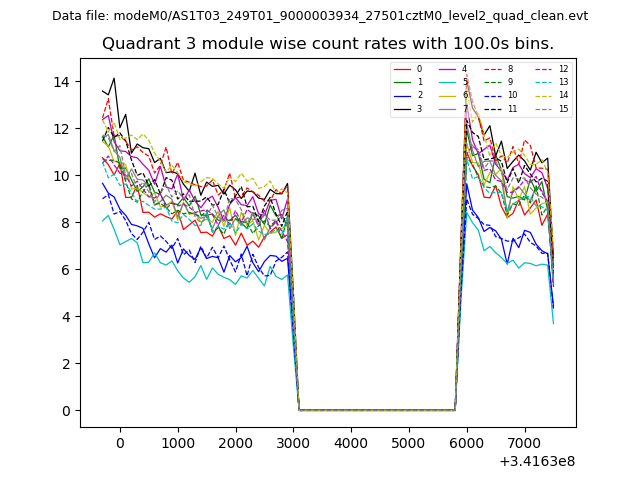
| Module-wise count rates for Quadrant C Data is divided into 100 sec bins |
 |
 |
| Module-wise count rates for Quadrant D Data is divided into 100 sec bins |
 |
 |
| Parameter | Plot |
|---|---|
| CZT HV Monitor | 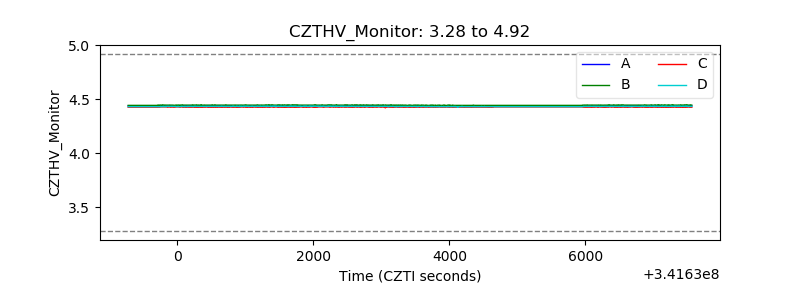 |
| D_VDD | 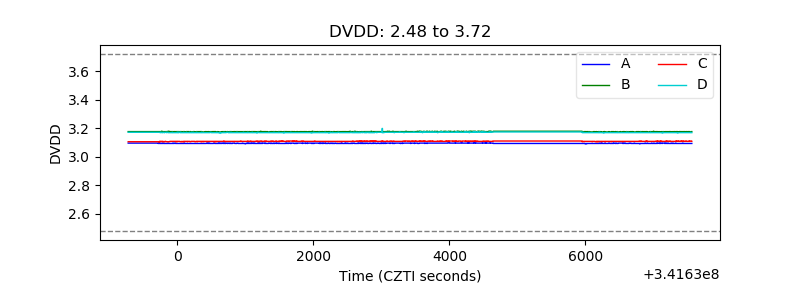 |
| Temperature 1 | 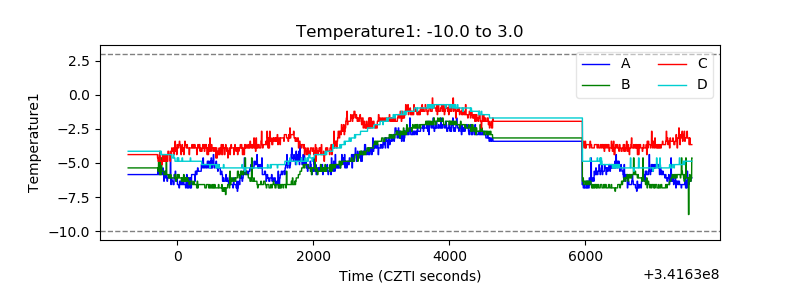 |
| Veto HV Monitor | 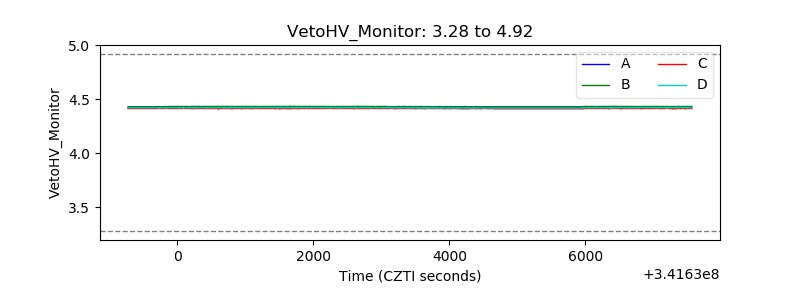 |
| Veto LLD | 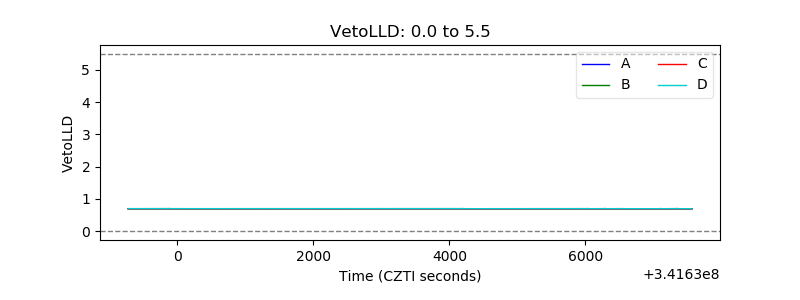 |
| Alpha Counter | 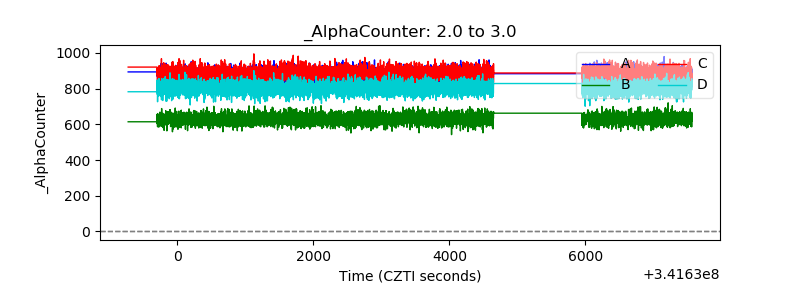 |
| _CPM_Rate | 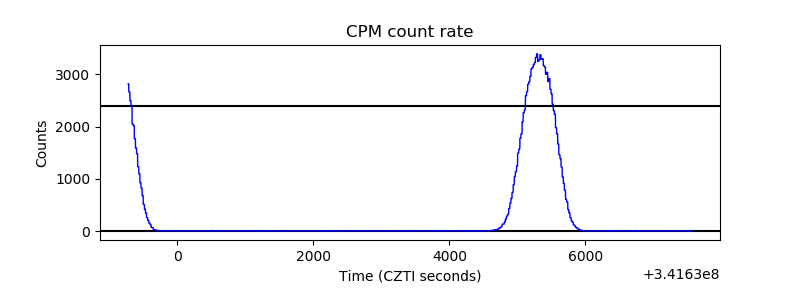 |
| CZT Counter | 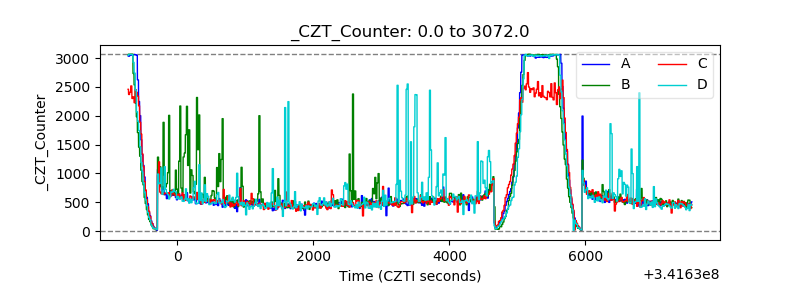 |
| +2.5 Volts monitor |  |
| +5 Volts monitor |  |
| _ROLL_ROT | 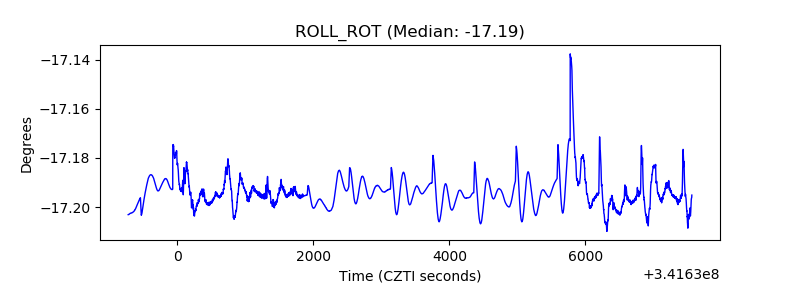 |
| _Roll_DEC | 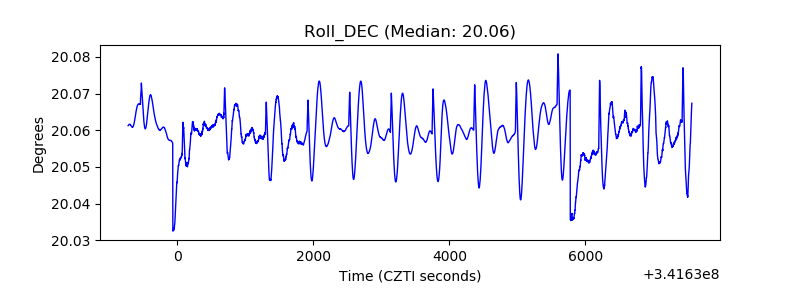 |
| _Roll_RA | 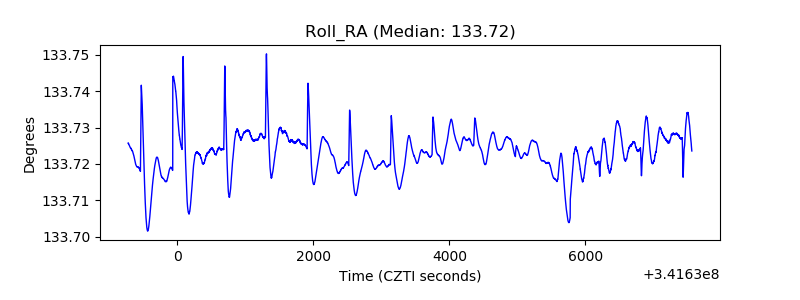 |
| Veto Counter | 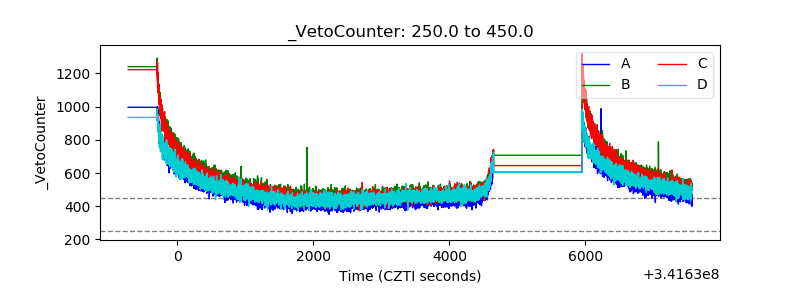 |