| Param | Original file | Final file |
|---|---|---|
| Filename | modeM0/AS1T03_249T01_9000003934_27502cztM0_level2.evt | modeM0/AS1T03_249T01_9000003934_27502cztM0_level2_quad_clean.evt |
| Size (bytes) | 769,469,760 | 161,735,040 |
| Size | 733.8 MB | 154.2 MB |
| Events in quadrant A | 5,375,064 | 1,066,533 |
| Events in quadrant B | 5,713,747 | 1,090,453 |
| Events in quadrant C | 5,418,946 | 1,018,966 |
| Events in quadrant D | 6,079,489 | 990,330 |
| Mode M0 | |||
|---|---|---|---|
| Quadrant | BADHDUFLAG | Total packets | Discarded packets |
| A | 0 | 22257 | 0 |
| B | 0 | 23349 | 0 |
| C | 0 | 22445 | 0 |
| D | 0 | 24920 | 0 |
| Mode M9 | |||
|---|---|---|---|
| Quadrant | BADHDUFLAG | Total packets | Discarded packets |
| A | 0 | 26 | 0 |
| B | 0 | 26 | 0 |
| C | 0 | 26 | 0 |
| D | 0 | 26 | 0 |
| Quadrant | Total seconds | Saturated seconds | Saturation percentage |
|---|---|---|---|
| A | 10578 | 83 | 0.784647% |
| B | 10578 | 163 | 1.540934% |
| C | 10577 | 141 | 1.333081% |
| D | 10577 | 189 | 1.786896% |
Noise dominated data is calculated using 1-second bins in cleaned event files. If a bin has >2000 counts, and if more than 50% of those come from <1% of pixels, then it is considered to be noise-dominated and hence unusable.
| Quadrant | # 1 sec bins | Bins with >0 counts | Bins with >2000 counts | High rate bins dominated by noise | Noise dominated (total time) | Noise dominated (detector-on time) | Marked lightcurve |
|---|---|---|---|---|---|---|---|
| A | 13193 | 10579 | 2 | 2 | 0.02% | 0.02% |  |
| B | 13193 | 10579 | 47 | 47 | 0.36% | 0.44% |  |
| C | 13192 | 10578 | 3 | 3 | 0.02% | 0.03% |  |
| D | 13192 | 10579 | 149 | 149 | 1.13% | 1.41% |  |
Top three noisy pixels from each quadrant. If the there are fewer than three noisy pixels in the level2.evt file, extra rows are filled as -1
| Pixel properties | Quadrant properties | ||||||
|---|---|---|---|---|---|---|---|
| Quadrant | DetID | PixID | Counts | Sigma | Mean | Median | Sigma |
| A | 13 | 254 | 15815 | 52.57 | 1388 | 1363 | 274.9 |
| A | 3 | 137 | 12538 | 40.65 | 1388 | 1363 | 274.9 |
| A | 8 | 192 | 12092 | 39.03 | 1388 | 1363 | 274.9 |
| B | 3 | 64 | 268311 | 1038.17 | 1381 | 1350 | 257.1 |
| B | 12 | 111 | 30783 | 114.46 | 1381 | 1350 | 257.1 |
| B | 11 | 111 | 27734 | 102.6 | 1381 | 1350 | 257.1 |
| C | 14 | 238 | 216065 | 700.16 | 1324 | 1333 | 306.7 |
| C | 15 | 208 | 25357 | 78.33 | 1324 | 1333 | 306.7 |
| C | 10 | 22 | 20592 | 62.79 | 1324 | 1333 | 306.7 |
| D | 1 | 52 | 926928 | 2945.92 | 1322 | 1292 | 314.2 |
| D | 2 | 250 | 82570 | 258.67 | 1322 | 1292 | 314.2 |
| D | 14 | 35 | 46579 | 144.13 | 1322 | 1292 | 314.2 |
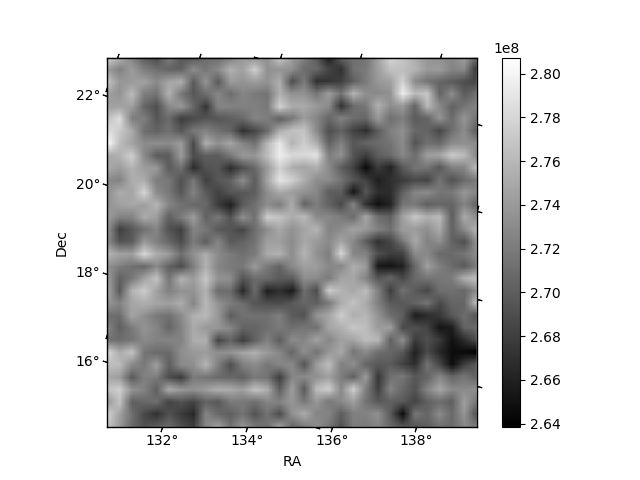
Histogram calculated using DETX and DETY for each event in the final _common_clean file
| Quadrant A | 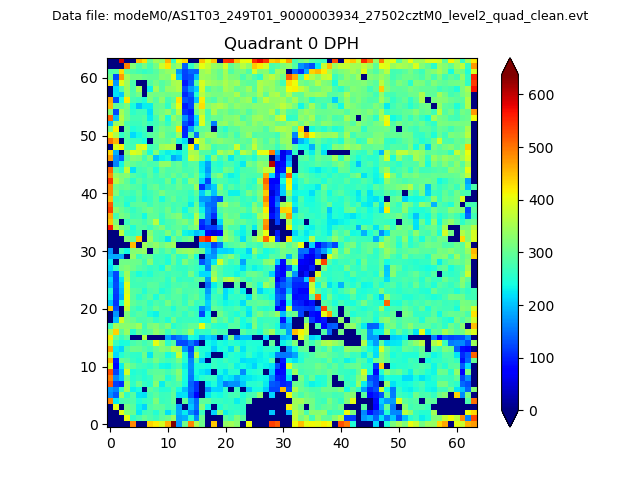 |
 |
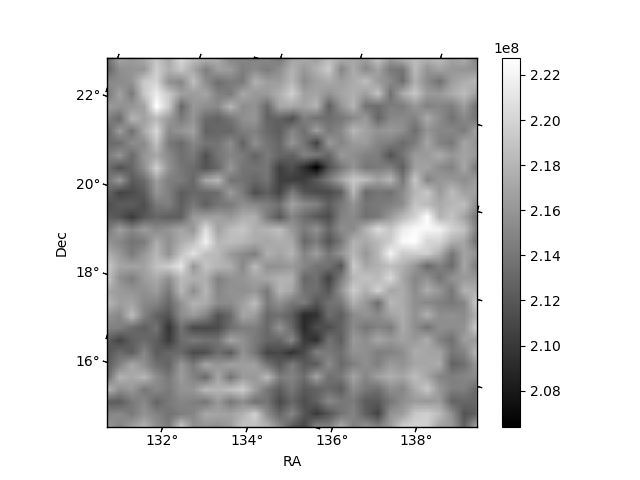
Quadrant B |
|---|---|---|---|
| Quadrant D | 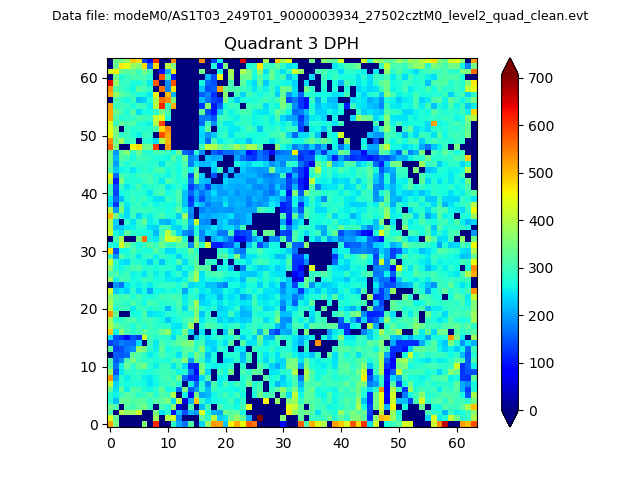 |
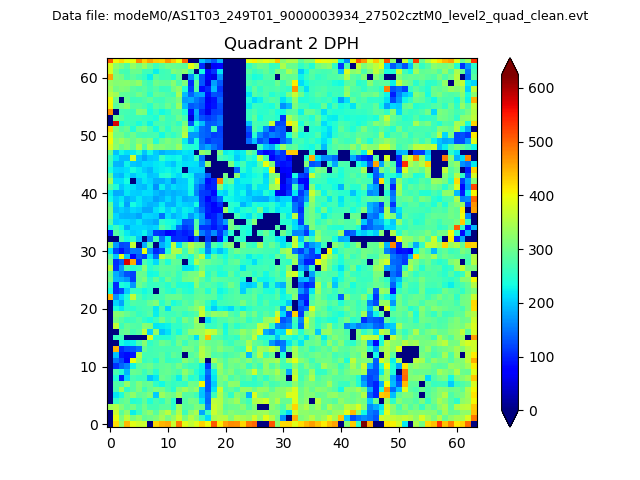 |
Quadrant C |
| Plot type | Count rate plots | Images |
|---|---|---|
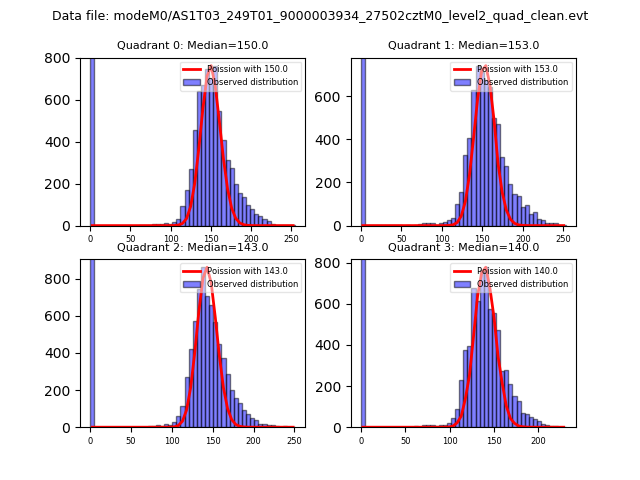
| Comparison with Poisson distribution Blue bars denote a histogram of data divided into 1 sec bins. Red curve is a Poisson curve with rate = median count rate of data. |
 |
 |
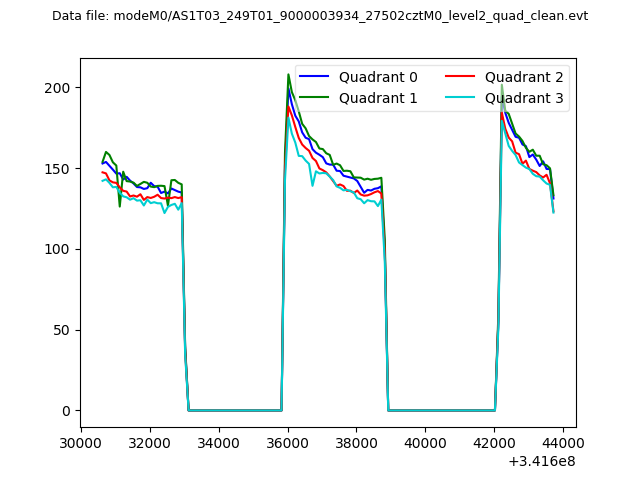
| Quadrant-wise count rates Data is divided into 100 sec bins |
 |
|
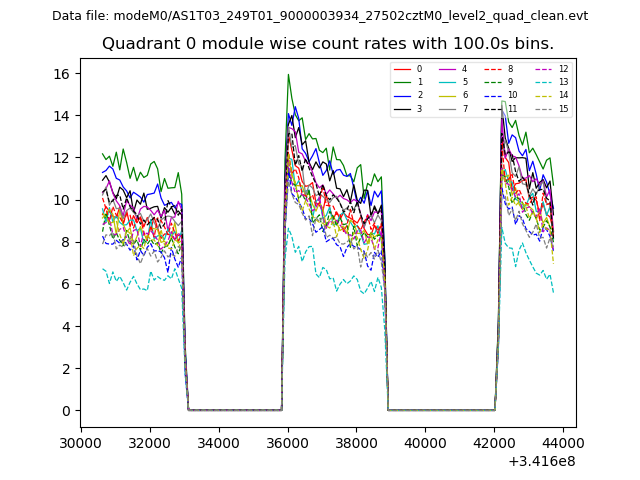
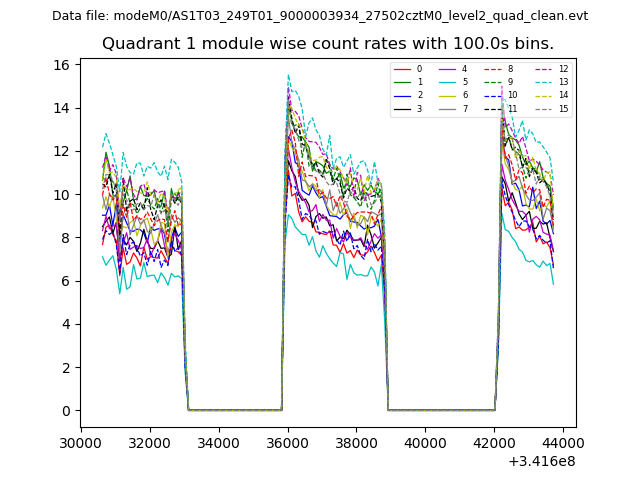
| Module-wise count rates for Quadrant A Data is divided into 100 sec bins |
 |
 |
| Module-wise count rates for Quadrant B Data is divided into 100 sec bins |
 |
 |
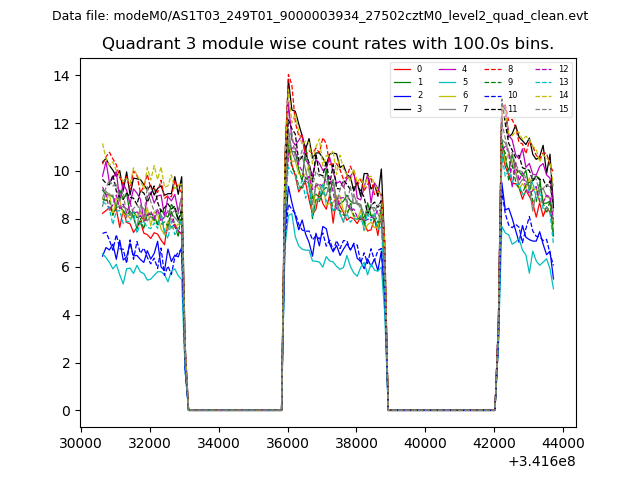
| Module-wise count rates for Quadrant C Data is divided into 100 sec bins |
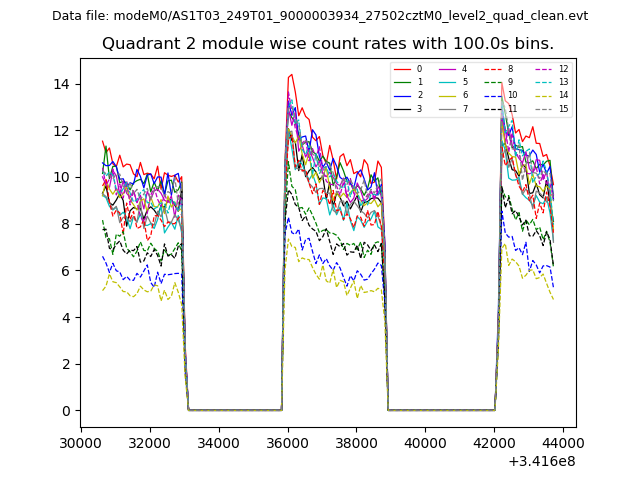 |
 |
| Module-wise count rates for Quadrant D Data is divided into 100 sec bins |
 |
 |
| Parameter | Plot |
|---|---|
| CZT HV Monitor | 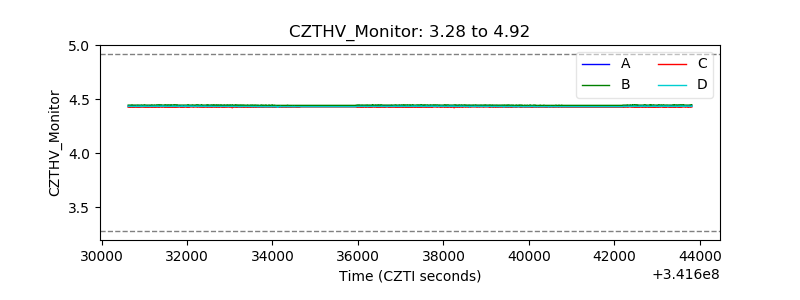 |
| D_VDD | 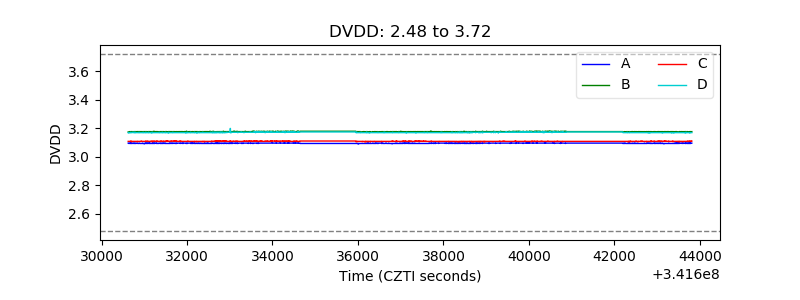 |
| Temperature 1 | 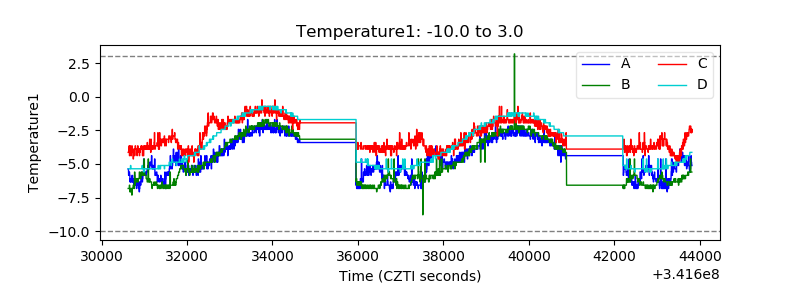 |
| Veto HV Monitor | 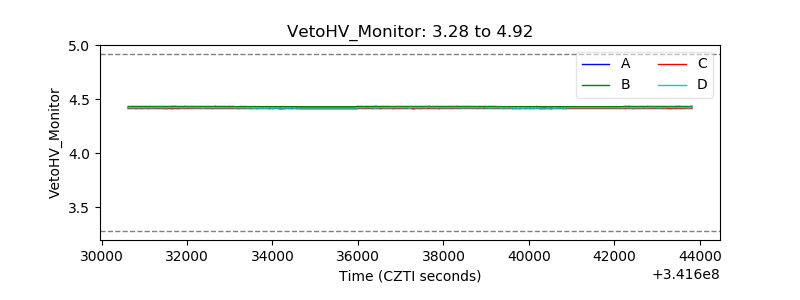 |
| Veto LLD | 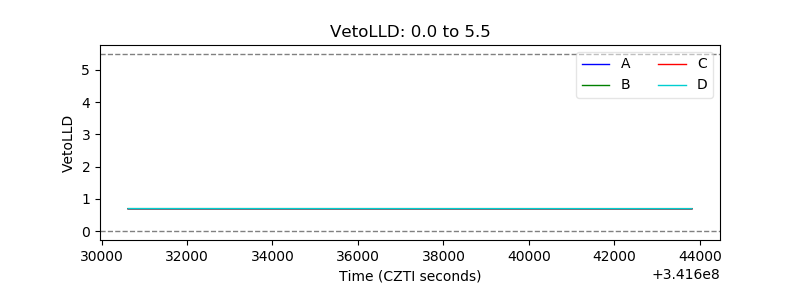 |
| Alpha Counter | 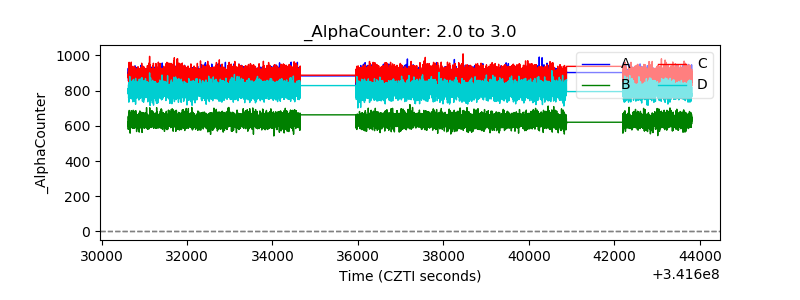 |
| _CPM_Rate | 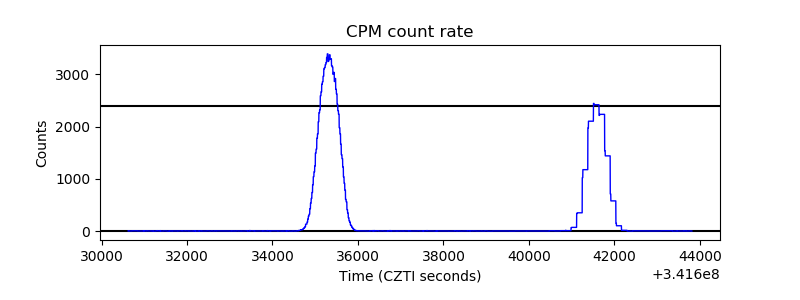 |
| CZT Counter | 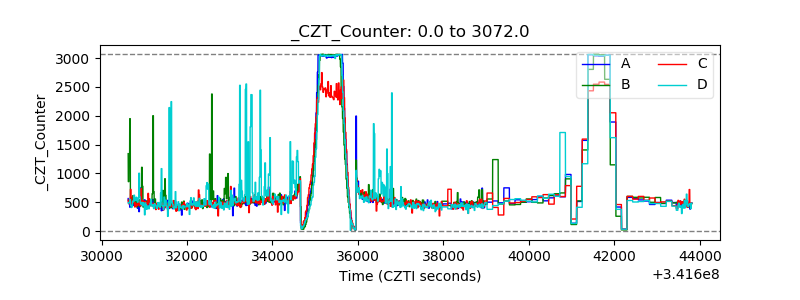 |
| +2.5 Volts monitor | 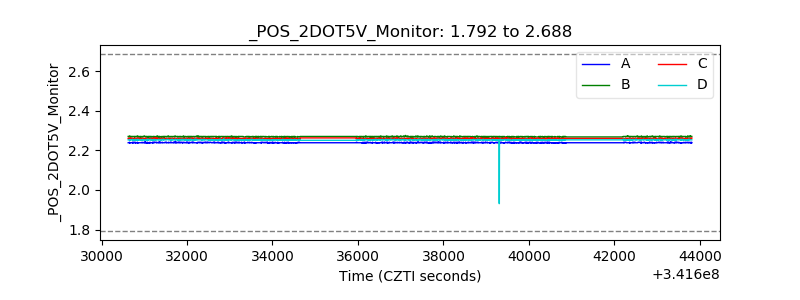 |
| +5 Volts monitor |  |
| _ROLL_ROT | 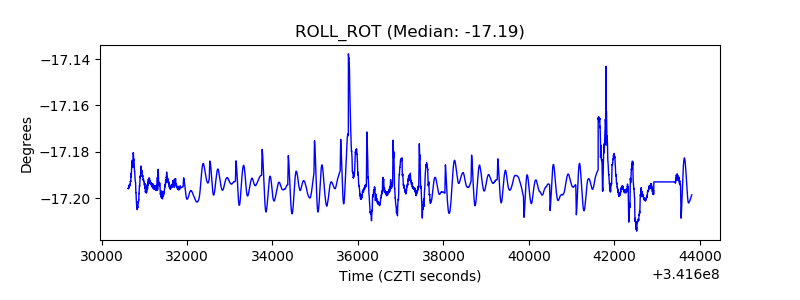 |
| _Roll_DEC |  |
| _Roll_RA | 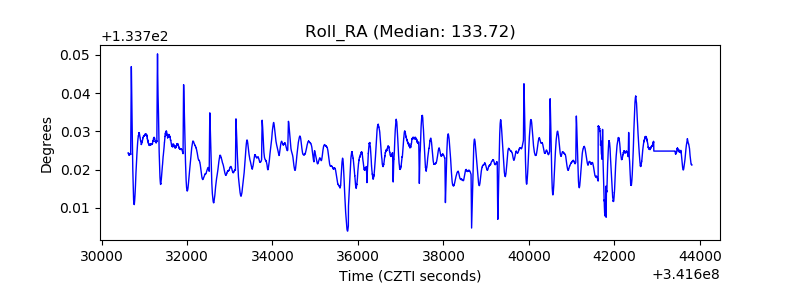 |
| Veto Counter | 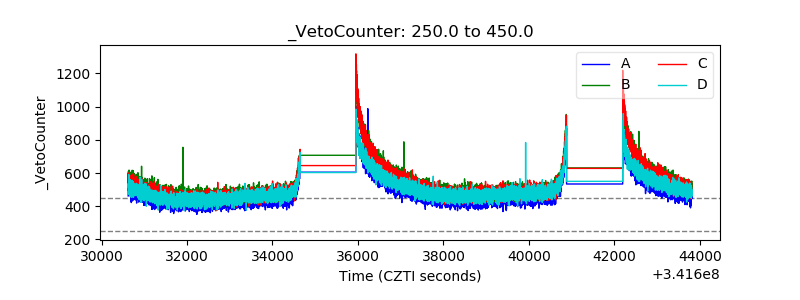 |