| Param | Original file | Final file |
|---|---|---|
| Filename | modeM0/AS1T03_249T01_9000003934_27503cztM0_level2.evt | modeM0/AS1T03_249T01_9000003934_27503cztM0_level2_quad_clean.evt |
| Size (bytes) | 479,367,360 | 99,561,600 |
| Size | 457.2 MB | 94.9 MB |
| Events in quadrant A | 3,335,826 | 655,812 |
| Events in quadrant B | 3,362,219 | 668,467 |
| Events in quadrant C | 3,335,887 | 626,739 |
| Events in quadrant D | 4,043,401 | 611,701 |
| Mode M0 | |||
|---|---|---|---|
| Quadrant | BADHDUFLAG | Total packets | Discarded packets |
| A | 0 | 13707 | 0 |
| B | 0 | 13784 | 0 |
| C | 0 | 13726 | 0 |
| D | 0 | 16227 | 0 |
| Mode M9 | |||
|---|---|---|---|
| Quadrant | BADHDUFLAG | Total packets | Discarded packets |
| A | 0 | 16 | 0 |
| B | 0 | 17 | 0 |
| C | 0 | 17 | 0 |
| D | 0 | 17 | 0 |
| Quadrant | Total seconds | Saturated seconds | Saturation percentage |
|---|---|---|---|
| A | 6493 | 30 | 0.462036% |
| B | 6493 | 57 | 0.877868% |
| C | 6493 | 92 | 1.416911% |
| D | 6493 | 106 | 1.632527% |
Noise dominated data is calculated using 1-second bins in cleaned event files. If a bin has >2000 counts, and if more than 50% of those come from <1% of pixels, then it is considered to be noise-dominated and hence unusable.
| Quadrant | # 1 sec bins | Bins with >0 counts | Bins with >2000 counts | High rate bins dominated by noise | Noise dominated (total time) | Noise dominated (detector-on time) | Marked lightcurve |
|---|---|---|---|---|---|---|---|
| A | 7773 | 6494 | 0 | 0 | 0.00% | 0.00% | 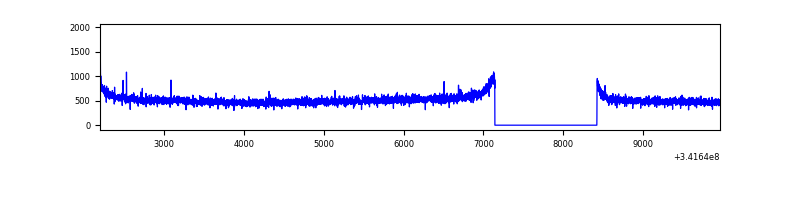 |
| B | 7773 | 6493 | 0 | 0 | 0.00% | 0.00% | 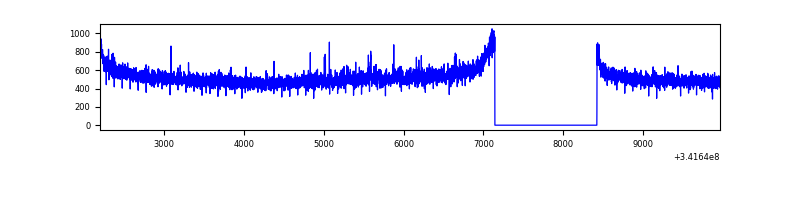 |
| C | 7773 | 6493 | 0 | 0 | 0.00% | 0.00% | 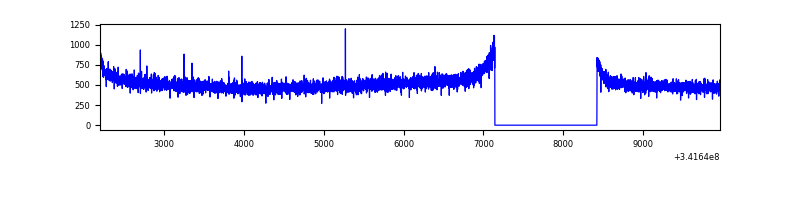 |
| D | 7773 | 6494 | 82 | 82 | 1.05% | 1.26% | 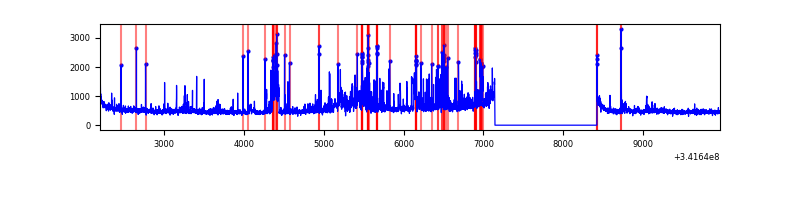 |
Top three noisy pixels from each quadrant. If the there are fewer than three noisy pixels in the level2.evt file, extra rows are filled as -1
| Pixel properties | Quadrant properties | ||||||
|---|---|---|---|---|---|---|---|
| Quadrant | DetID | PixID | Counts | Sigma | Mean | Median | Sigma |
| A | 4 | 2 | 10647 | 57.48 | 861 | 844 | 170.6 |
| A | 13 | 254 | 10040 | 53.92 | 861 | 844 | 170.6 |
| A | 3 | 137 | 7769 | 40.6 | 861 | 844 | 170.6 |
| B | 12 | 111 | 19174 | 114.13 | 856 | 836 | 160.7 |
| B | 11 | 111 | 17226 | 102.01 | 856 | 836 | 160.7 |
| B | 14 | 111 | 16166 | 95.41 | 856 | 836 | 160.7 |
| C | 14 | 238 | 135265 | 701.58 | 822 | 829 | 191.6 |
| C | 13 | 61 | 5732 | 25.59 | 822 | 829 | 191.6 |
| C | 15 | 78 | 1992 | 6.07 | 822 | 829 | 191.6 |
| D | 1 | 52 | 773712 | 3946.87 | 822 | 801 | 195.8 |
| D | 12 | 233 | 104500 | 529.54 | 822 | 801 | 195.8 |
| D | 2 | 250 | 29340 | 145.73 | 822 | 801 | 195.8 |
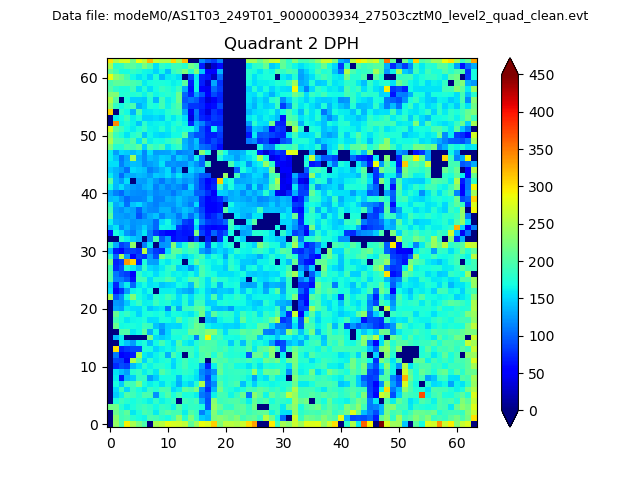
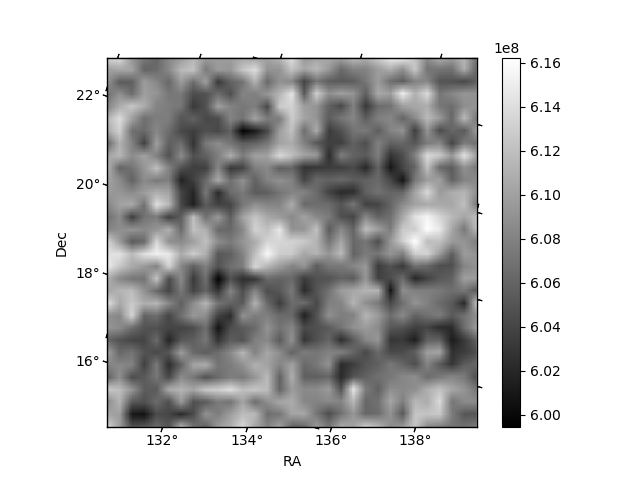
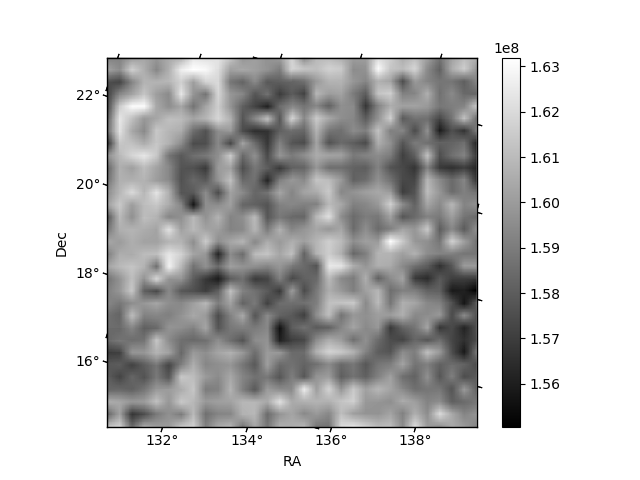
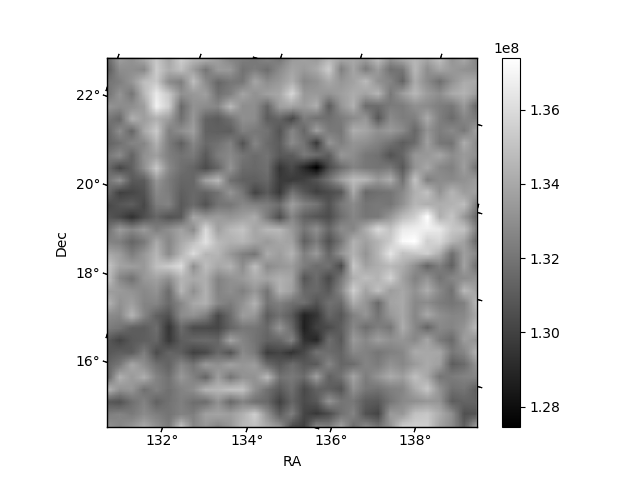
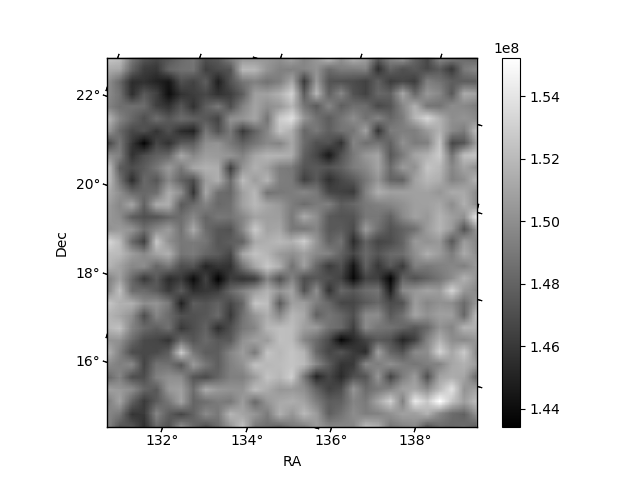
Histogram calculated using DETX and DETY for each event in the final _common_clean file
| Quadrant A | 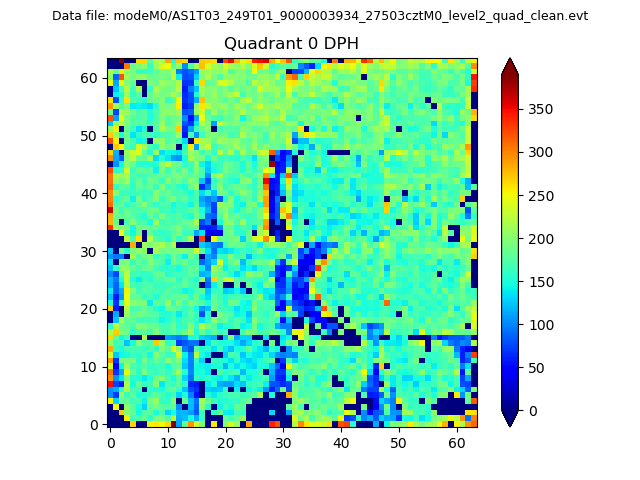 |
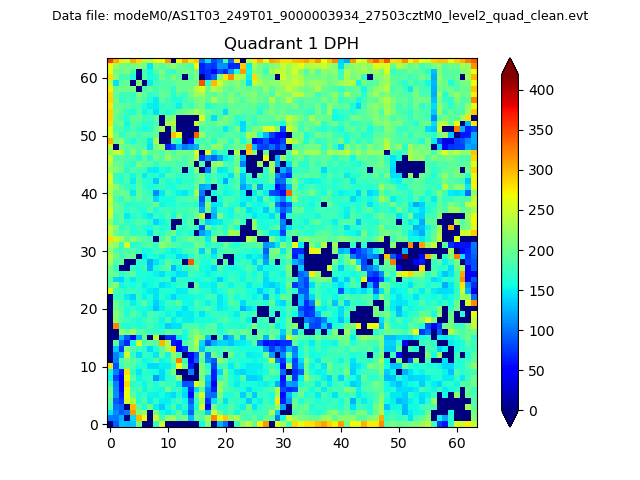 |
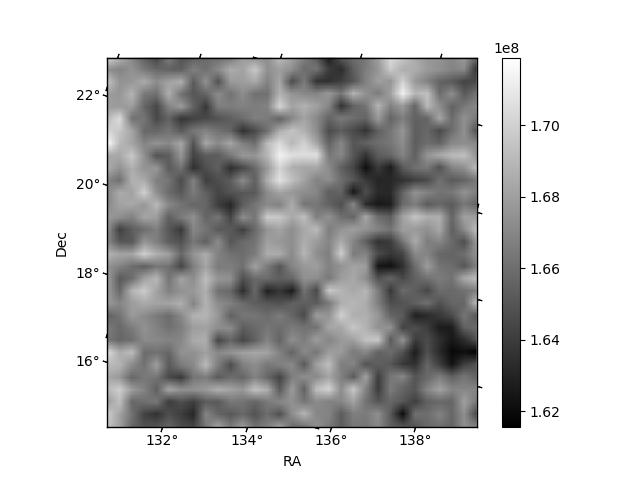
Quadrant B |
|---|---|---|---|
| Quadrant D | 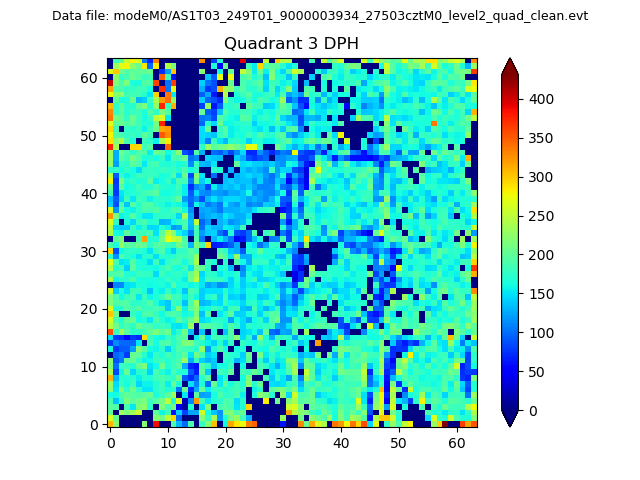 |
 |
Quadrant C |
| Plot type | Count rate plots | Images |
|---|---|---|
| Comparison with Poisson distribution Blue bars denote a histogram of data divided into 1 sec bins. Red curve is a Poisson curve with rate = median count rate of data. |
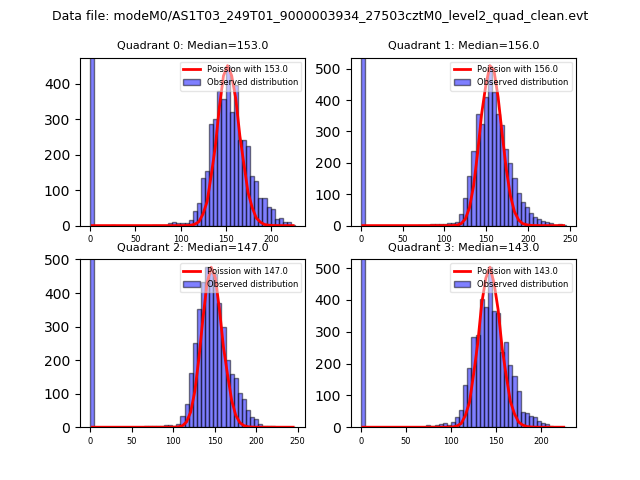 |
 |
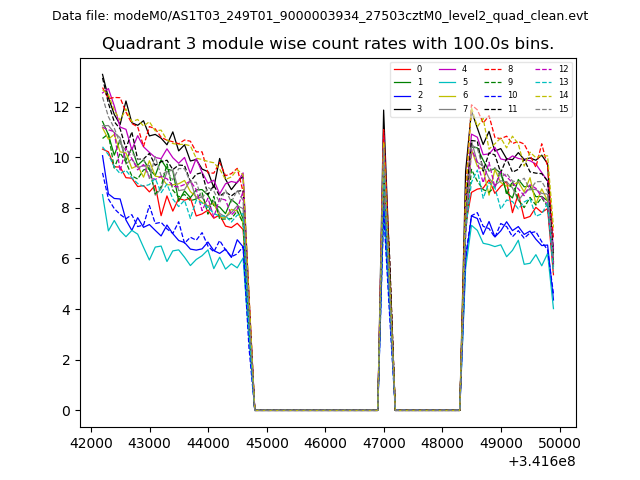
| Quadrant-wise count rates Data is divided into 100 sec bins |
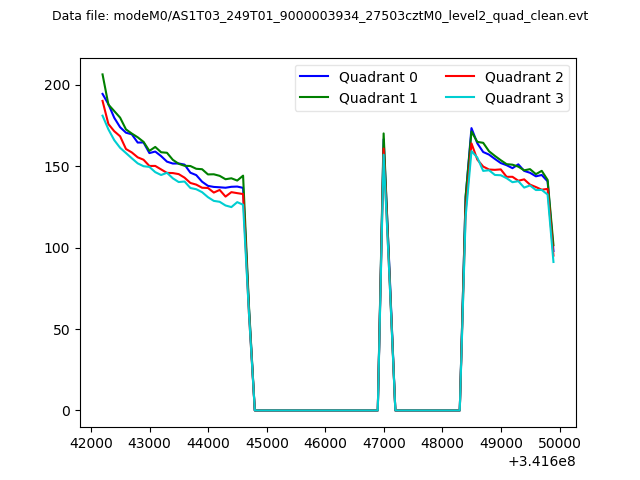 |
|
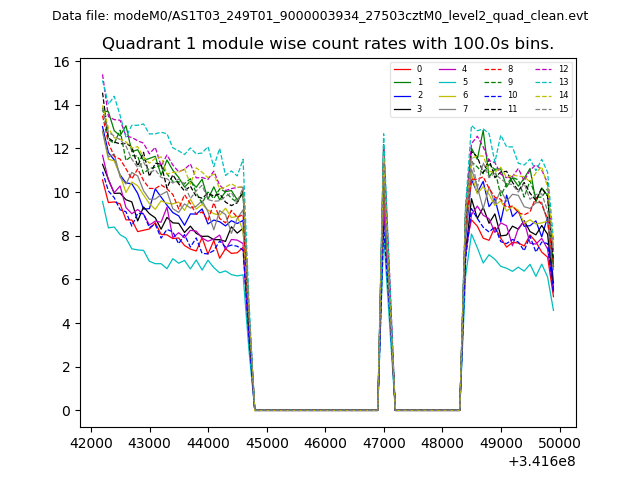
| Module-wise count rates for Quadrant A Data is divided into 100 sec bins |
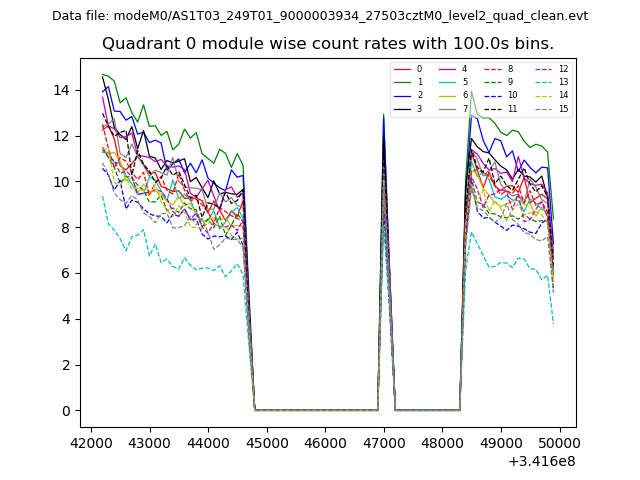 |
 |
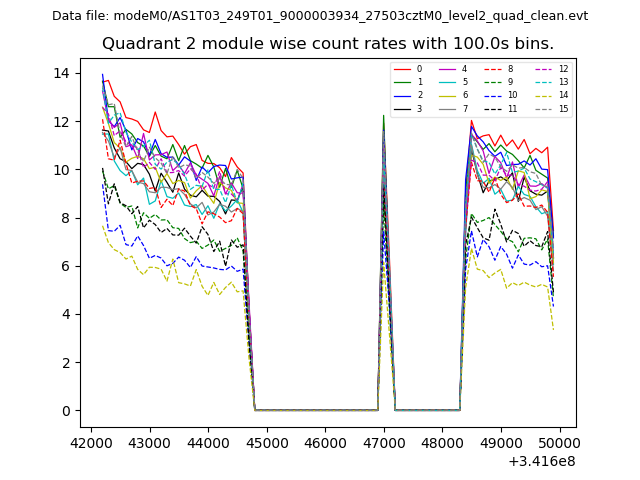
| Module-wise count rates for Quadrant B Data is divided into 100 sec bins |
 |
 |
| Module-wise count rates for Quadrant C Data is divided into 100 sec bins |
 |
 |
| Module-wise count rates for Quadrant D Data is divided into 100 sec bins |
 |
 |
| Parameter | Plot |
|---|---|
| CZT HV Monitor | 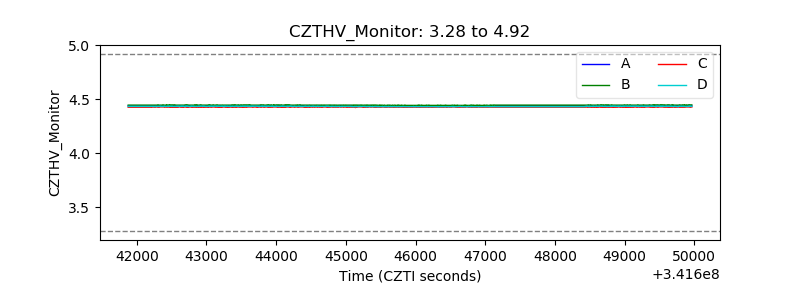 |
| D_VDD | 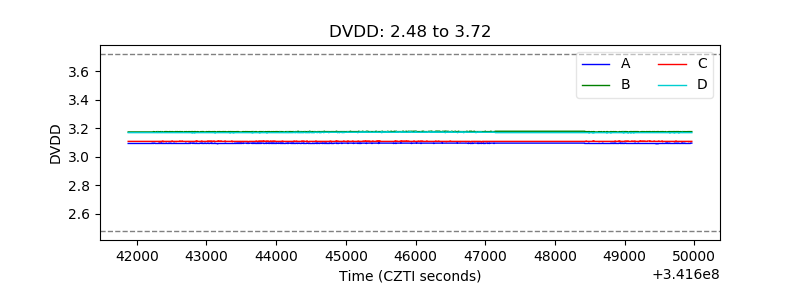 |
| Temperature 1 | 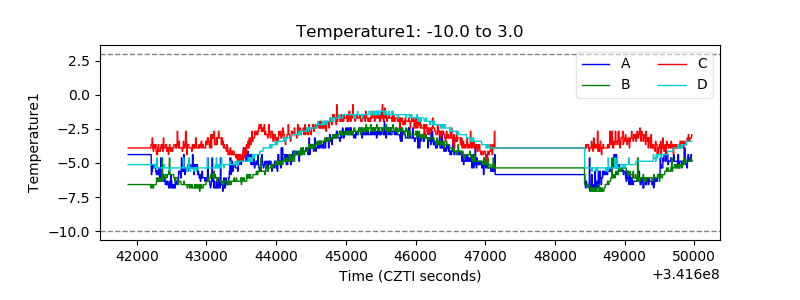 |
| Veto HV Monitor | 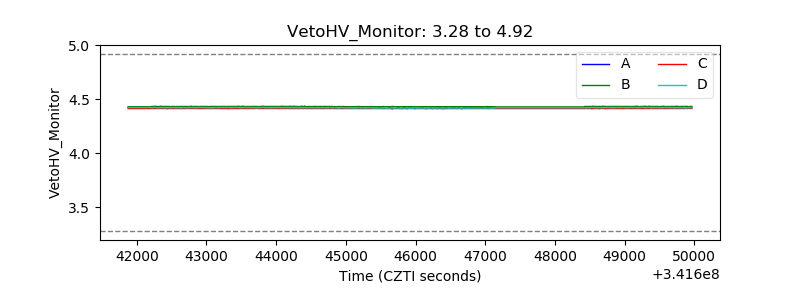 |
| Veto LLD | 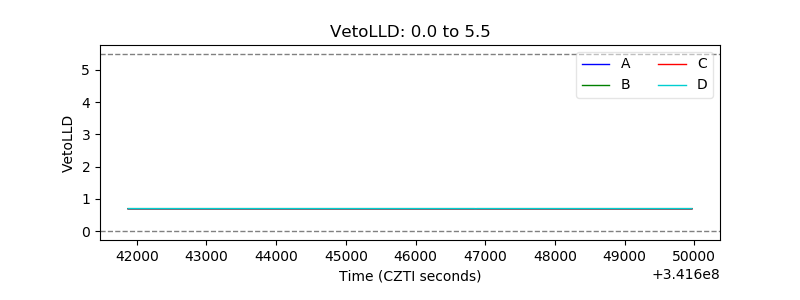 |
| Alpha Counter | 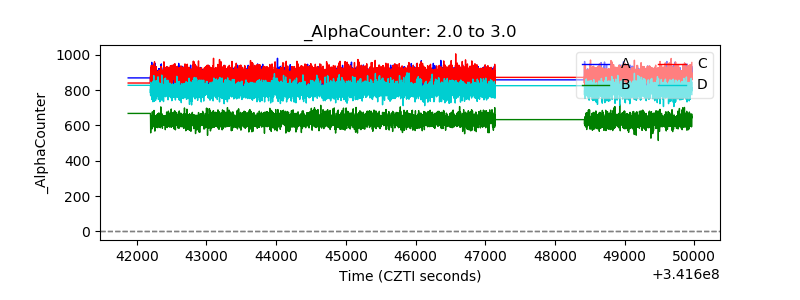 |
| _CPM_Rate | 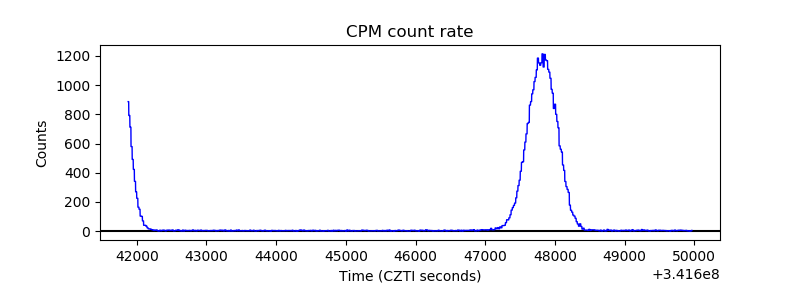 |
| CZT Counter | 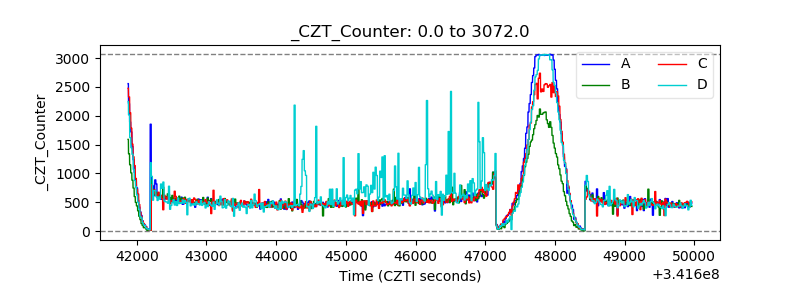 |
| +2.5 Volts monitor |  |
| +5 Volts monitor |  |
| _ROLL_ROT |  |
| _Roll_DEC | 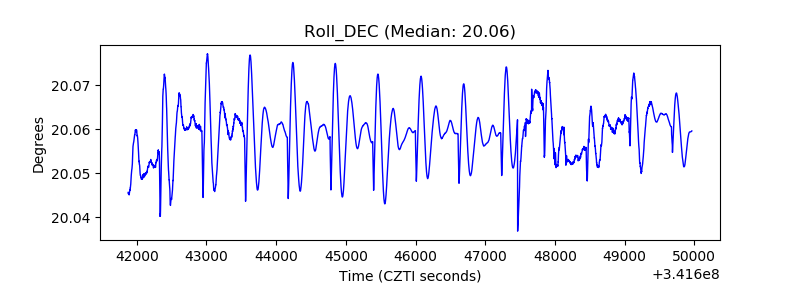 |
| _Roll_RA | 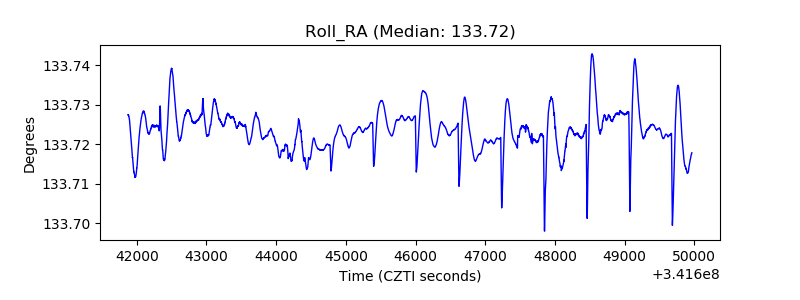 |
| Veto Counter | 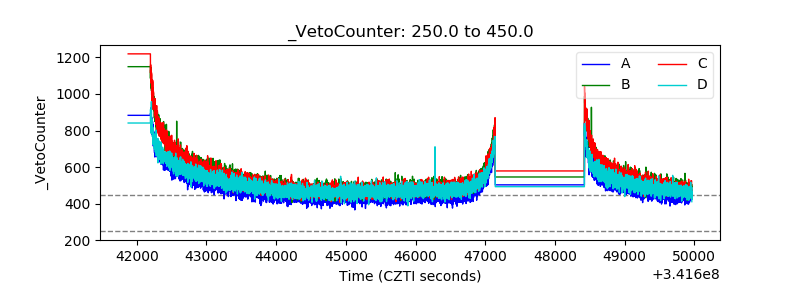 |