| Param | Original file | Final file |
|---|---|---|
| Filename | modeM0/AS1T03_249T01_9000003934_27504cztM0_level2.evt | modeM0/AS1T03_249T01_9000003934_27504cztM0_level2_quad_clean.evt |
| Size (bytes) | 419,256,000 | 81,535,680 |
| Size | 399.8 MB | 77.8 MB |
| Events in quadrant A | 2,966,119 | 523,525 |
| Events in quadrant B | 3,001,179 | 532,338 |
| Events in quadrant C | 2,981,509 | 504,552 |
| Events in quadrant D | 3,343,906 | 493,020 |
| Mode M0 | |||
|---|---|---|---|
| Quadrant | BADHDUFLAG | Total packets | Discarded packets |
| A | 0 | 12345 | 0 |
| B | 0 | 12472 | 0 |
| C | 0 | 12446 | 0 |
| D | 0 | 13737 | 0 |
| Mode M9 | |||
|---|---|---|---|
| Quadrant | BADHDUFLAG | Total packets | Discarded packets |
| A | 0 | 10 | 0 |
| B | 0 | 10 | 0 |
| C | 0 | 10 | 0 |
| D | 0 | 10 | 0 |
| Quadrant | Total seconds | Saturated seconds | Saturation percentage |
|---|---|---|---|
| A | 5945 | 67 | 1.126997% |
| B | 5945 | 71 | 1.194281% |
| C | 5946 | 89 | 1.496805% |
| D | 5945 | 111 | 1.867115% |
Noise dominated data is calculated using 1-second bins in cleaned event files. If a bin has >2000 counts, and if more than 50% of those come from <1% of pixels, then it is considered to be noise-dominated and hence unusable.
| Quadrant | # 1 sec bins | Bins with >0 counts | Bins with >2000 counts | High rate bins dominated by noise | Noise dominated (total time) | Noise dominated (detector-on time) | Marked lightcurve |
|---|---|---|---|---|---|---|---|
| A | 7010 | 5945 | 0 | 0 | 0.00% | 0.00% | 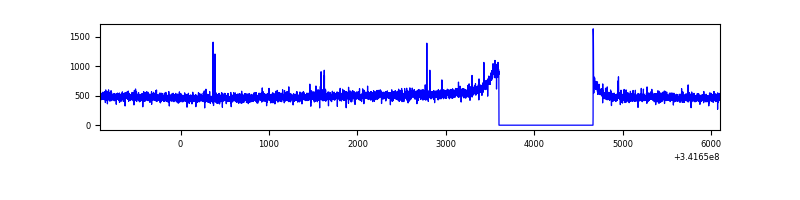 |
| B | 7010 | 5945 | 0 | 0 | 0.00% | 0.00% | 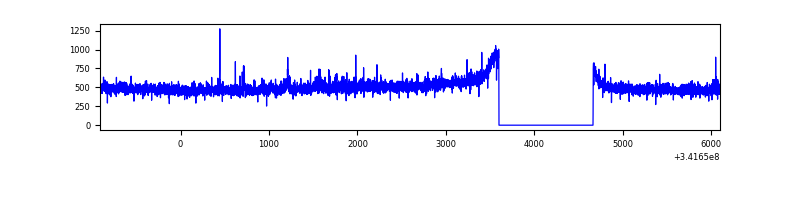 |
| C | 7011 | 5946 | 0 | 0 | 0.00% | 0.00% | 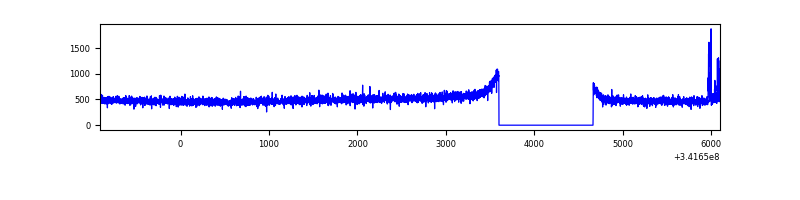 |
| D | 7010 | 5945 | 54 | 54 | 0.77% | 0.91% | 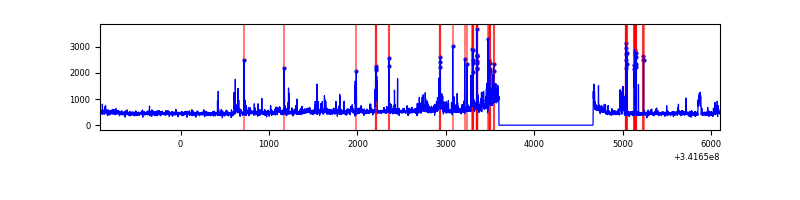 |
Top three noisy pixels from each quadrant. If the there are fewer than three noisy pixels in the level2.evt file, extra rows are filled as -1
| Pixel properties | Quadrant properties | ||||||
|---|---|---|---|---|---|---|---|
| Quadrant | DetID | PixID | Counts | Sigma | Mean | Median | Sigma |
| A | 13 | 254 | 9406 | 56.34 | 766 | 751 | 153.6 |
| A | 3 | 137 | 7115 | 41.43 | 766 | 751 | 153.6 |
| A | 0 | 226 | 6590 | 38.01 | 766 | 751 | 153.6 |
| B | 15 | 32 | 17732 | 117.53 | 755 | 737 | 144.6 |
| B | 12 | 111 | 17581 | 116.49 | 755 | 737 | 144.6 |
| B | 11 | 111 | 16150 | 106.59 | 755 | 737 | 144.6 |
| C | 14 | 238 | 117495 | 684.8 | 727 | 731 | 170.5 |
| C | 10 | 22 | 33098 | 189.83 | 727 | 731 | 170.5 |
| C | 13 | 61 | 5131 | 25.81 | 727 | 731 | 170.5 |
| D | 1 | 52 | 457397 | 2586.54 | 736 | 716 | 176.6 |
| D | 2 | 250 | 66019 | 369.86 | 736 | 716 | 176.6 |
| D | 2 | 234 | 22482 | 123.28 | 736 | 716 | 176.6 |
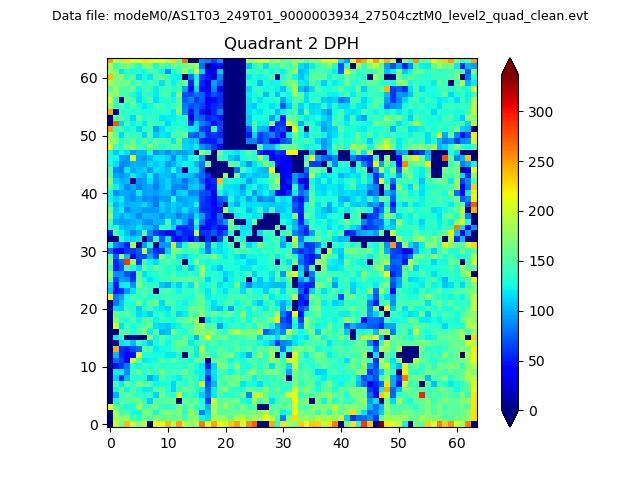
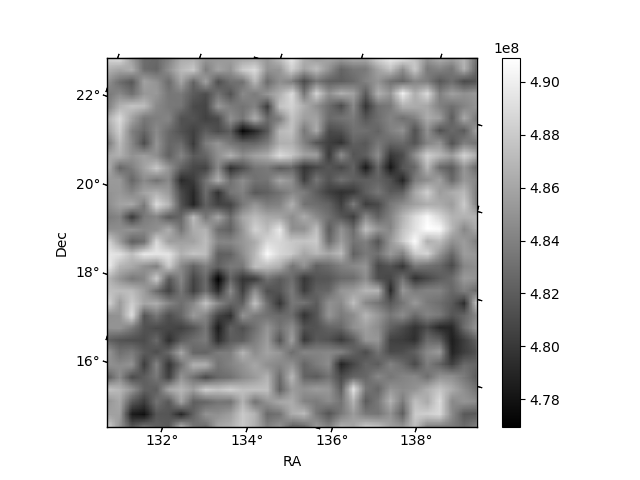
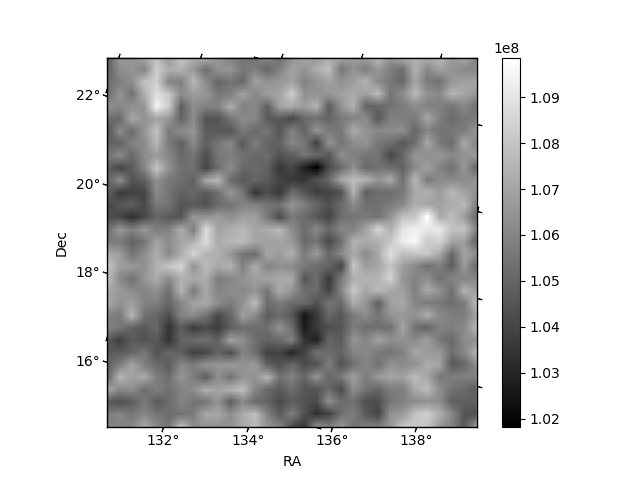
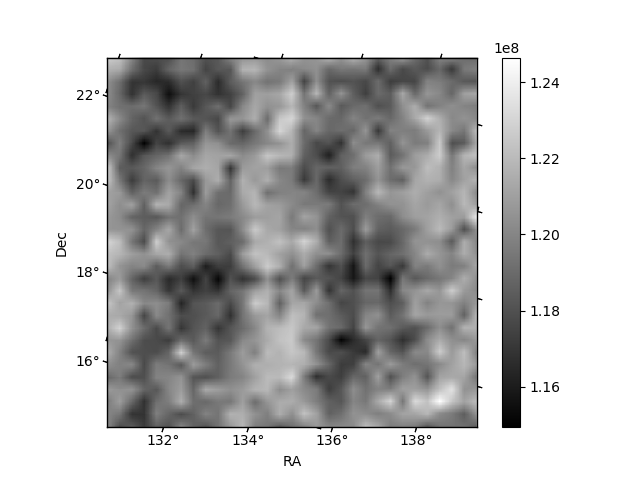
Histogram calculated using DETX and DETY for each event in the final _common_clean file
| Quadrant A | 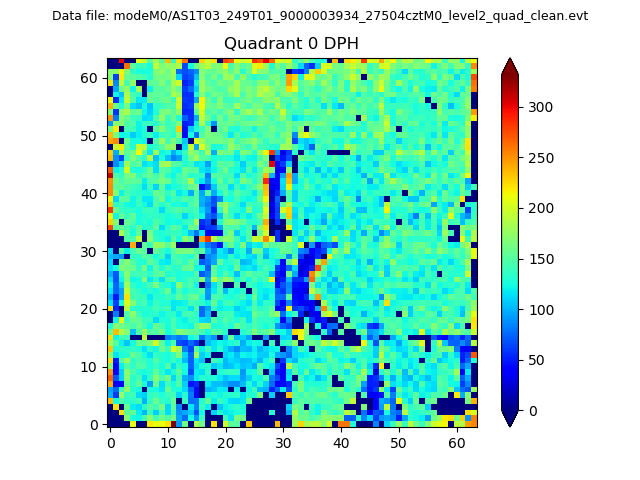 |
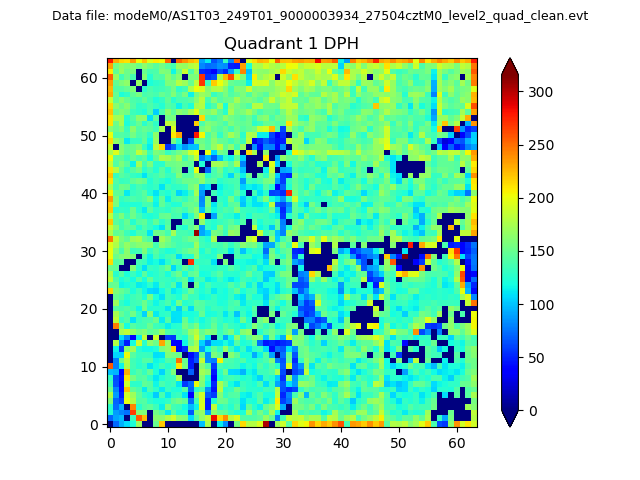 |
Quadrant B |
|---|---|---|---|
| Quadrant D | 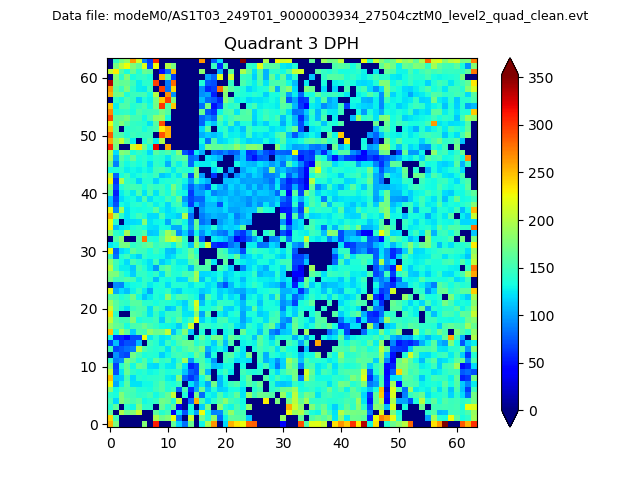 |
 |
Quadrant C |
| Plot type | Count rate plots | Images |
|---|---|---|
| Comparison with Poisson distribution Blue bars denote a histogram of data divided into 1 sec bins. Red curve is a Poisson curve with rate = median count rate of data. |
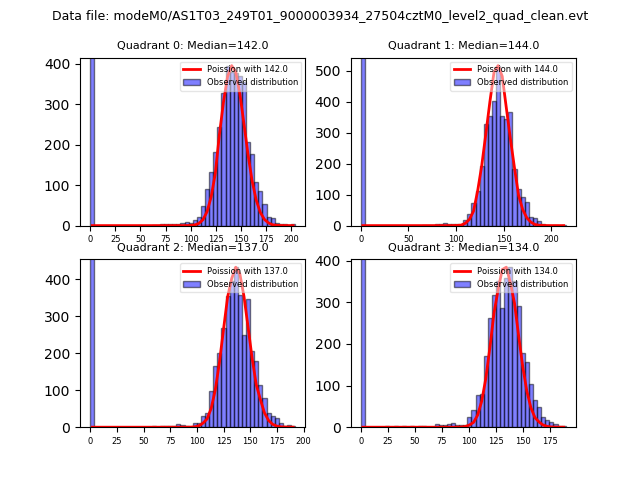 |
 |
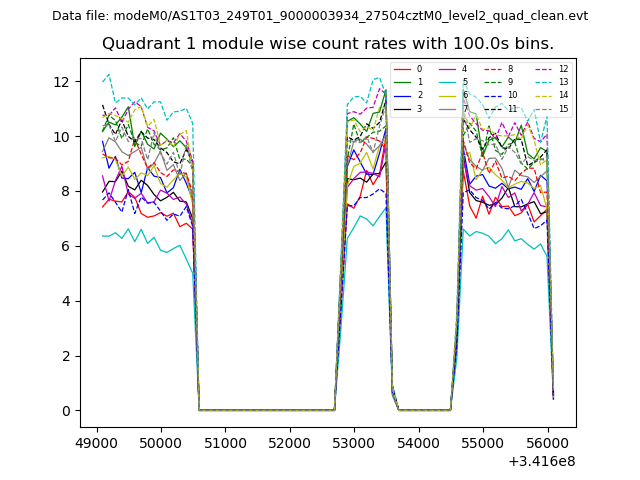
| Quadrant-wise count rates Data is divided into 100 sec bins |
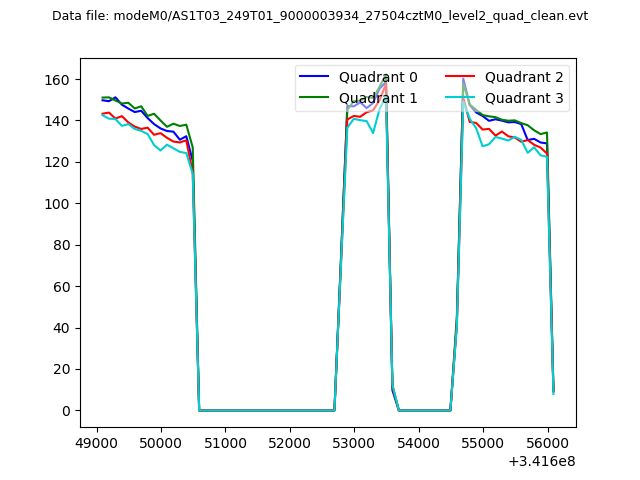 |
|
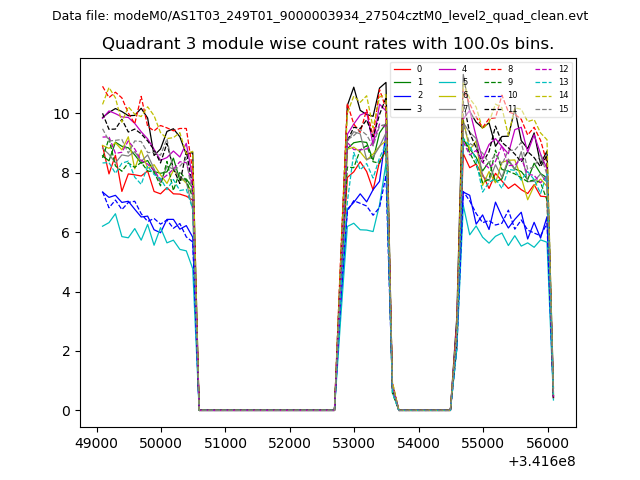
| Module-wise count rates for Quadrant A Data is divided into 100 sec bins |
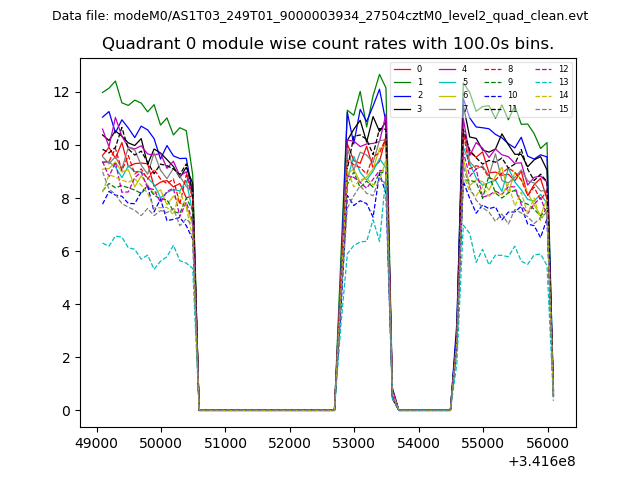 |
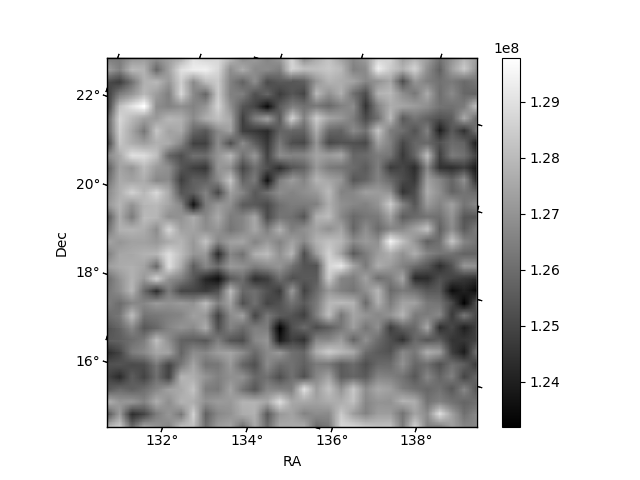 |
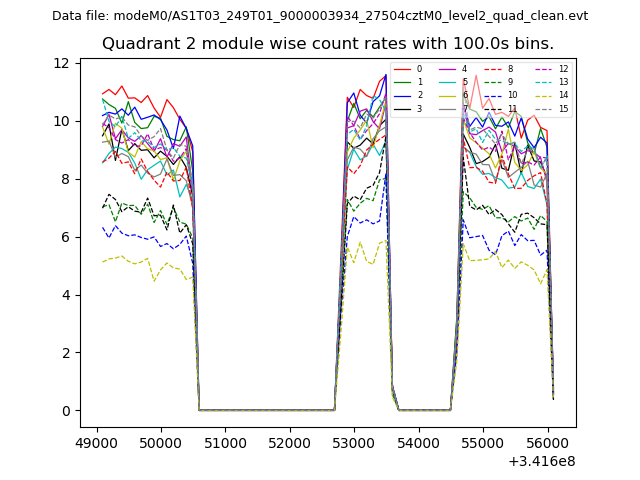
| Module-wise count rates for Quadrant B Data is divided into 100 sec bins |
 |
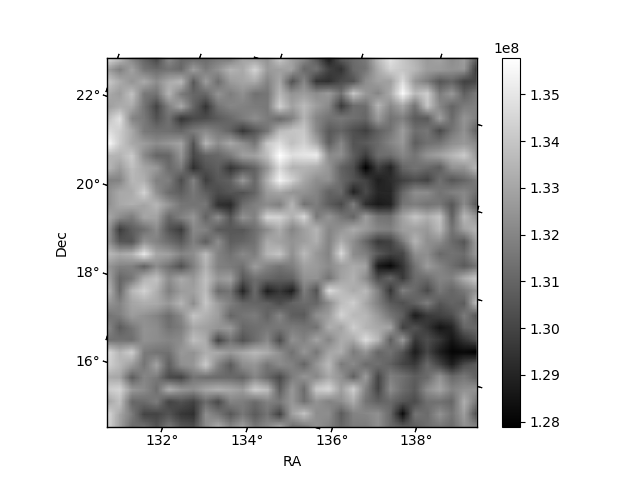 |
| Module-wise count rates for Quadrant C Data is divided into 100 sec bins |
 |
 |
| Module-wise count rates for Quadrant D Data is divided into 100 sec bins |
 |
 |
| Parameter | Plot |
|---|---|
| CZT HV Monitor |  |
| D_VDD | 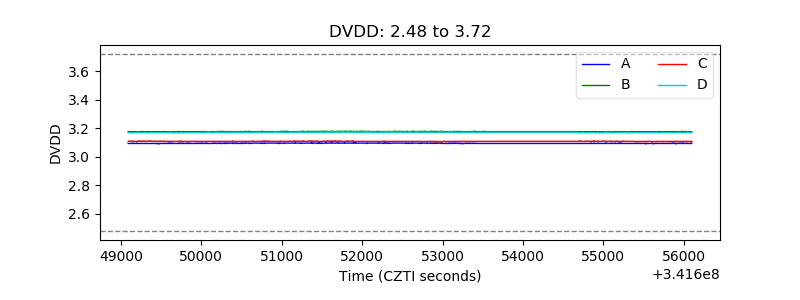 |
| Temperature 1 | 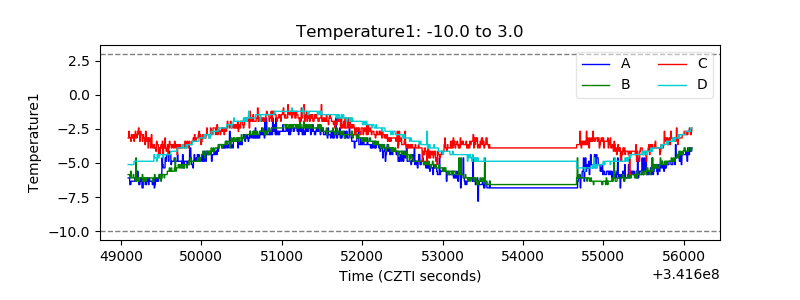 |
| Veto HV Monitor | 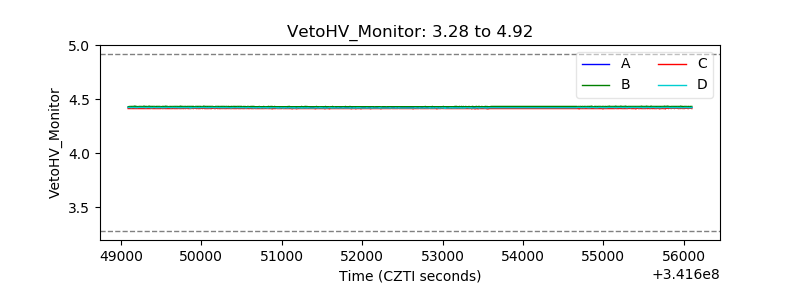 |
| Veto LLD | 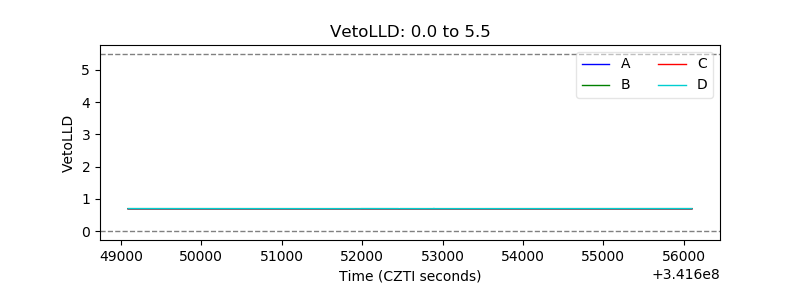 |
| Alpha Counter | 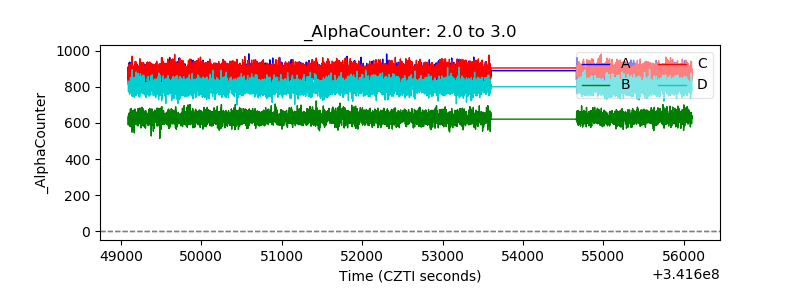 |
| _CPM_Rate | 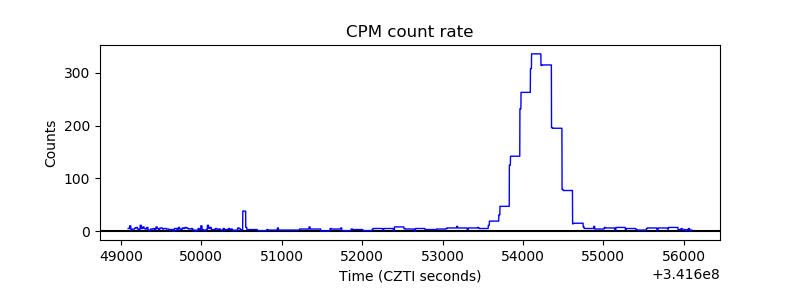 |
| CZT Counter | 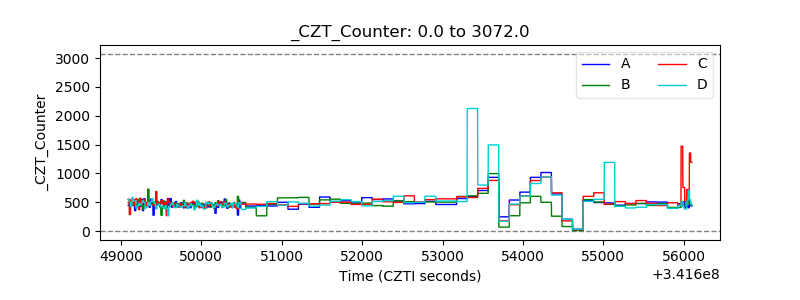 |
| +2.5 Volts monitor |  |
| +5 Volts monitor |  |
| _ROLL_ROT | 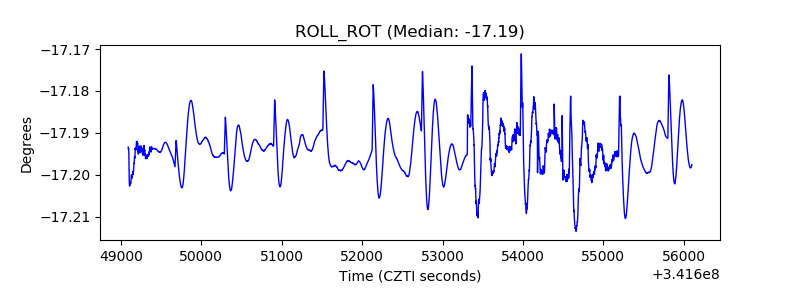 |
| _Roll_DEC | 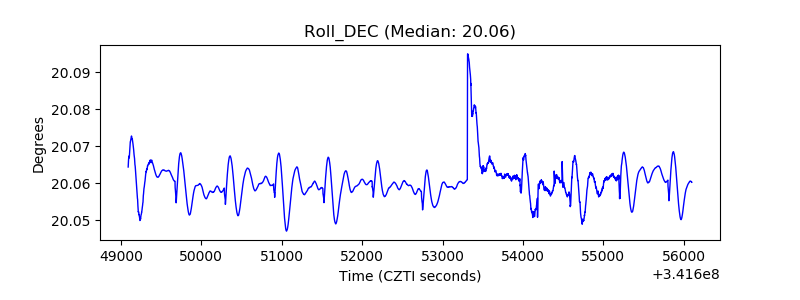 |
| _Roll_RA | 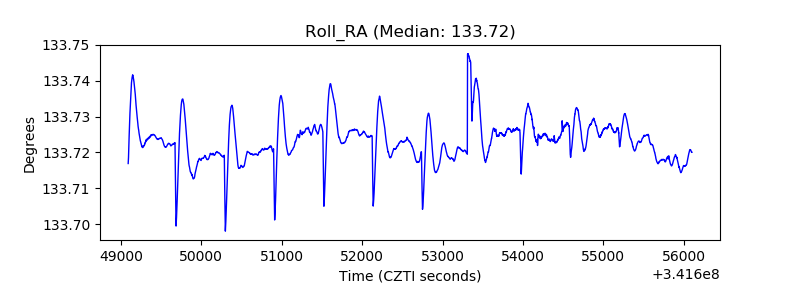 |
| Veto Counter | 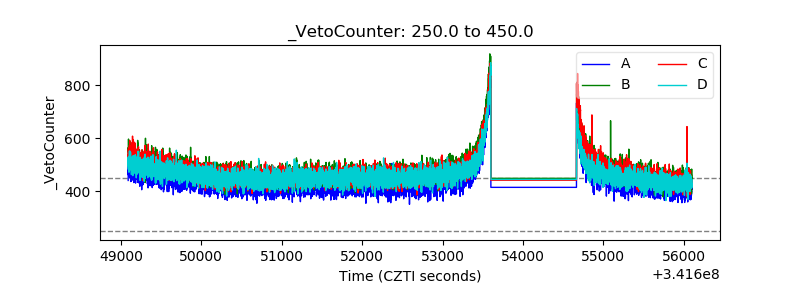 |