| Param | Original file | Final file |
|---|---|---|
| Filename | modeM0/AS1T03_249T01_9000003934_27505cztM0_level2.evt | modeM0/AS1T03_249T01_9000003934_27505cztM0_level2_quad_clean.evt |
| Size (bytes) | 449,902,080 | 84,309,120 |
| Size | 429.1 MB | 80.4 MB |
| Events in quadrant A | 3,067,339 | 538,753 |
| Events in quadrant B | 3,111,737 | 547,816 |
| Events in quadrant C | 3,195,046 | 519,081 |
| Events in quadrant D | 3,822,315 | 506,966 |
| Mode M0 | |||
|---|---|---|---|
| Quadrant | BADHDUFLAG | Total packets | Discarded packets |
| A | 0 | 12955 | 0 |
| B | 0 | 13078 | 0 |
| C | 0 | 13310 | 0 |
| D | 0 | 15425 | 0 |
| Mode M9 | |||
|---|---|---|---|
| Quadrant | BADHDUFLAG | Total packets | Discarded packets |
| A | 0 | 6 | 0 |
| B | 0 | 6 | 0 |
| C | 0 | 6 | 0 |
| D | 0 | 6 | 0 |
| Quadrant | Total seconds | Saturated seconds | Saturation percentage |
|---|---|---|---|
| A | 6306 | 145 | 2.299397% |
| B | 6306 | 147 | 2.331113% |
| C | 6307 | 175 | 2.774695% |
| D | 6307 | 215 | 3.408911% |
Noise dominated data is calculated using 1-second bins in cleaned event files. If a bin has >2000 counts, and if more than 50% of those come from <1% of pixels, then it is considered to be noise-dominated and hence unusable.
| Quadrant | # 1 sec bins | Bins with >0 counts | Bins with >2000 counts | High rate bins dominated by noise | Noise dominated (total time) | Noise dominated (detector-on time) | Marked lightcurve |
|---|---|---|---|---|---|---|---|
| A | 6931 | 6306 | 0 | 0 | 0.00% | 0.00% | 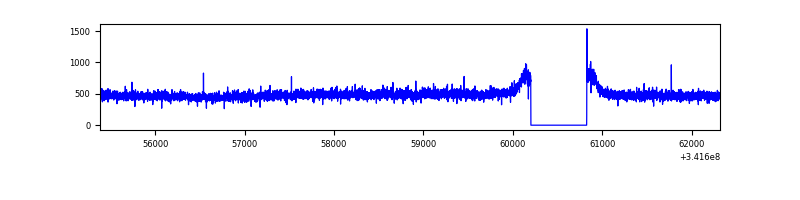 |
| B | 6931 | 6306 | 0 | 0 | 0.00% | 0.00% | 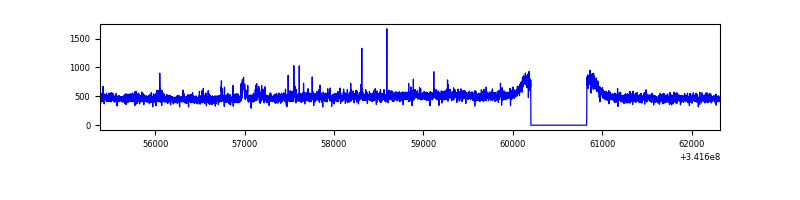 |
| C | 6932 | 6307 | 24 | 24 | 0.35% | 0.38% | 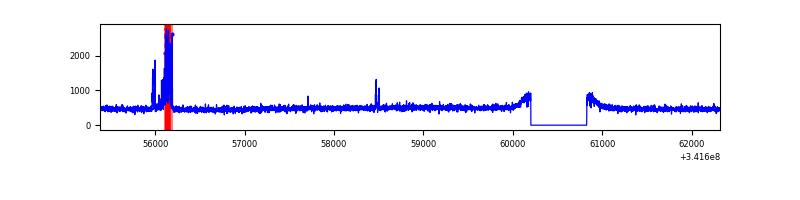 |
| D | 6932 | 6307 | 63 | 63 | 0.91% | 1.00% | 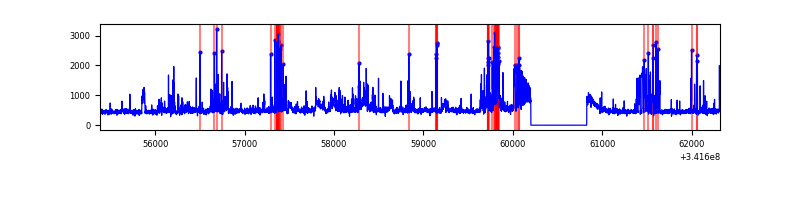 |
Top three noisy pixels from each quadrant. If the there are fewer than three noisy pixels in the level2.evt file, extra rows are filled as -1
| Pixel properties | Quadrant properties | ||||||
|---|---|---|---|---|---|---|---|
| Quadrant | DetID | PixID | Counts | Sigma | Mean | Median | Sigma |
| A | 13 | 254 | 9200 | 52.44 | 794 | 776 | 160.6 |
| A | 3 | 137 | 7508 | 41.91 | 794 | 776 | 160.6 |
| A | 0 | 226 | 6648 | 36.55 | 794 | 776 | 160.6 |
| B | 15 | 32 | 21489 | 136.16 | 783 | 761 | 152.2 |
| B | 12 | 111 | 18759 | 118.23 | 783 | 761 | 152.2 |
| B | 11 | 111 | 16726 | 104.88 | 783 | 761 | 152.2 |
| C | 10 | 22 | 132592 | 740.75 | 755 | 758 | 178.0 |
| C | 14 | 238 | 120230 | 671.29 | 755 | 758 | 178.0 |
| C | 13 | 61 | 5071 | 24.23 | 755 | 758 | 178.0 |
| D | 1 | 52 | 712881 | 3866.53 | 764 | 742 | 184.2 |
| D | 2 | 250 | 166726 | 901.2 | 764 | 742 | 184.2 |
| D | 14 | 35 | 30937 | 163.94 | 764 | 742 | 184.2 |
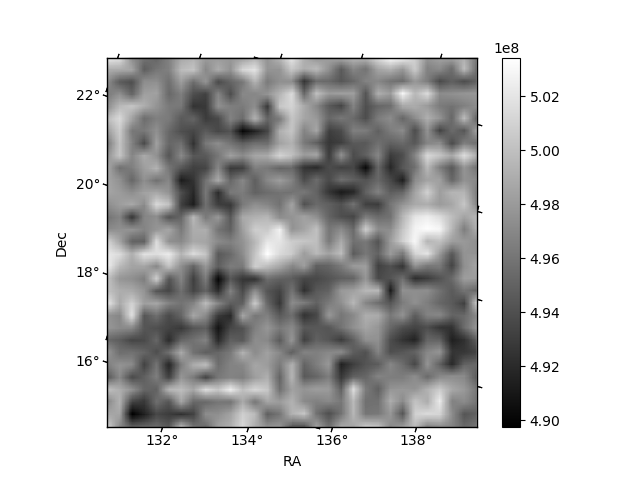
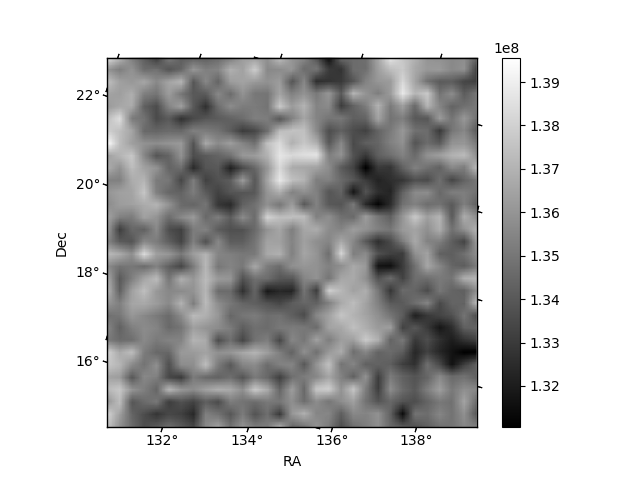
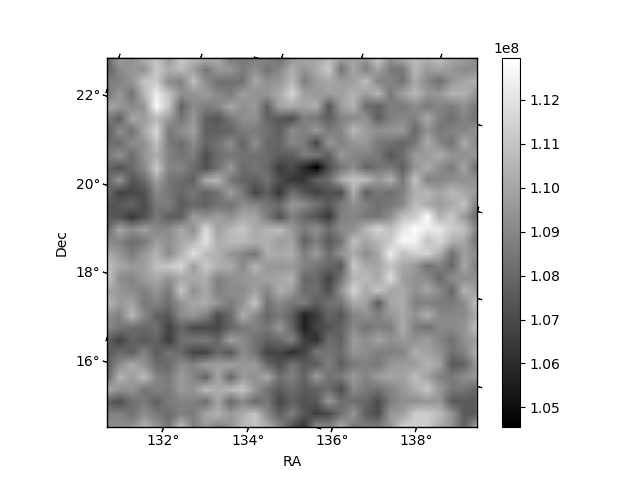
Histogram calculated using DETX and DETY for each event in the final _common_clean file
| Quadrant A | 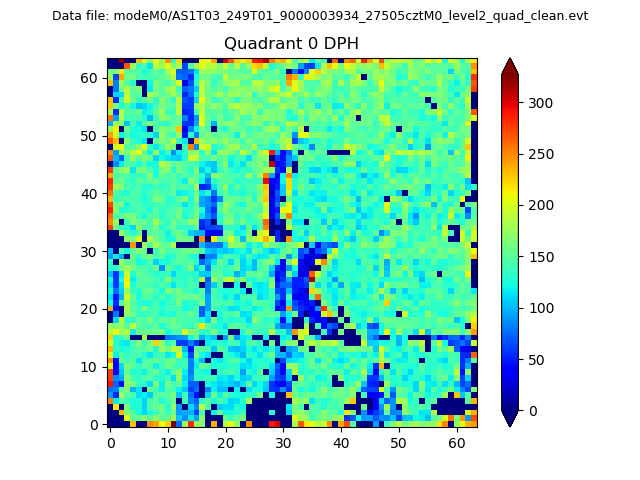 |
 |
Quadrant B |
|---|---|---|---|
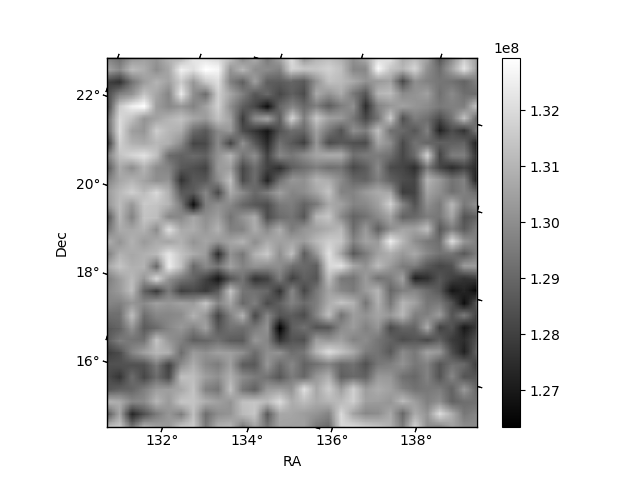
| Quadrant D | 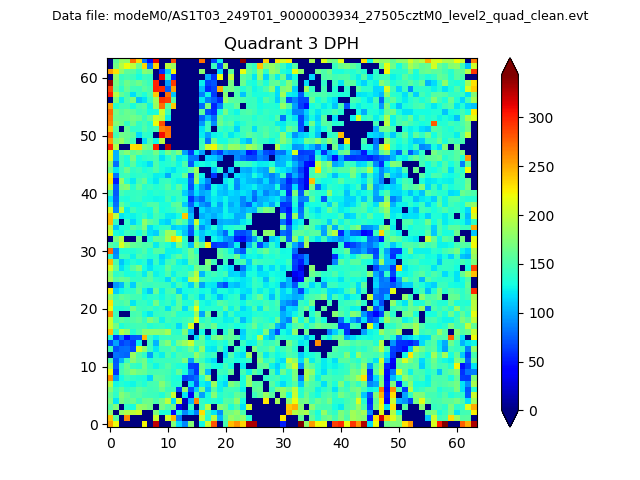 |
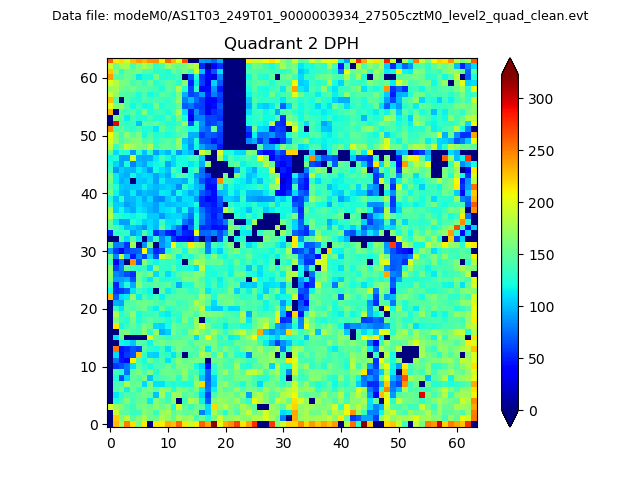 |
Quadrant C |
| Plot type | Count rate plots | Images |
|---|---|---|
| Comparison with Poisson distribution Blue bars denote a histogram of data divided into 1 sec bins. Red curve is a Poisson curve with rate = median count rate of data. |
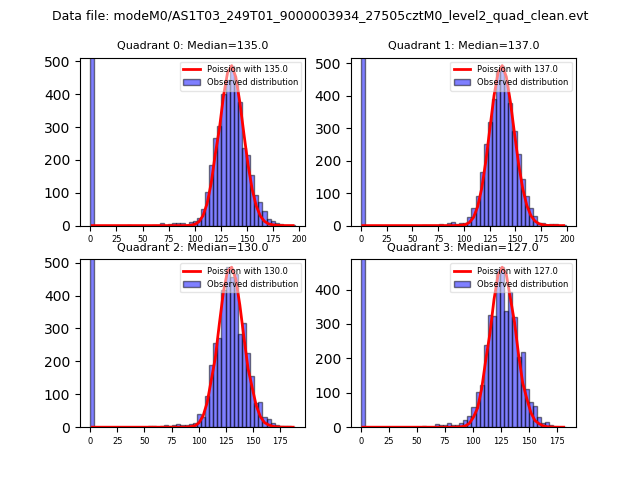 |
 |
| Quadrant-wise count rates Data is divided into 100 sec bins |
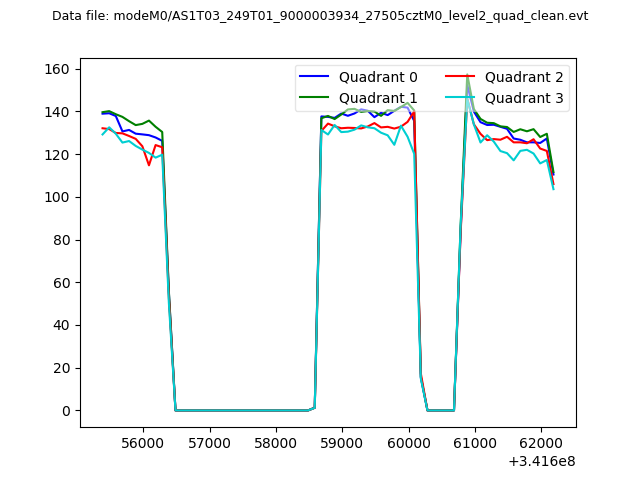 |
|
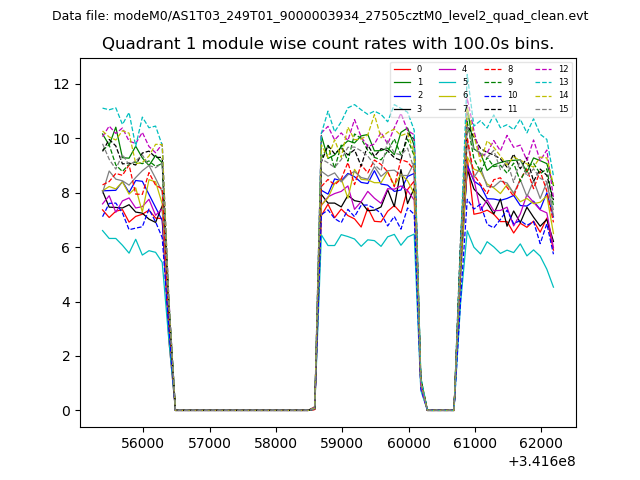
| Module-wise count rates for Quadrant A Data is divided into 100 sec bins |
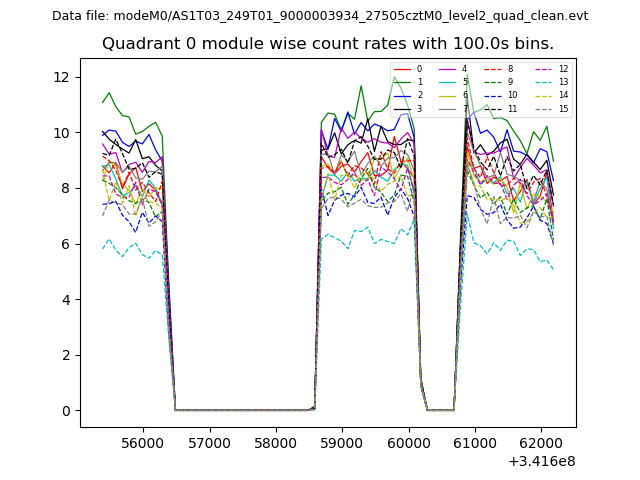 |
 |
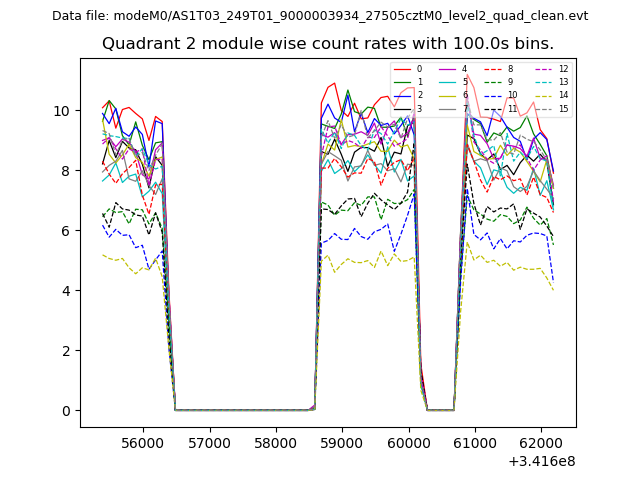
| Module-wise count rates for Quadrant B Data is divided into 100 sec bins |
 |
 |
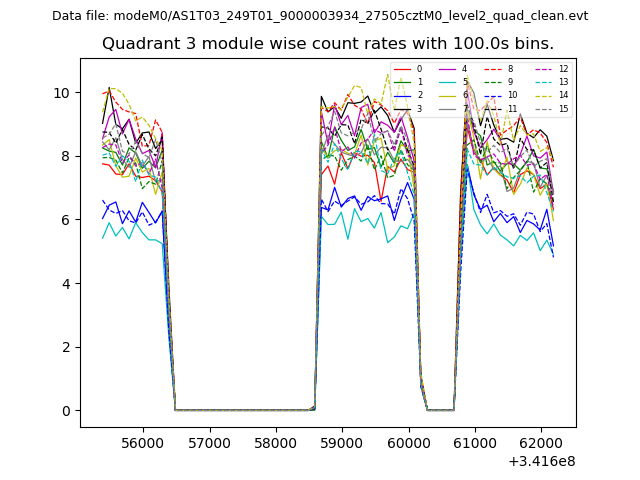
| Module-wise count rates for Quadrant C Data is divided into 100 sec bins |
 |
 |
| Module-wise count rates for Quadrant D Data is divided into 100 sec bins |
 |
 |
| Parameter | Plot |
|---|---|
| CZT HV Monitor | 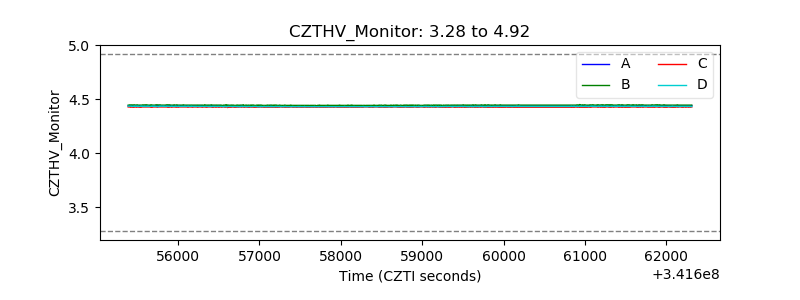 |
| D_VDD | 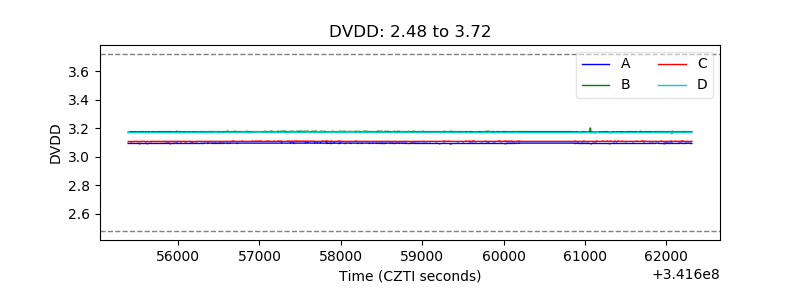 |
| Temperature 1 | 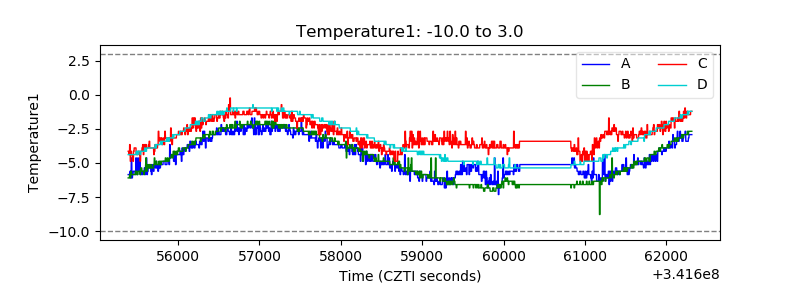 |
| Veto HV Monitor |  |
| Veto LLD | 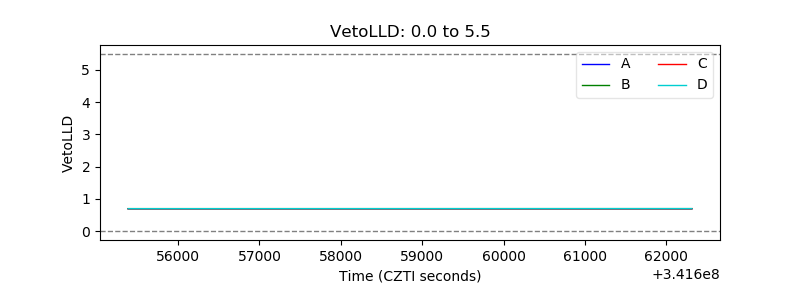 |
| Alpha Counter | 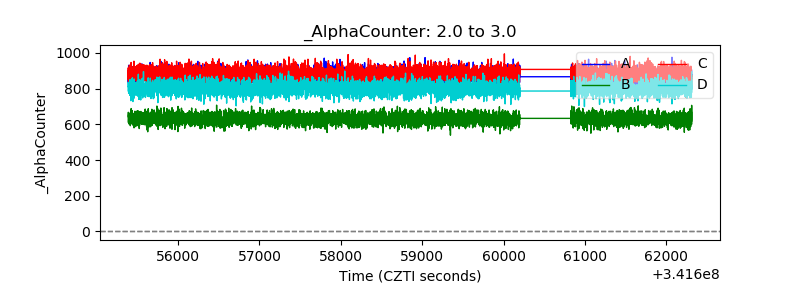 |
| _CPM_Rate | 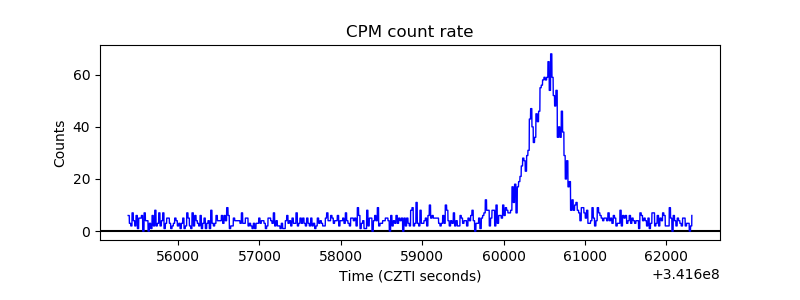 |
| CZT Counter | 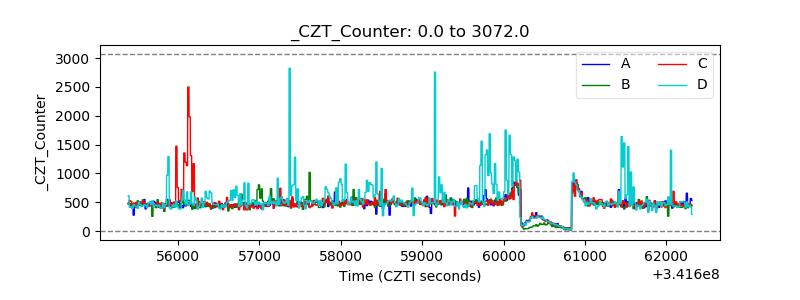 |
| +2.5 Volts monitor |  |
| +5 Volts monitor |  |
| _ROLL_ROT | 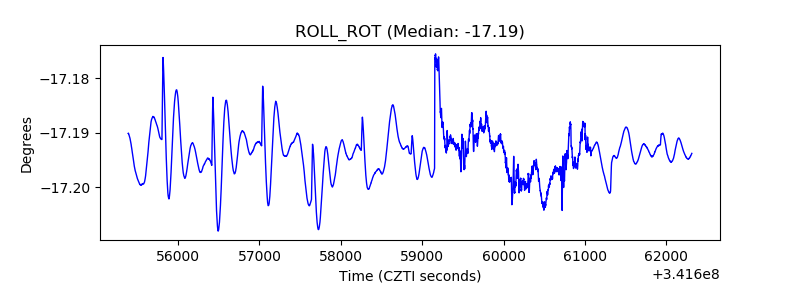 |
| _Roll_DEC | 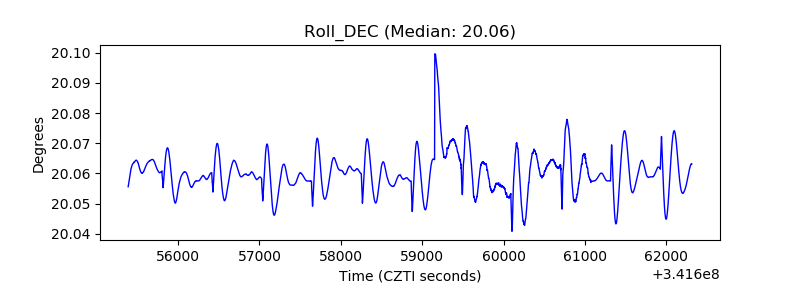 |
| _Roll_RA | 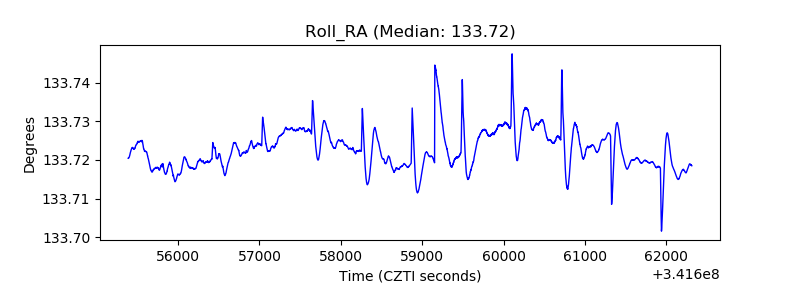 |
| Veto Counter | 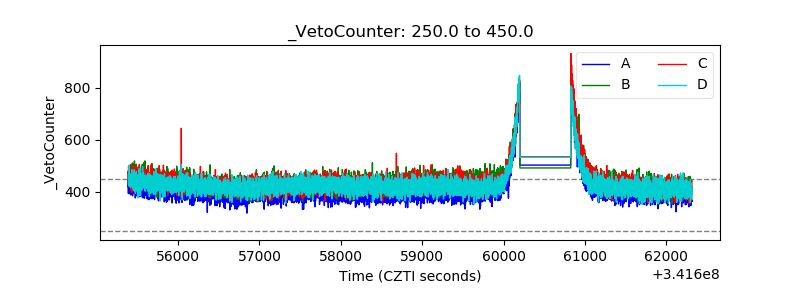 |