| Param | Original file | Final file |
|---|---|---|
| Filename | modeM0/AS1T03_249T01_9000003934_27506cztM0_level2.evt | modeM0/AS1T03_249T01_9000003934_27506cztM0_level2_quad_clean.evt |
| Size (bytes) | 467,691,840 | 82,915,200 |
| Size | 446.0 MB | 79.1 MB |
| Events in quadrant A | 3,177,768 | 521,786 |
| Events in quadrant B | 3,235,441 | 527,517 |
| Events in quadrant C | 3,203,664 | 502,591 |
| Events in quadrant D | 4,098,068 | 498,252 |
| Mode M0 | |||
|---|---|---|---|
| Quadrant | BADHDUFLAG | Total packets | Discarded packets |
| A | 0 | 13582 | 0 |
| B | 0 | 13673 | 0 |
| C | 0 | 13616 | 0 |
| D | 0 | 16428 | 0 |
| Mode M9 | |||
|---|---|---|---|
| Quadrant | BADHDUFLAG | Total packets | Discarded packets |
| A | 0 | 3 | 0 |
| B | 0 | 3 | 0 |
| C | 0 | 3 | 0 |
| D | 0 | 3 | 0 |
| Quadrant | Total seconds | Saturated seconds | Saturation percentage |
|---|---|---|---|
| A | 6606 | 118 | 1.786255% |
| B | 6607 | 128 | 1.937339% |
| C | 6607 | 146 | 2.209778% |
| D | 6607 | 227 | 3.435750% |
Noise dominated data is calculated using 1-second bins in cleaned event files. If a bin has >2000 counts, and if more than 50% of those come from <1% of pixels, then it is considered to be noise-dominated and hence unusable.
| Quadrant | # 1 sec bins | Bins with >0 counts | Bins with >2000 counts | High rate bins dominated by noise | Noise dominated (total time) | Noise dominated (detector-on time) | Marked lightcurve |
|---|---|---|---|---|---|---|---|
| A | 6886 | 6607 | 0 | 0 | 0.00% | 0.00% | 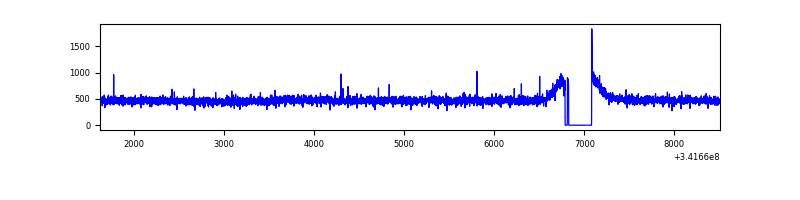 |
| B | 6887 | 6607 | 3 | 3 | 0.04% | 0.05% | 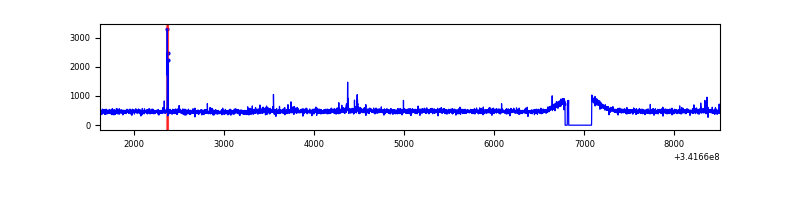 |
| C | 6887 | 6607 | 1 | 1 | 0.01% | 0.02% | 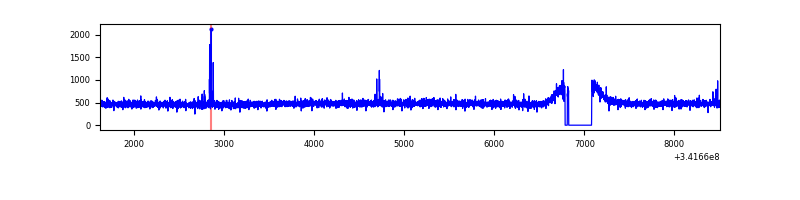 |
| D | 6887 | 6607 | 136 | 136 | 1.97% | 2.06% | 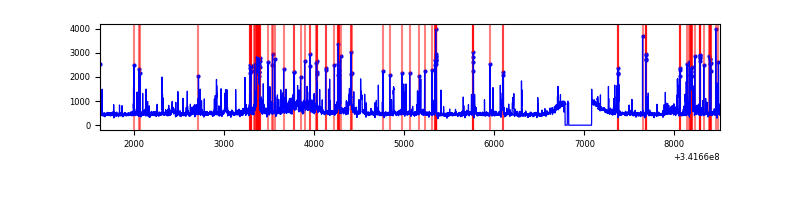 |
Top three noisy pixels from each quadrant. If the there are fewer than three noisy pixels in the level2.evt file, extra rows are filled as -1
| Pixel properties | Quadrant properties | ||||||
|---|---|---|---|---|---|---|---|
| Quadrant | DetID | PixID | Counts | Sigma | Mean | Median | Sigma |
| A | 13 | 254 | 11064 | 61.3 | 821 | 803 | 167.4 |
| A | 3 | 137 | 7868 | 42.21 | 821 | 803 | 167.4 |
| A | 0 | 226 | 6995 | 36.99 | 821 | 803 | 167.4 |
| B | 0 | 230 | 27296 | 168.01 | 810 | 787 | 157.8 |
| B | 12 | 111 | 19787 | 120.42 | 810 | 787 | 157.8 |
| B | 11 | 111 | 17654 | 106.9 | 810 | 787 | 157.8 |
| C | 14 | 238 | 124203 | 666.7 | 783 | 786 | 185.1 |
| C | 0 | 207 | 11107 | 55.75 | 783 | 786 | 185.1 |
| C | 2 | 16 | 8703 | 42.77 | 783 | 786 | 185.1 |
| D | 1 | 52 | 883182 | 4653.93 | 790 | 769 | 189.6 |
| D | 2 | 250 | 68848 | 359.05 | 790 | 769 | 189.6 |
| D | 14 | 35 | 56202 | 292.36 | 790 | 769 | 189.6 |
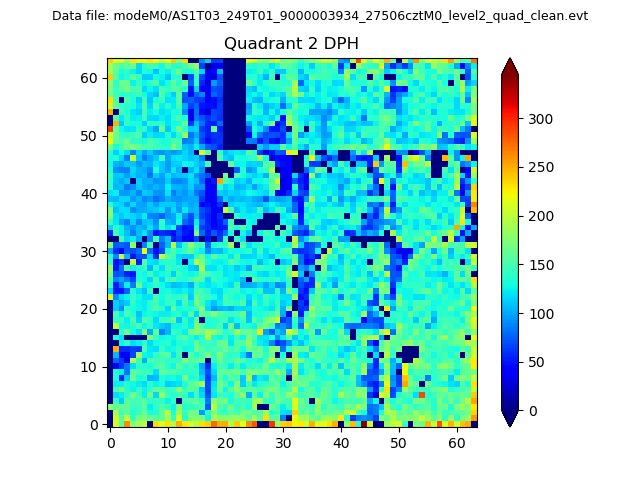
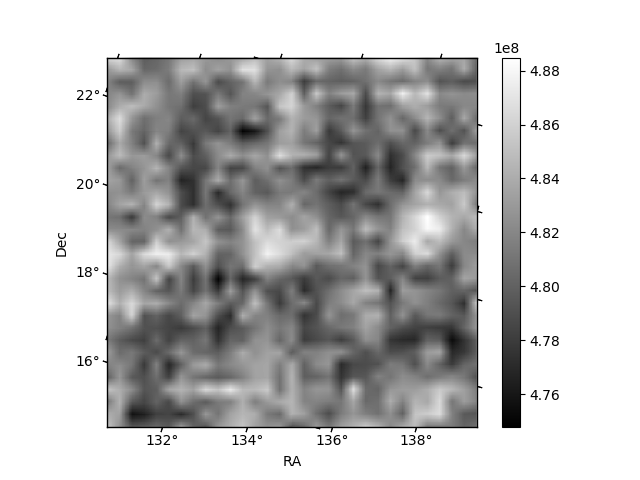
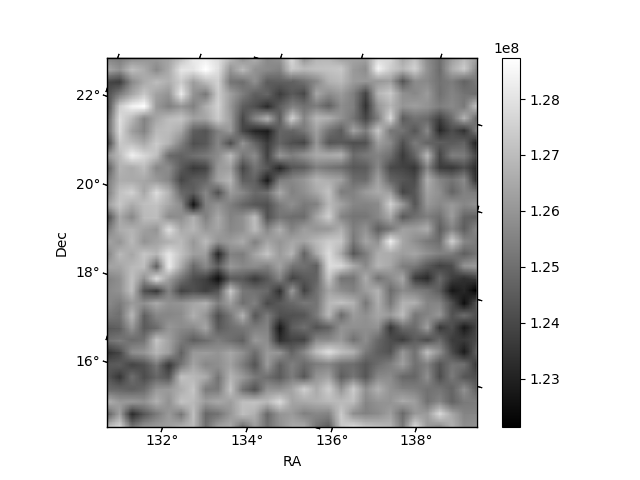
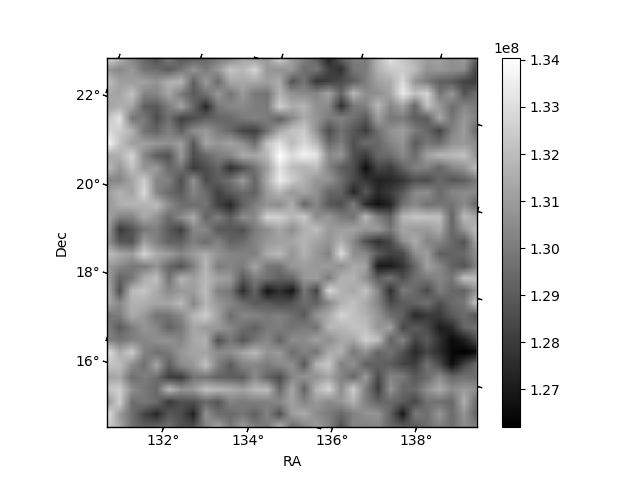
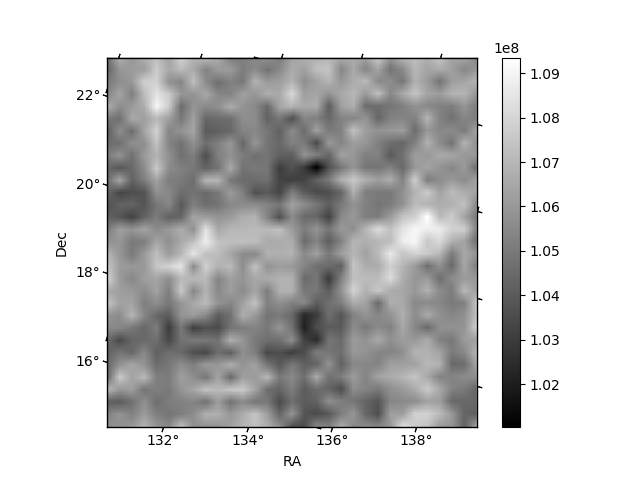
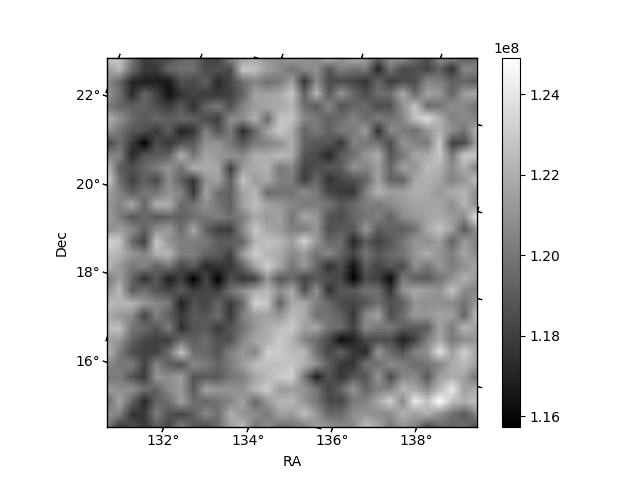
Histogram calculated using DETX and DETY for each event in the final _common_clean file
| Quadrant A | 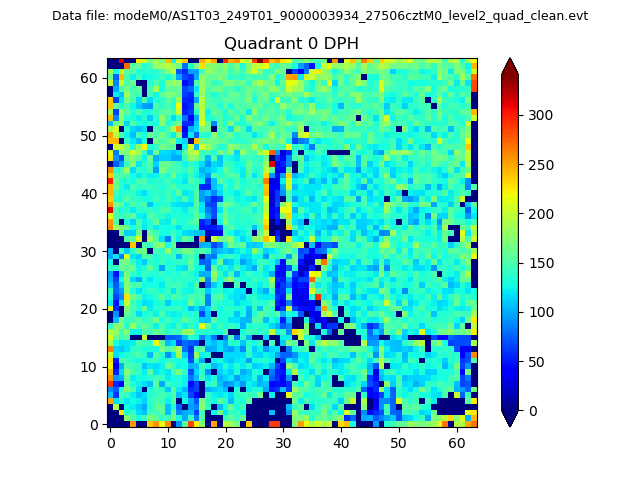 |
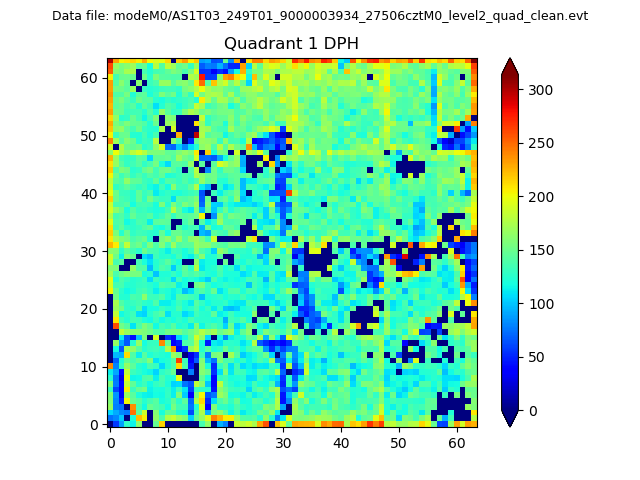 |
Quadrant B |
|---|---|---|---|
| Quadrant D | 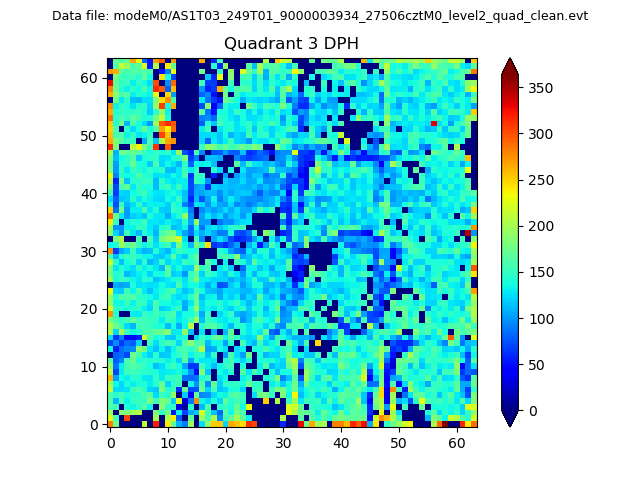 |
 |
Quadrant C |
| Plot type | Count rate plots | Images |
|---|---|---|
| Comparison with Poisson distribution Blue bars denote a histogram of data divided into 1 sec bins. Red curve is a Poisson curve with rate = median count rate of data. |
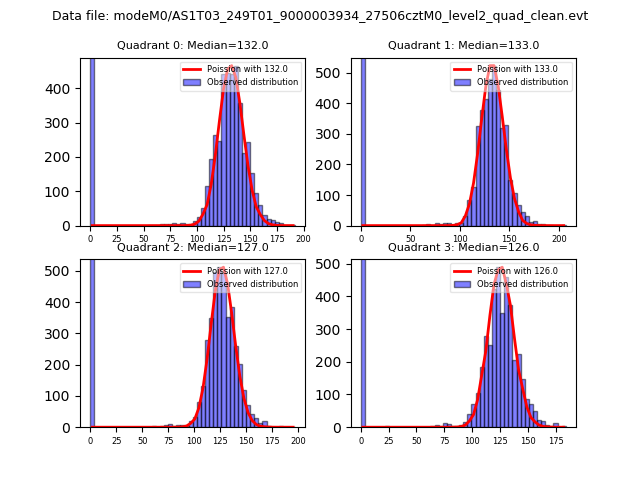 |
 |
| Quadrant-wise count rates Data is divided into 100 sec bins |
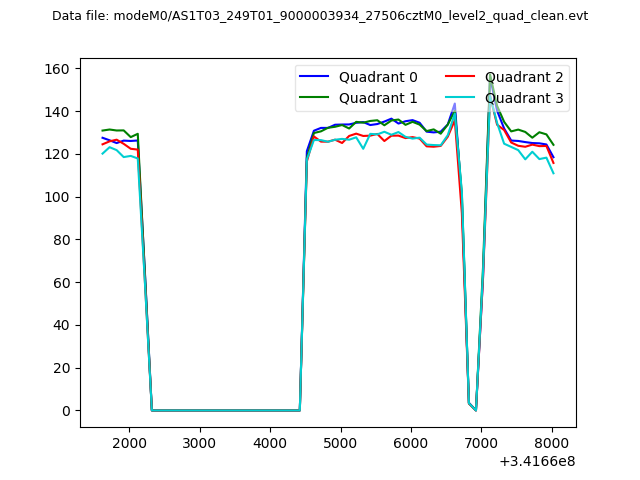 |
|
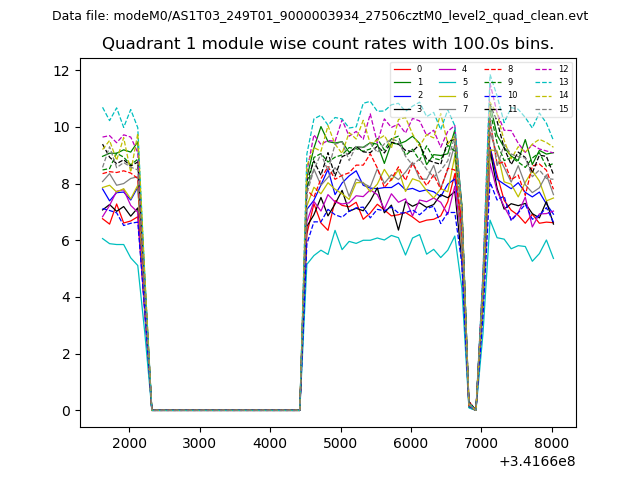
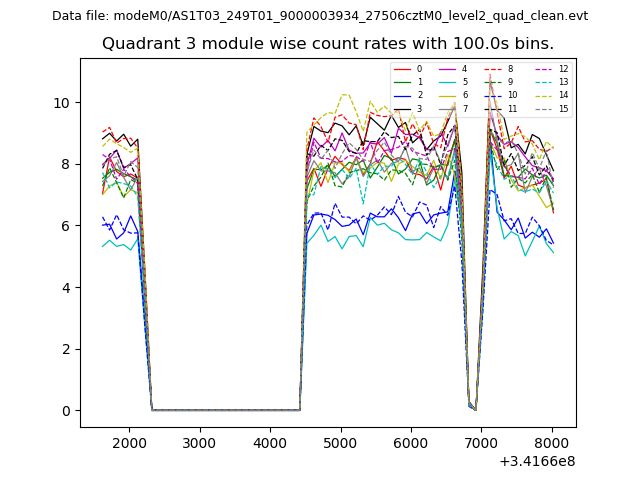
| Module-wise count rates for Quadrant A Data is divided into 100 sec bins |
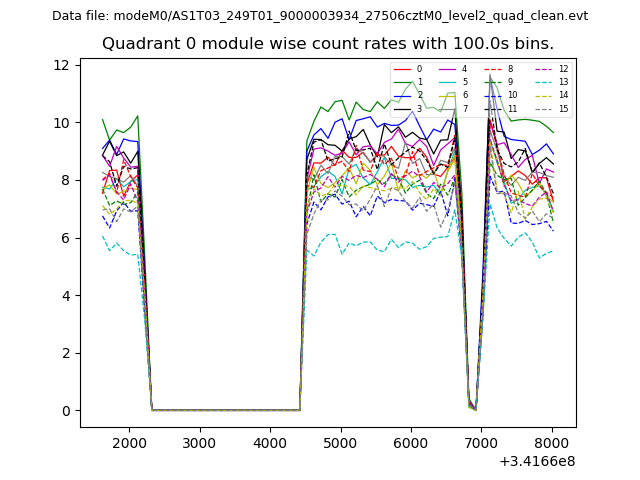 |
 |
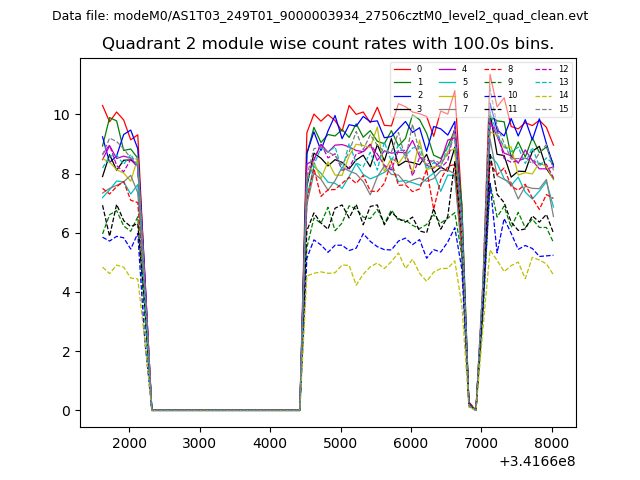
| Module-wise count rates for Quadrant B Data is divided into 100 sec bins |
 |
 |
| Module-wise count rates for Quadrant C Data is divided into 100 sec bins |
 |
 |
| Module-wise count rates for Quadrant D Data is divided into 100 sec bins |
 |
 |
| Parameter | Plot |
|---|---|
| CZT HV Monitor | 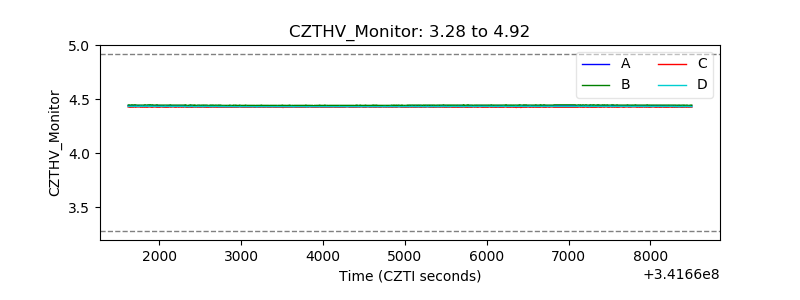 |
| D_VDD | 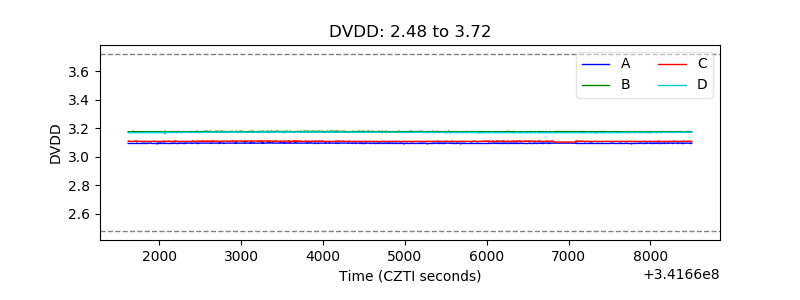 |
| Temperature 1 | 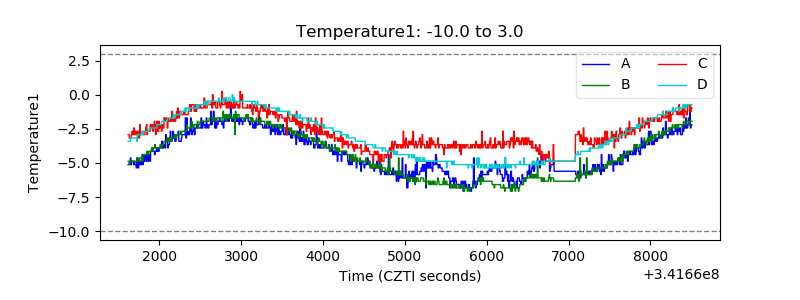 |
| Veto HV Monitor | 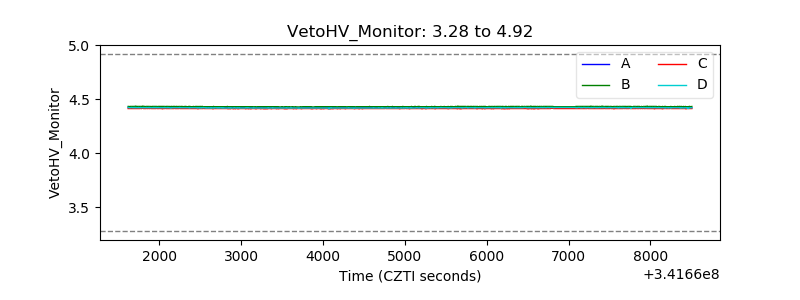 |
| Veto LLD | 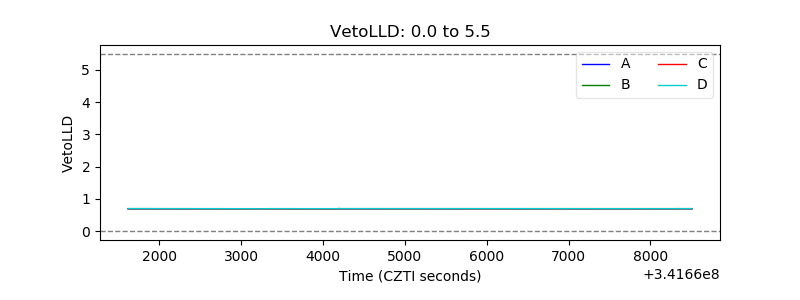 |
| Alpha Counter | 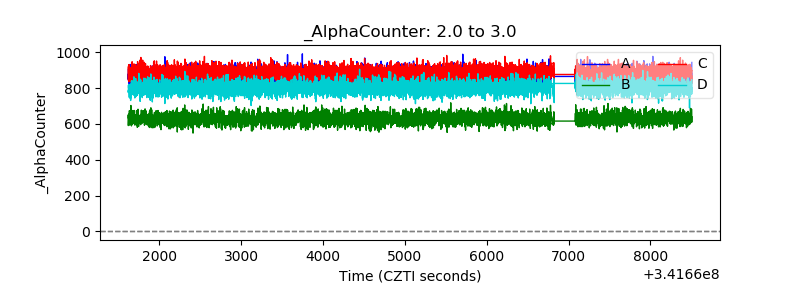 |
| _CPM_Rate | 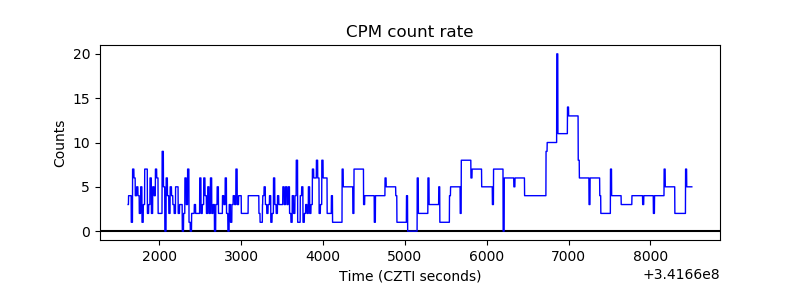 |
| CZT Counter | 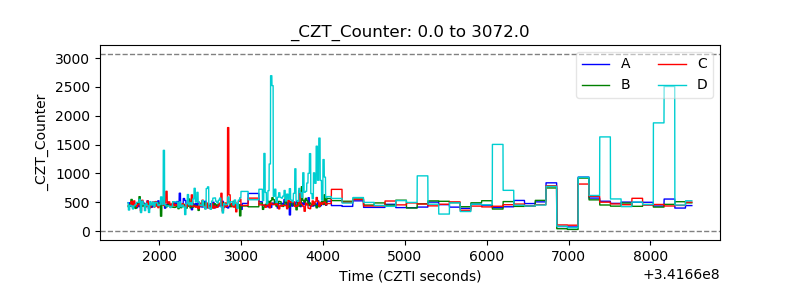 |
| +2.5 Volts monitor |  |
| +5 Volts monitor |  |
| _ROLL_ROT |  |
| _Roll_DEC | 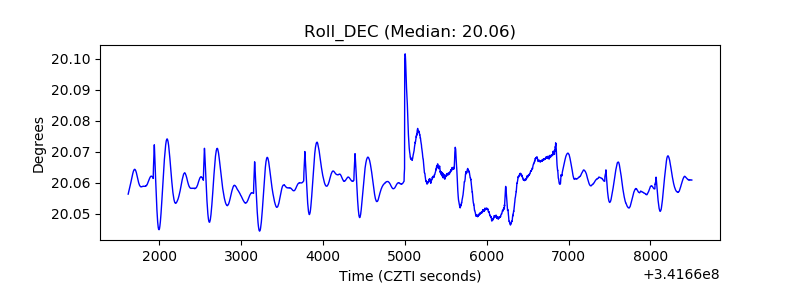 |
| _Roll_RA | 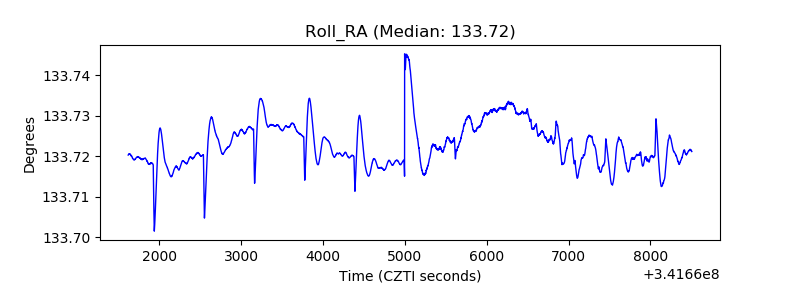 |
| Veto Counter | 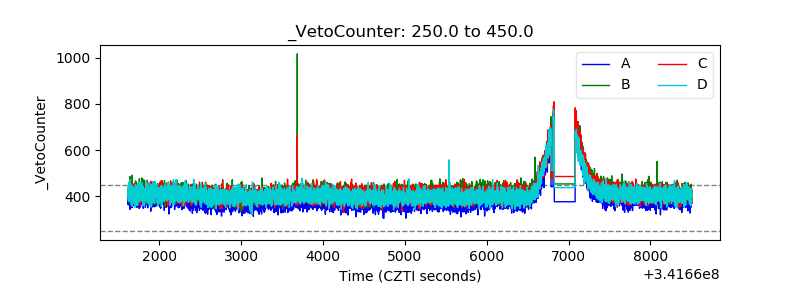 |