| Param | Original file | Final file |
|---|---|---|
| Filename | modeM0/AS1T03_249T01_9000003934_27507cztM0_level2.evt | modeM0/AS1T03_249T01_9000003934_27507cztM0_level2_quad_clean.evt |
| Size (bytes) | 584,337,600 | 94,582,080 |
| Size | 557.3 MB | 90.2 MB |
| Events in quadrant A | 3,831,447 | 593,961 |
| Events in quadrant B | 3,892,014 | 600,479 |
| Events in quadrant C | 3,846,042 | 572,121 |
| Events in quadrant D | 5,597,753 | 554,599 |
| Mode M0 | |||
|---|---|---|---|
| Quadrant | BADHDUFLAG | Total packets | Discarded packets |
| A | 0 | 16315 | 0 |
| B | 0 | 16362 | 0 |
| C | 0 | 16355 | 0 |
| D | 0 | 21698 | 0 |
| Mode M9 | |||
|---|---|---|---|
| Quadrant | BADHDUFLAG | Total packets | Discarded packets |
| A | 0 | 2 | 0 |
| B | 0 | 3 | 0 |
| C | 0 | 3 | 0 |
| D | 0 | 3 | 0 |
| Quadrant | Total seconds | Saturated seconds | Saturation percentage |
|---|---|---|---|
| A | 7805 | 213 | 2.729020% |
| B | 7805 | 263 | 3.369635% |
| C | 7805 | 283 | 3.625881% |
| D | 7805 | 511 | 6.547085% |
Noise dominated data is calculated using 1-second bins in cleaned event files. If a bin has >2000 counts, and if more than 50% of those come from <1% of pixels, then it is considered to be noise-dominated and hence unusable.
| Quadrant | # 1 sec bins | Bins with >0 counts | Bins with >2000 counts | High rate bins dominated by noise | Noise dominated (total time) | Noise dominated (detector-on time) | Marked lightcurve |
|---|---|---|---|---|---|---|---|
| A | 7905 | 7805 | 0 | 0 | 0.00% | 0.00% | 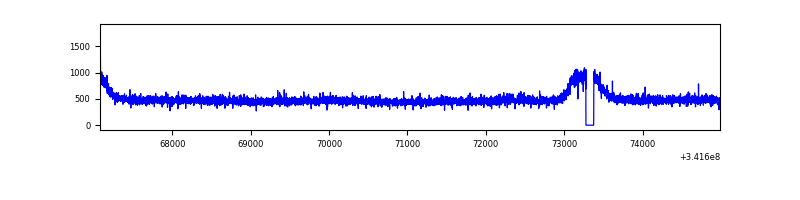 |
| B | 7905 | 7805 | 0 | 0 | 0.00% | 0.00% | 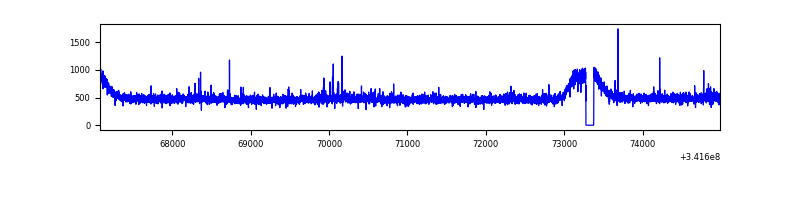 |
| C | 7905 | 7805 | 0 | 0 | 0.00% | 0.00% | 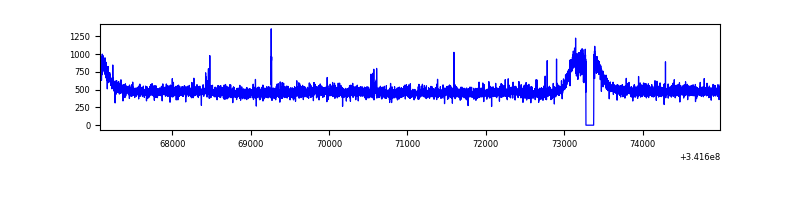 |
| D | 7905 | 7805 | 293 | 293 | 3.71% | 3.75% | 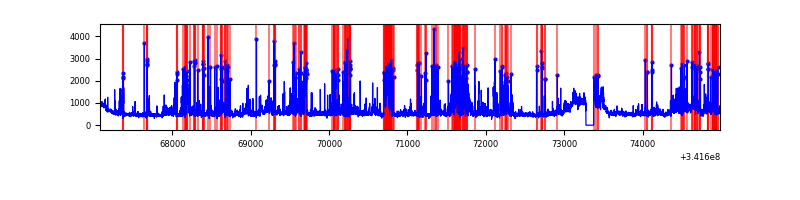 |
Top three noisy pixels from each quadrant. If the there are fewer than three noisy pixels in the level2.evt file, extra rows are filled as -1
| Pixel properties | Quadrant properties | ||||||
|---|---|---|---|---|---|---|---|
| Quadrant | DetID | PixID | Counts | Sigma | Mean | Median | Sigma |
| A | 13 | 254 | 13462 | 62.3 | 991 | 968 | 200.6 |
| A | 3 | 137 | 9836 | 44.22 | 991 | 968 | 200.6 |
| A | 0 | 226 | 8346 | 36.79 | 991 | 968 | 200.6 |
| B | 0 | 230 | 32820 | 166.25 | 978 | 950 | 191.7 |
| B | 12 | 111 | 23966 | 120.07 | 978 | 950 | 191.7 |
| B | 11 | 111 | 21520 | 107.31 | 978 | 950 | 191.7 |
| C | 14 | 238 | 149024 | 661.35 | 944 | 950 | 223.9 |
| C | 2 | 16 | 14910 | 62.35 | 944 | 950 | 223.9 |
| C | 13 | 61 | 6311 | 23.94 | 944 | 950 | 223.9 |
| D | 1 | 52 | 1421634 | 6253.72 | 943 | 918 | 227.2 |
| D | 2 | 250 | 371777 | 1632.45 | 943 | 918 | 227.2 |
| D | 14 | 35 | 154027 | 673.96 | 943 | 918 | 227.2 |
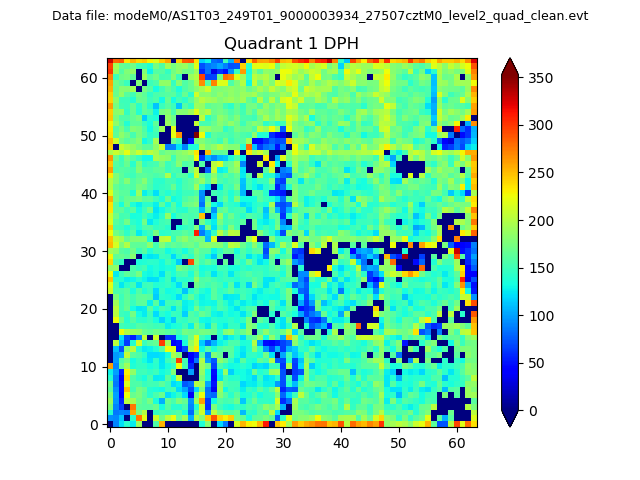
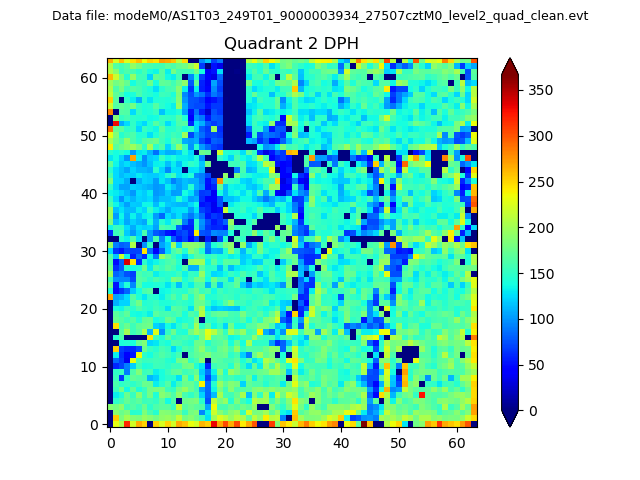
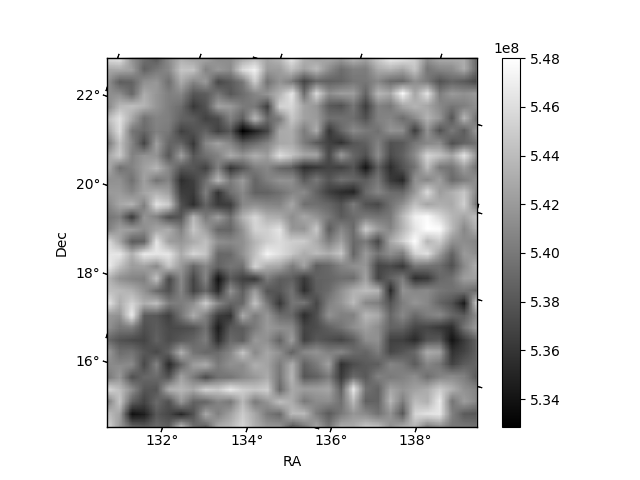
Histogram calculated using DETX and DETY for each event in the final _common_clean file
| Quadrant A |  |
 |
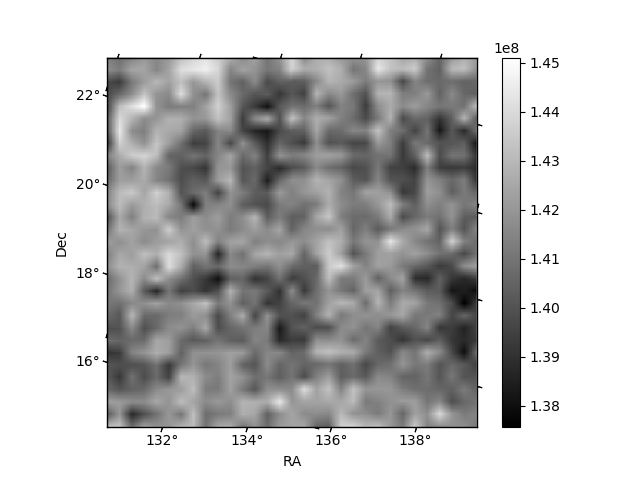
Quadrant B |
|---|---|---|---|
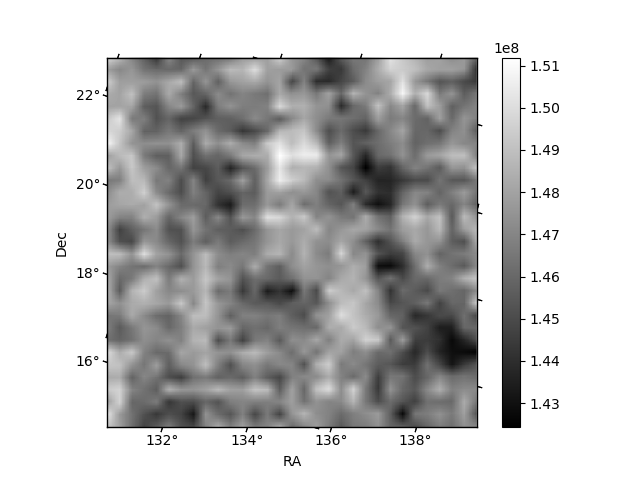
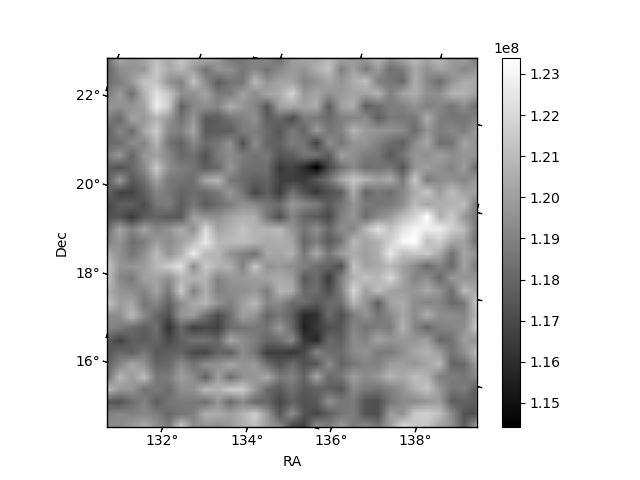
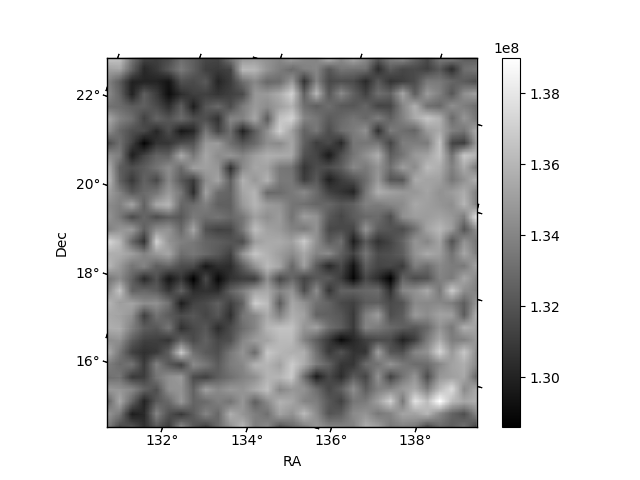
| Quadrant D | 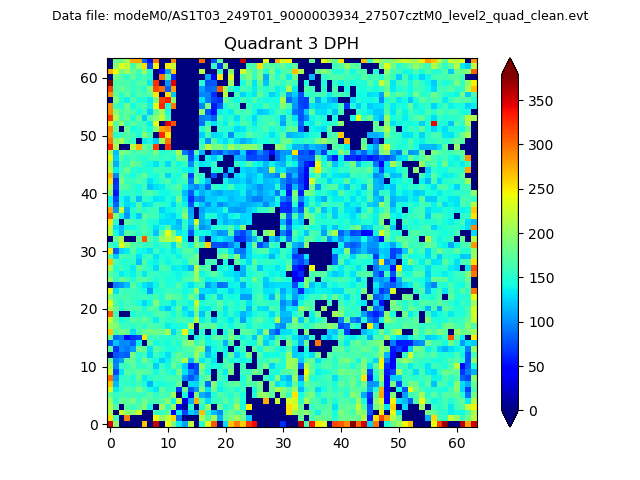 |
 |
Quadrant C |
| Plot type | Count rate plots | Images |
|---|---|---|
| Comparison with Poisson distribution Blue bars denote a histogram of data divided into 1 sec bins. Red curve is a Poisson curve with rate = median count rate of data. |
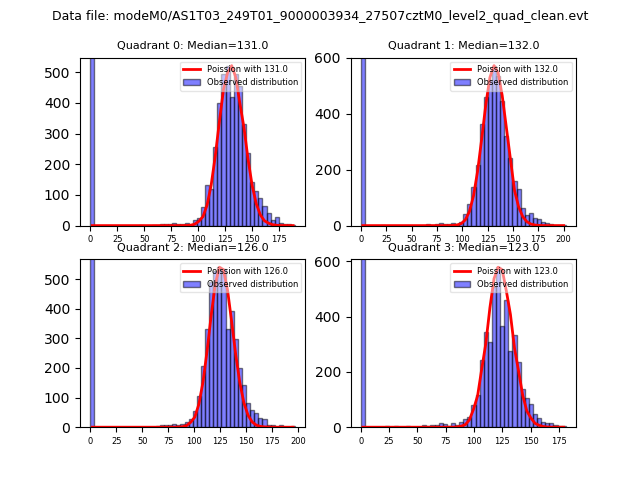 |
 |
| Quadrant-wise count rates Data is divided into 100 sec bins |
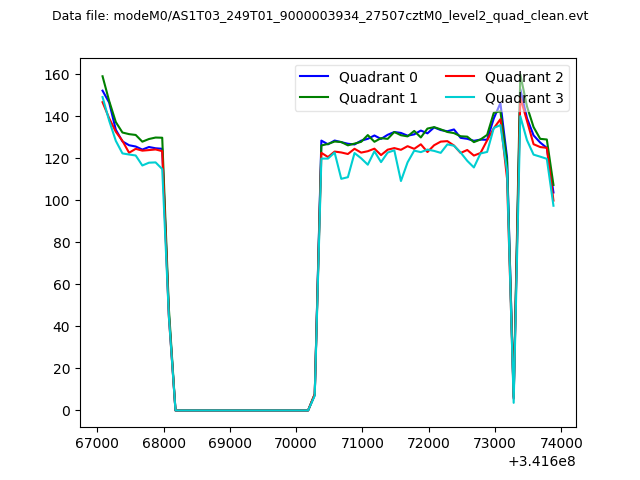 |
|
| Module-wise count rates for Quadrant A Data is divided into 100 sec bins |
 |
 |
| Module-wise count rates for Quadrant B Data is divided into 100 sec bins |
 |
 |
| Module-wise count rates for Quadrant C Data is divided into 100 sec bins |
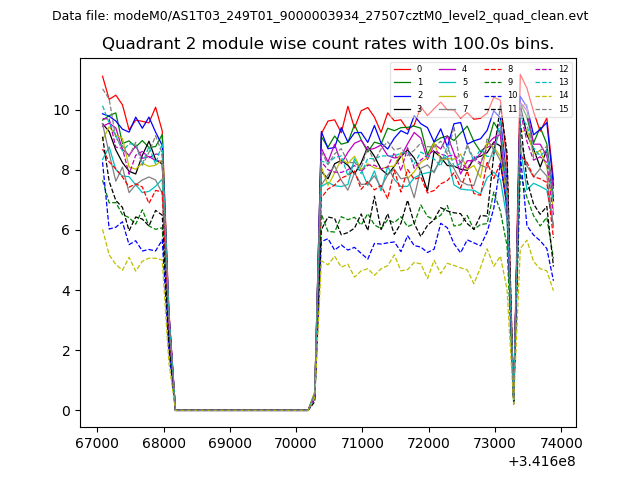 |
 |
| Module-wise count rates for Quadrant D Data is divided into 100 sec bins |
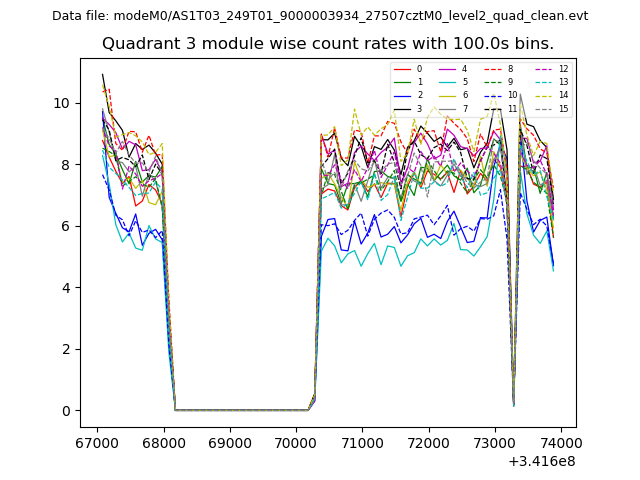 |
 |
| Parameter | Plot |
|---|---|
| CZT HV Monitor | 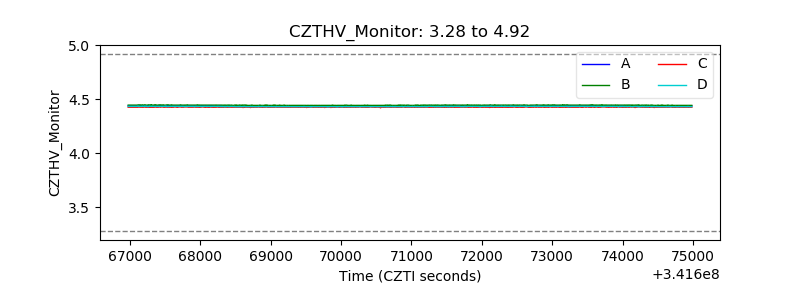 |
| D_VDD | 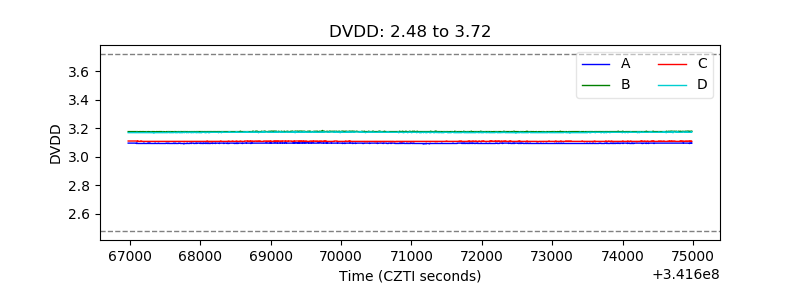 |
| Temperature 1 | 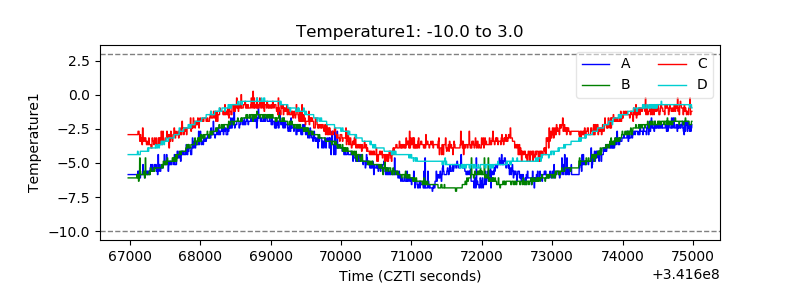 |
| Veto HV Monitor | 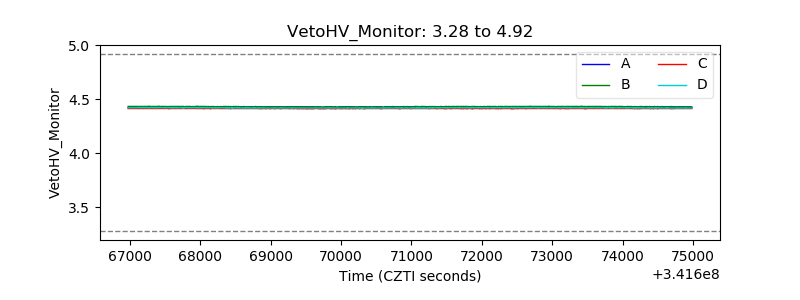 |
| Veto LLD | 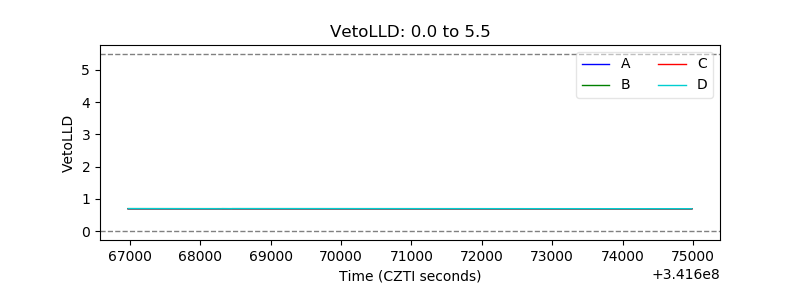 |
| Alpha Counter | 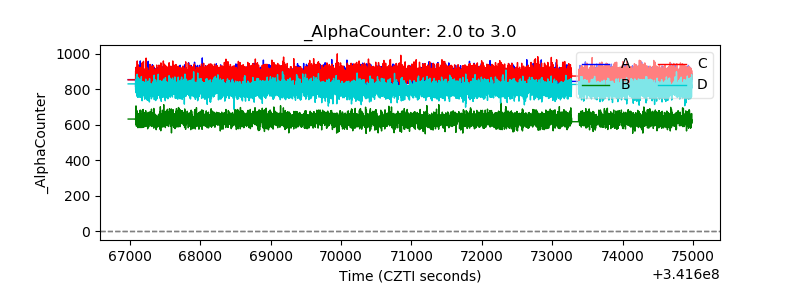 |
| _CPM_Rate | 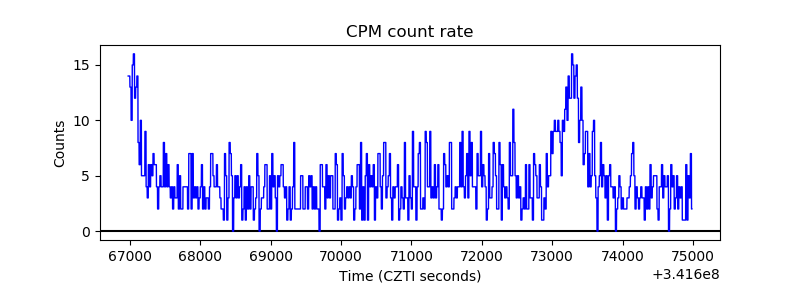 |
| CZT Counter | 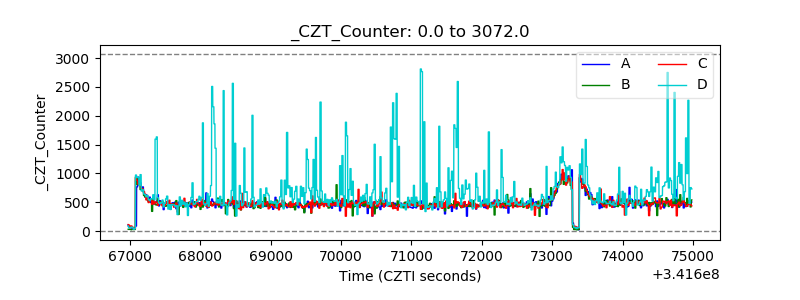 |
| +2.5 Volts monitor |  |
| +5 Volts monitor |  |
| _ROLL_ROT | 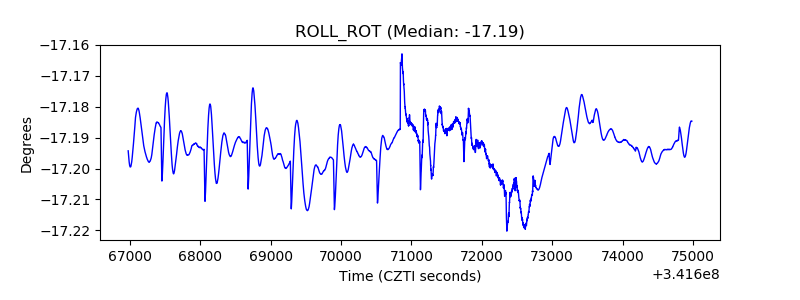 |
| _Roll_DEC | 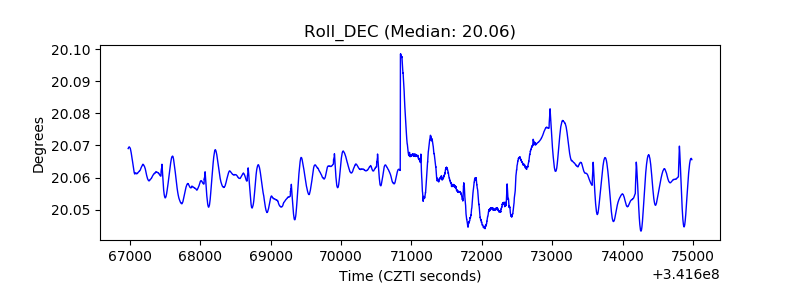 |
| _Roll_RA | 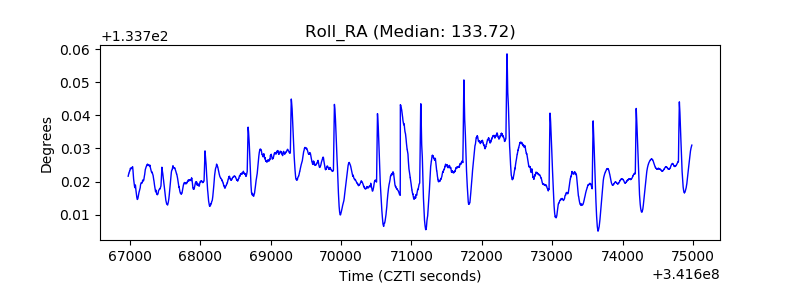 |
| Veto Counter | 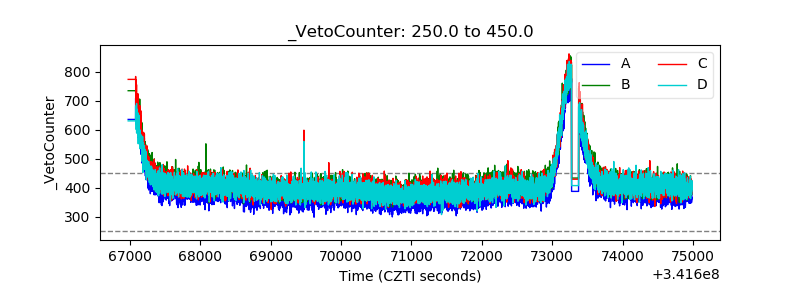 |