| Param | Original file | Final file |
|---|---|---|
| Filename | modeM0/AS1T03_249T01_9000003934_27508cztM0_level2.evt | modeM0/AS1T03_249T01_9000003934_27508cztM0_level2_quad_clean.evt |
| Size (bytes) | 530,256,960 | 73,886,400 |
| Size | 505.7 MB | 70.5 MB |
| Events in quadrant A | 3,428,575 | 444,026 |
| Events in quadrant B | 3,561,979 | 443,878 |
| Events in quadrant C | 3,537,372 | 424,552 |
| Events in quadrant D | 5,042,047 | 423,261 |
| Mode M0 | |||
|---|---|---|---|
| Quadrant | BADHDUFLAG | Total packets | Discarded packets |
| A | 0 | 14737 | 0 |
| B | 0 | 15020 | 0 |
| C | 0 | 14994 | 0 |
| D | 0 | 19804 | 0 |
| Mode M9 | |||
|---|---|---|---|
| Quadrant | BADHDUFLAG | Total packets | Discarded packets |
| A | 0 | 3 | 0 |
| B | 0 | 3 | 0 |
| C | 0 | 3 | 0 |
| D | 0 | 3 | 0 |
| Quadrant | Total seconds | Saturated seconds | Saturation percentage |
|---|---|---|---|
| A | 7195 | 76 | 1.056289% |
| B | 7196 | 99 | 1.375764% |
| C | 7195 | 128 | 1.779013% |
| D | 7195 | 359 | 4.989576% |
Noise dominated data is calculated using 1-second bins in cleaned event files. If a bin has >2000 counts, and if more than 50% of those come from <1% of pixels, then it is considered to be noise-dominated and hence unusable.
| Quadrant | # 1 sec bins | Bins with >0 counts | Bins with >2000 counts | High rate bins dominated by noise | Noise dominated (total time) | Noise dominated (detector-on time) | Marked lightcurve |
|---|---|---|---|---|---|---|---|
| A | 7565 | 7195 | 0 | 0 | 0.00% | 0.00% | 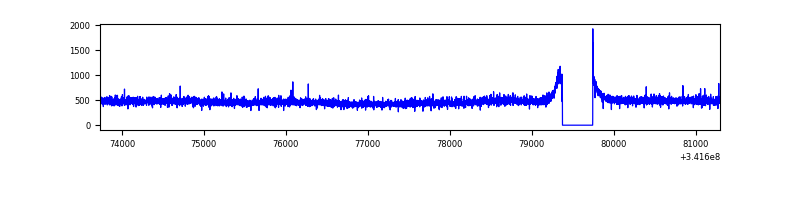 |
| B | 7566 | 7196 | 6 | 6 | 0.08% | 0.08% | 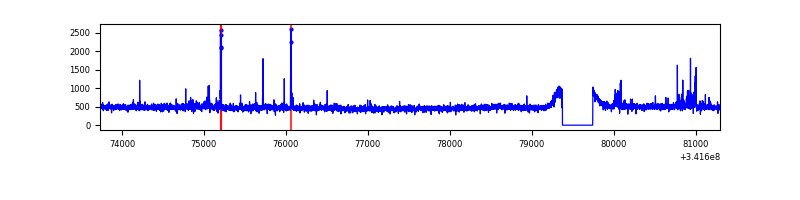 |
| C | 7565 | 7195 | 8 | 8 | 0.11% | 0.11% | 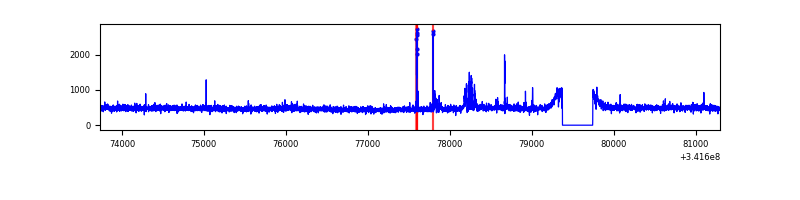 |
| D | 7565 | 7195 | 290 | 290 | 3.83% | 4.03% | 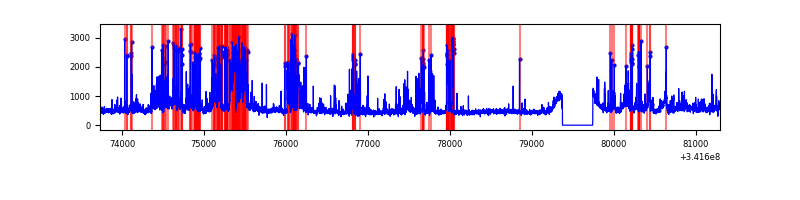 |
Top three noisy pixels from each quadrant. If the there are fewer than three noisy pixels in the level2.evt file, extra rows are filled as -1
| Pixel properties | Quadrant properties | ||||||
|---|---|---|---|---|---|---|---|
| Quadrant | DetID | PixID | Counts | Sigma | Mean | Median | Sigma |
| A | 13 | 254 | 12108 | 62.33 | 887 | 865 | 180.4 |
| A | 3 | 137 | 8744 | 43.68 | 887 | 865 | 180.4 |
| A | 0 | 226 | 7448 | 36.5 | 887 | 865 | 180.4 |
| B | 15 | 32 | 49902 | 288.36 | 877 | 857 | 170.1 |
| B | 0 | 230 | 24803 | 140.79 | 877 | 857 | 170.1 |
| B | 12 | 111 | 21267 | 120.0 | 877 | 857 | 170.1 |
| C | 14 | 238 | 135656 | 667.3 | 845 | 847 | 202.0 |
| C | 2 | 16 | 105242 | 516.75 | 845 | 847 | 202.0 |
| C | 4 | 224 | 7624 | 33.55 | 845 | 847 | 202.0 |
| D | 1 | 52 | 1401748 | 6911.84 | 847 | 822 | 202.7 |
| D | 13 | 168 | 146155 | 717.04 | 847 | 822 | 202.7 |
| D | 2 | 250 | 102226 | 500.3 | 847 | 822 | 202.7 |
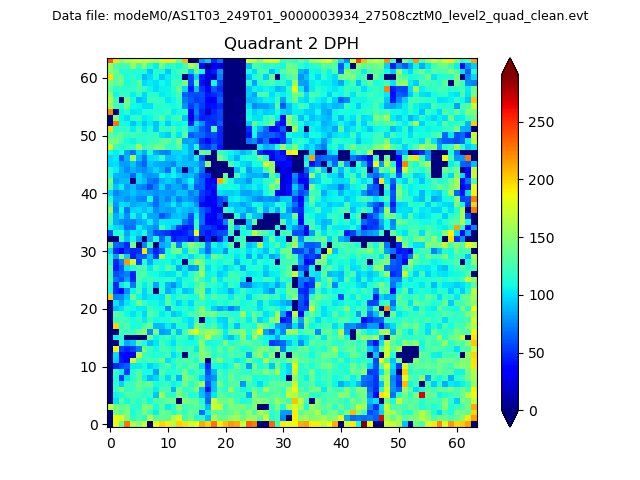
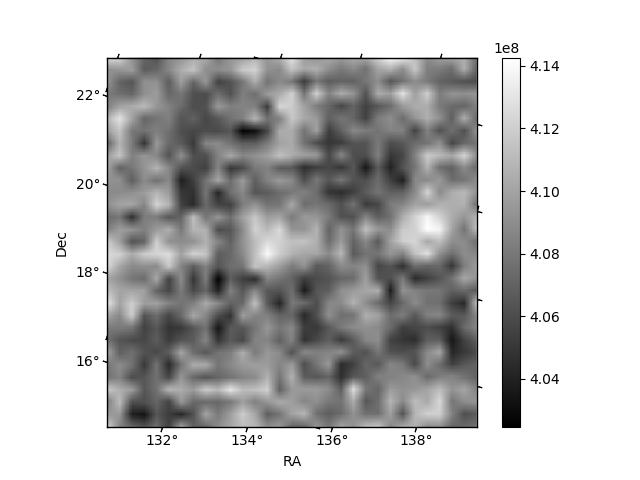
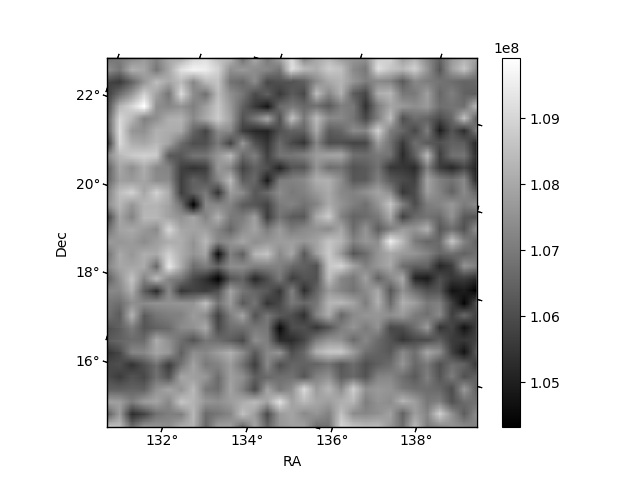
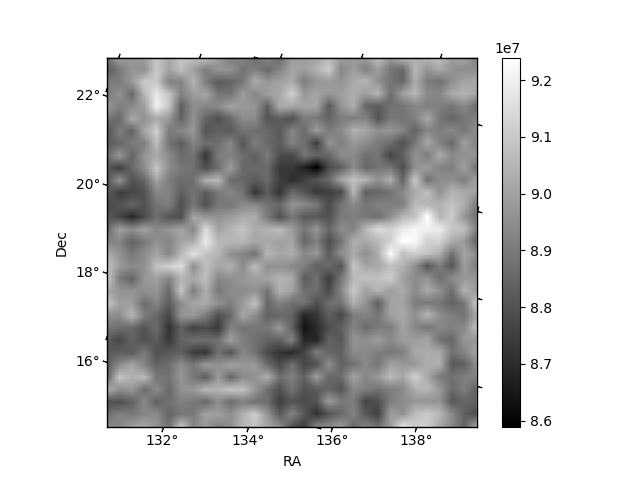
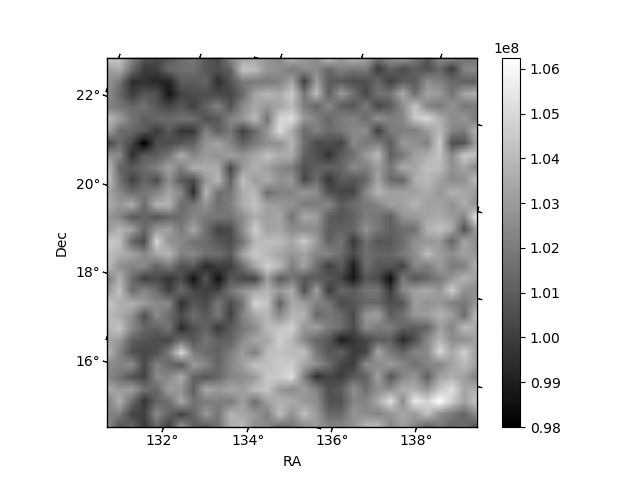
Histogram calculated using DETX and DETY for each event in the final _common_clean file
| Quadrant A | 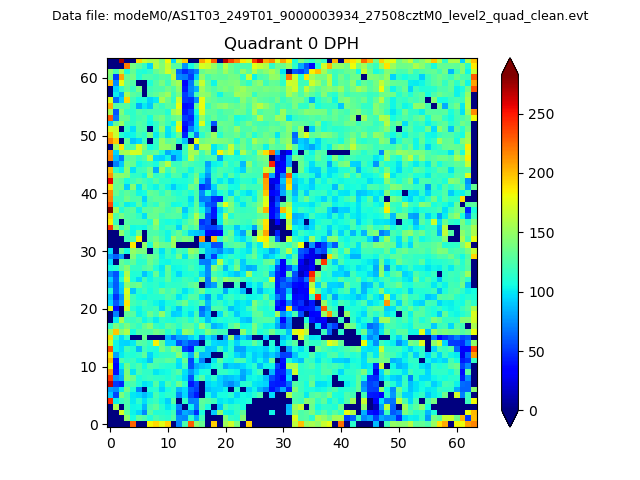 |
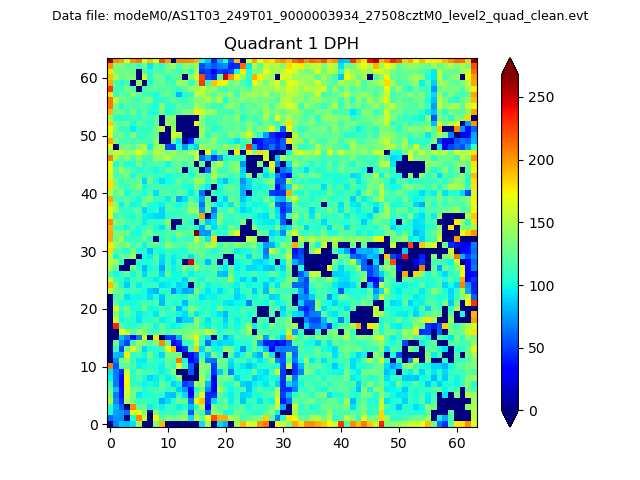 |
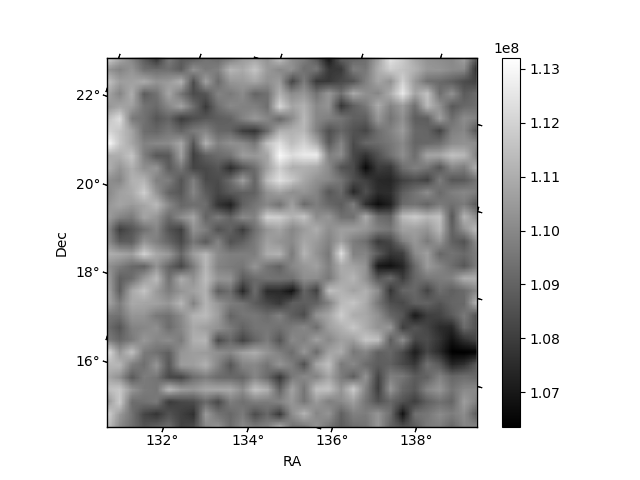
Quadrant B |
|---|---|---|---|
| Quadrant D | 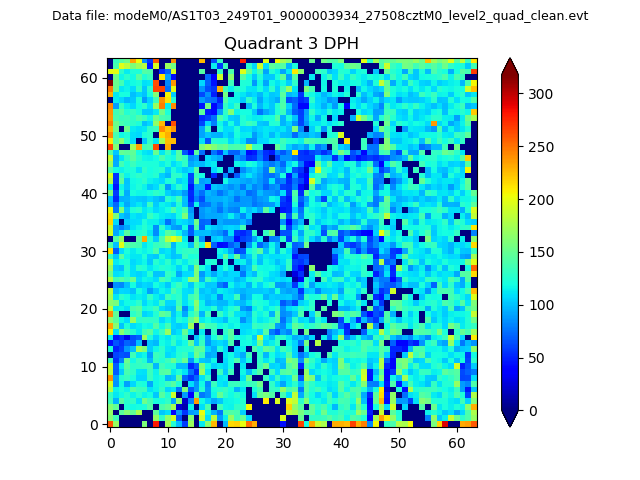 |
 |
Quadrant C |
| Plot type | Count rate plots | Images |
|---|---|---|
| Comparison with Poisson distribution Blue bars denote a histogram of data divided into 1 sec bins. Red curve is a Poisson curve with rate = median count rate of data. |
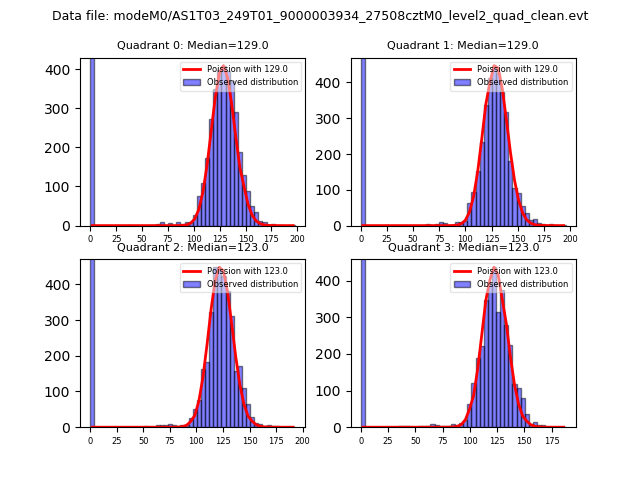 |
 |
| Quadrant-wise count rates Data is divided into 100 sec bins |
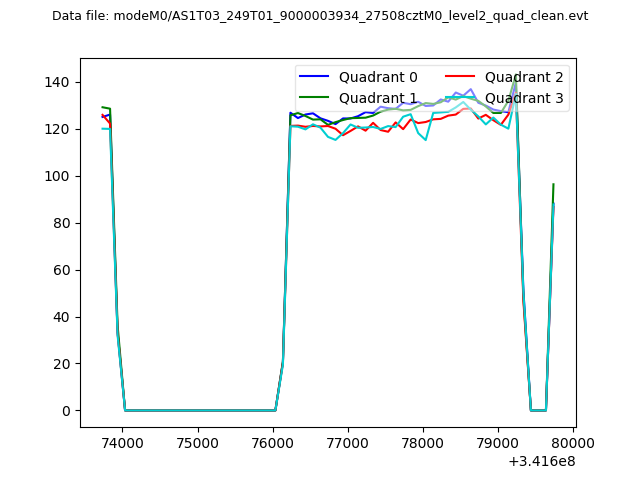 |
|
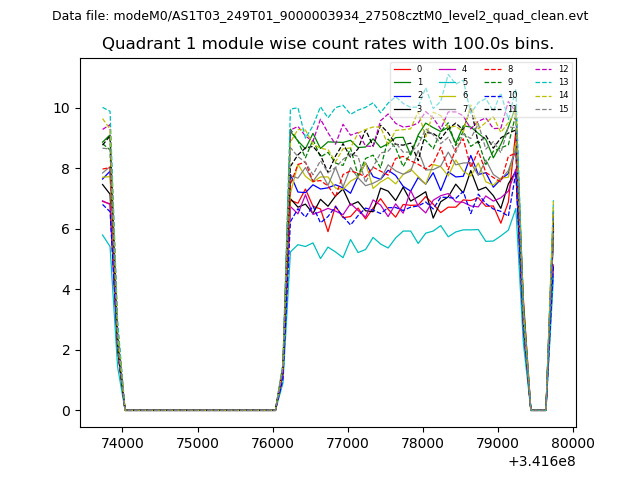
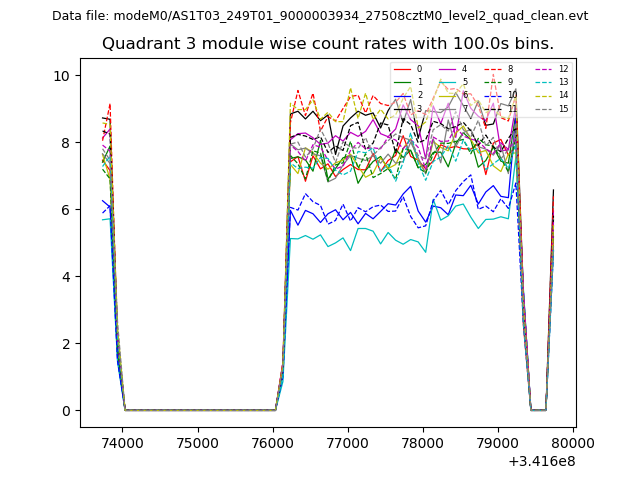
| Module-wise count rates for Quadrant A Data is divided into 100 sec bins |
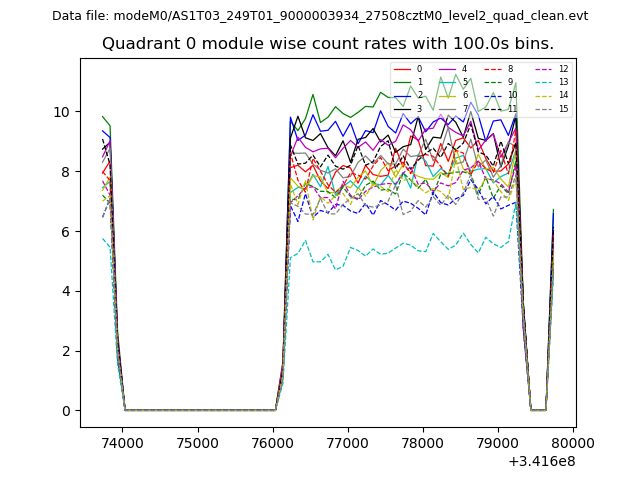 |
 |
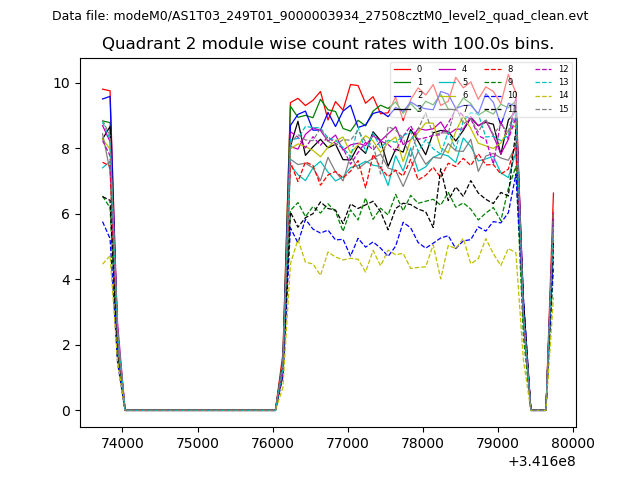
| Module-wise count rates for Quadrant B Data is divided into 100 sec bins |
 |
 |
| Module-wise count rates for Quadrant C Data is divided into 100 sec bins |
 |
 |
| Module-wise count rates for Quadrant D Data is divided into 100 sec bins |
 |
 |
| Parameter | Plot |
|---|---|
| CZT HV Monitor | 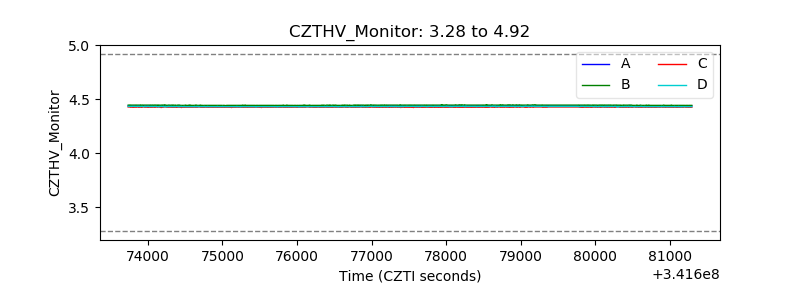 |
| D_VDD | 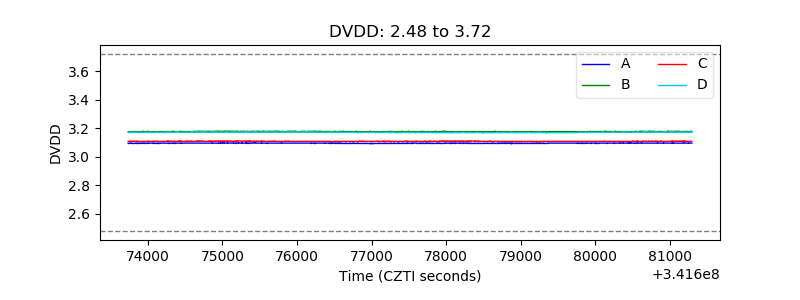 |
| Temperature 1 | 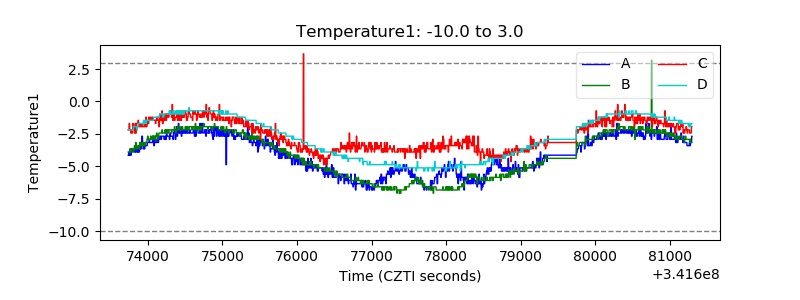 |
| Veto HV Monitor | 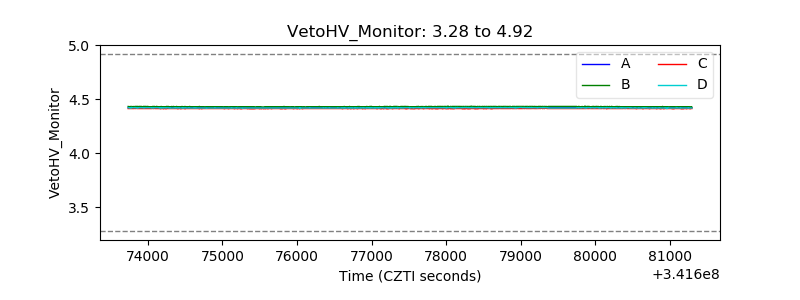 |
| Veto LLD | 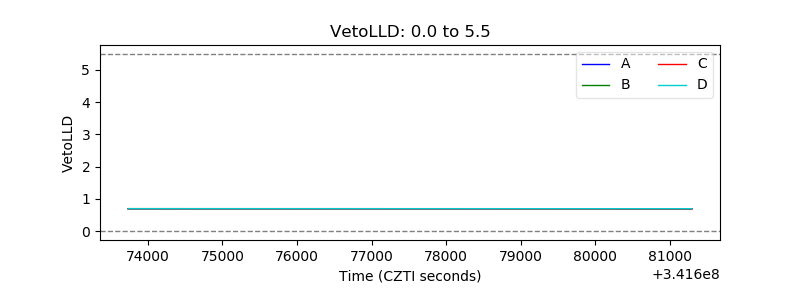 |
| Alpha Counter | 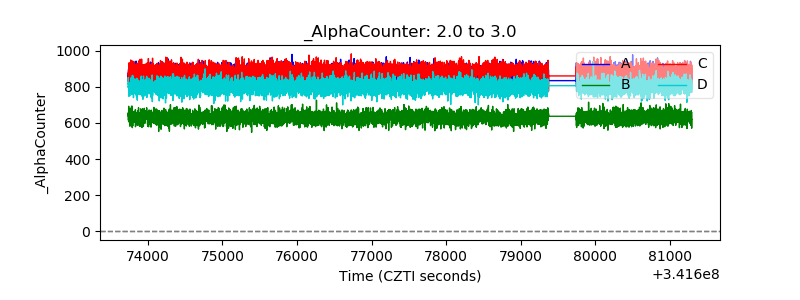 |
| _CPM_Rate | 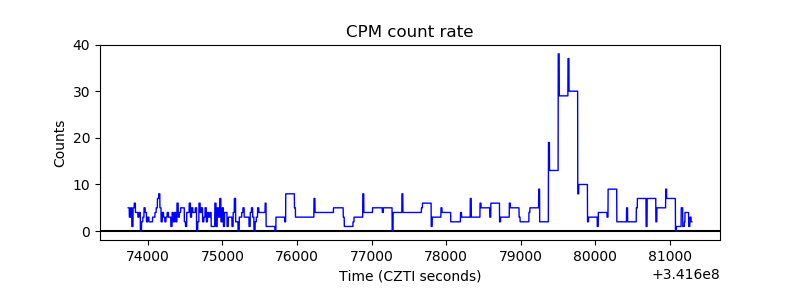 |
| CZT Counter | 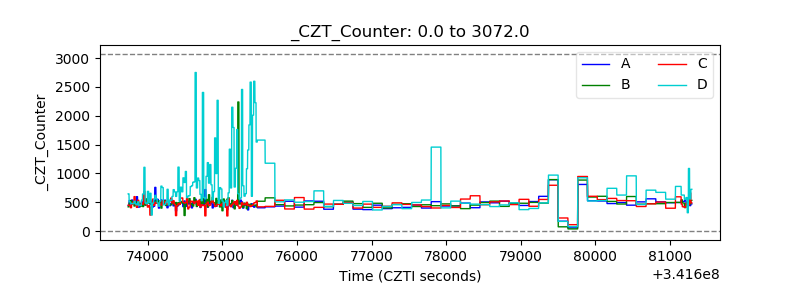 |
| +2.5 Volts monitor |  |
| +5 Volts monitor | 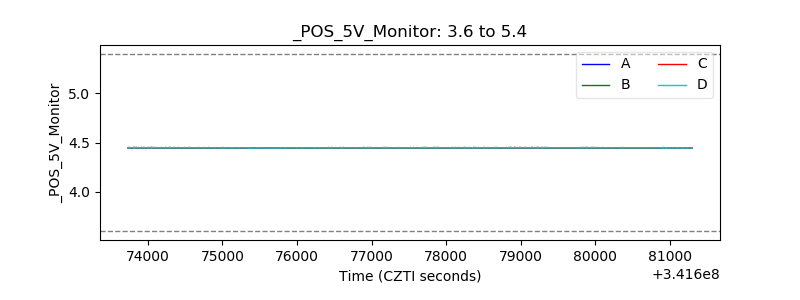 |
| _ROLL_ROT |  |
| _Roll_DEC | 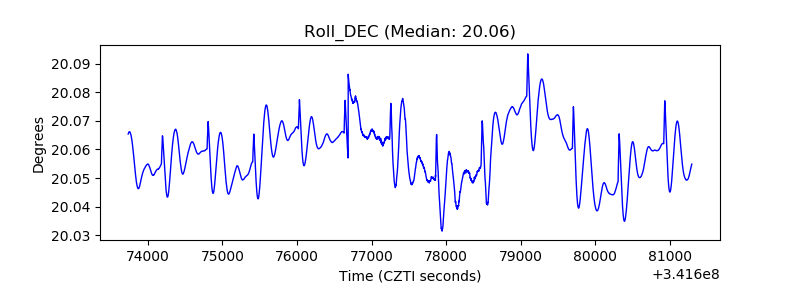 |
| _Roll_RA | 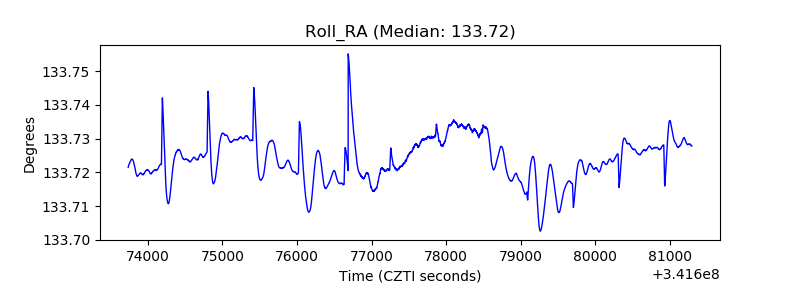 |
| Veto Counter |  |