| Param | Original file | Final file |
|---|---|---|
| Filename | modeM0/AS1T03_249T01_9000003934_27510cztM0_level2.evt | modeM0/AS1T03_249T01_9000003934_27510cztM0_level2_quad_clean.evt |
| Size (bytes) | 999,982,080 | 145,457,280 |
| Size | 953.7 MB | 138.7 MB |
| Events in quadrant A | 6,105,451 | 909,767 |
| Events in quadrant B | 6,541,866 | 906,072 |
| Events in quadrant C | 6,121,743 | 870,598 |
| Events in quadrant D | 10,653,333 | 836,881 |
| Mode M0 | |||
|---|---|---|---|
| Quadrant | BADHDUFLAG | Total packets | Discarded packets |
| A | 0 | 26254 | 0 |
| B | 0 | 27539 | 0 |
| C | 0 | 26200 | 0 |
| D | 0 | 40266 | 0 |
| Mode M9 | |||
|---|---|---|---|
| Quadrant | BADHDUFLAG | Total packets | Discarded packets |
| A | 0 | 14 | 0 |
| B | 0 | 14 | 0 |
| C | 0 | 14 | 0 |
| D | 0 | 14 | 0 |
| Quadrant | Total seconds | Saturated seconds | Saturation percentage |
|---|---|---|---|
| A | 12759 | 111 | 0.869974% |
| B | 12760 | 146 | 1.144201% |
| C | 12760 | 166 | 1.300940% |
| D | 12760 | 1105 | 8.659875% |
Noise dominated data is calculated using 1-second bins in cleaned event files. If a bin has >2000 counts, and if more than 50% of those come from <1% of pixels, then it is considered to be noise-dominated and hence unusable.
| Quadrant | # 1 sec bins | Bins with >0 counts | Bins with >2000 counts | High rate bins dominated by noise | Noise dominated (total time) | Noise dominated (detector-on time) | Marked lightcurve |
|---|---|---|---|---|---|---|---|
| A | 14069 | 12759 | 8 | 8 | 0.06% | 0.06% |  |
| B | 14070 | 12760 | 22 | 22 | 0.16% | 0.17% |  |
| C | 14070 | 12760 | 5 | 5 | 0.04% | 0.04% |  |
| D | 14070 | 12760 | 871 | 871 | 6.19% | 6.83% |  |
Top three noisy pixels from each quadrant. If the there are fewer than three noisy pixels in the level2.evt file, extra rows are filled as -1
| Pixel properties | Quadrant properties | ||||||
|---|---|---|---|---|---|---|---|
| Quadrant | DetID | PixID | Counts | Sigma | Mean | Median | Sigma |
| A | 4 | 2 | 58062 | 178.89 | 1568 | 1530 | 316.0 |
| A | 13 | 254 | 21262 | 62.44 | 1568 | 1530 | 316.0 |
| A | 3 | 137 | 15418 | 43.95 | 1568 | 1530 | 316.0 |
| B | 3 | 64 | 236392 | 786.12 | 1550 | 1510 | 298.8 |
| B | 15 | 32 | 122696 | 405.59 | 1550 | 1510 | 298.8 |
| B | 0 | 230 | 40050 | 128.99 | 1550 | 1510 | 298.8 |
| C | 14 | 238 | 239194 | 670.63 | 1498 | 1503 | 354.4 |
| C | 2 | 16 | 52072 | 142.68 | 1498 | 1503 | 354.4 |
| C | 13 | 61 | 10140 | 24.37 | 1498 | 1503 | 354.4 |
| D | 1 | 52 | 2295251 | 6477.79 | 1475 | 1435 | 354.1 |
| D | 7 | 80 | 2045873 | 5773.54 | 1475 | 1435 | 354.1 |
| D | 2 | 250 | 317897 | 893.7 | 1475 | 1435 | 354.1 |
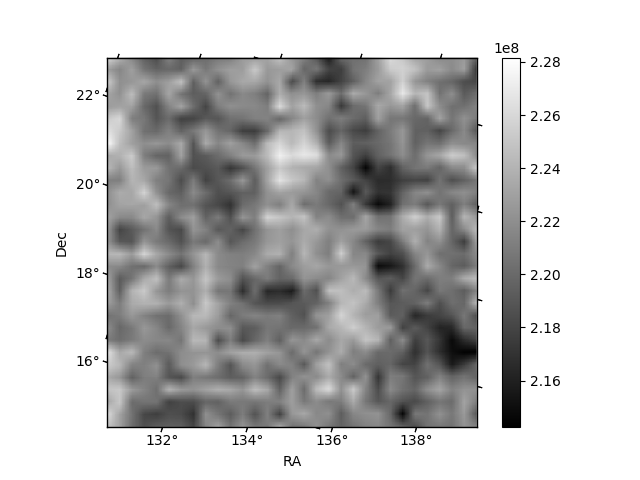
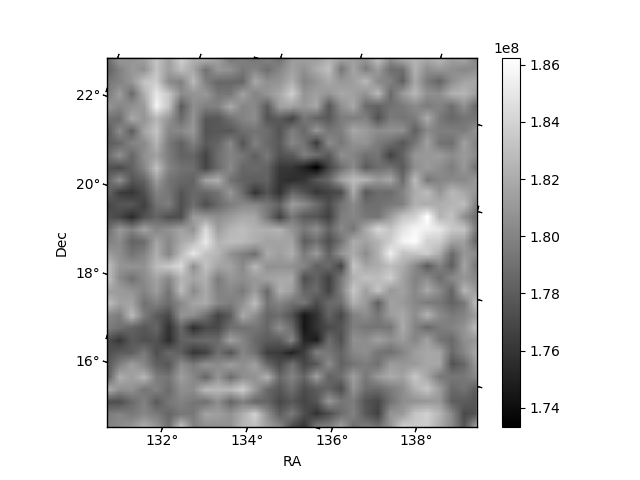
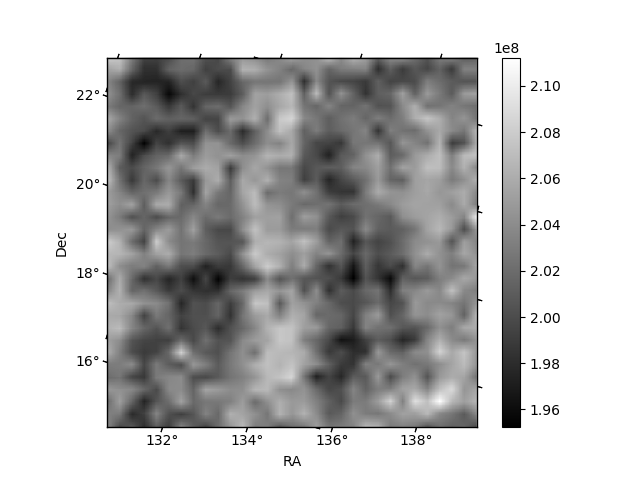
Histogram calculated using DETX and DETY for each event in the final _common_clean file
| Quadrant A |  |
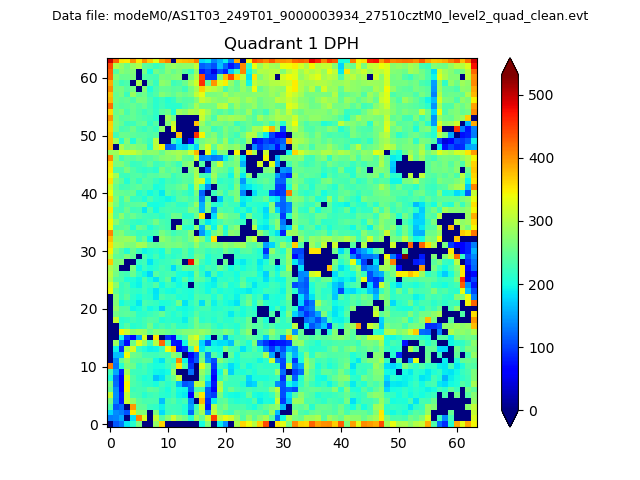 |
Quadrant B |
|---|---|---|---|
| Quadrant D | 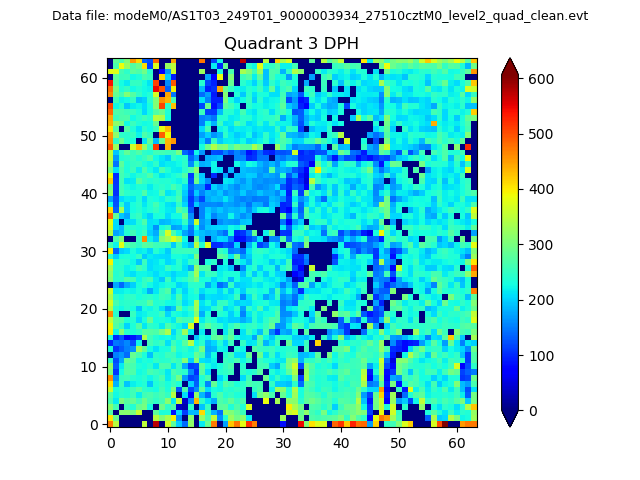 |
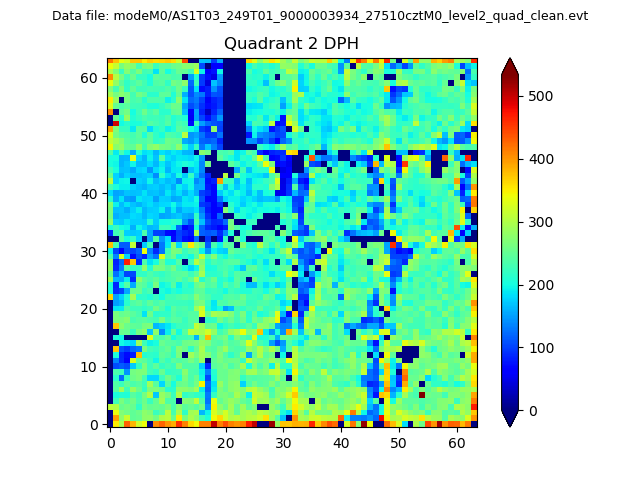 |
Quadrant C |
| Plot type | Count rate plots | Images |
|---|---|---|
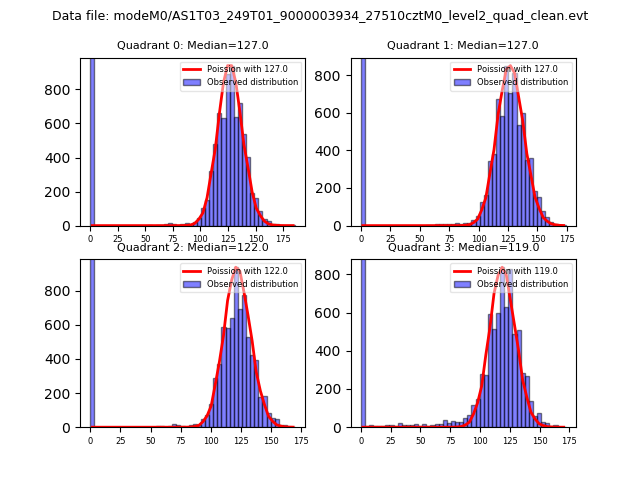
| Comparison with Poisson distribution Blue bars denote a histogram of data divided into 1 sec bins. Red curve is a Poisson curve with rate = median count rate of data. |
 |
 |
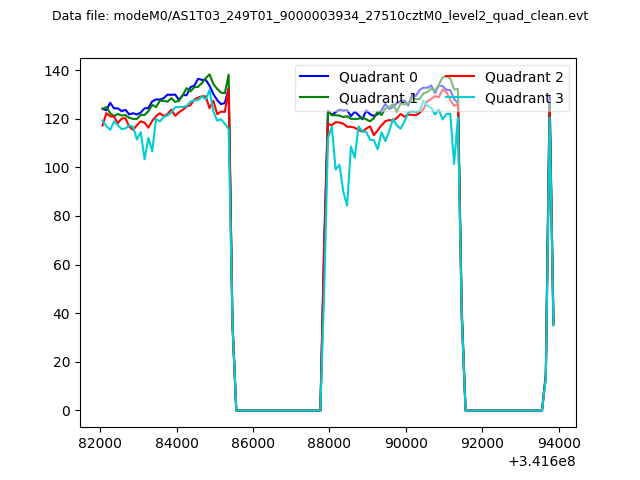
| Quadrant-wise count rates Data is divided into 100 sec bins |
 |
|
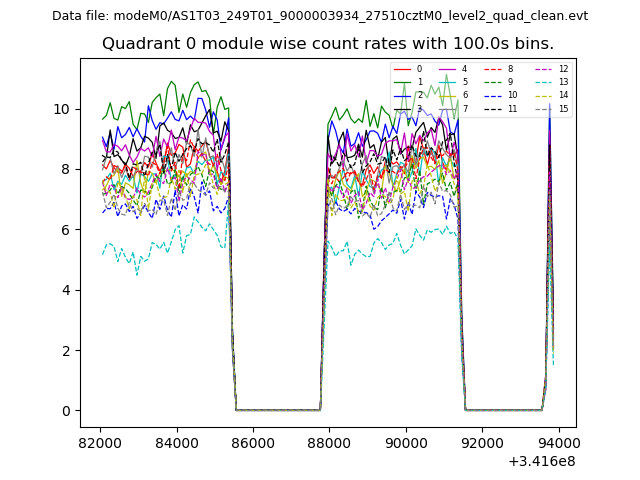
| Module-wise count rates for Quadrant A Data is divided into 100 sec bins |
 |
 |
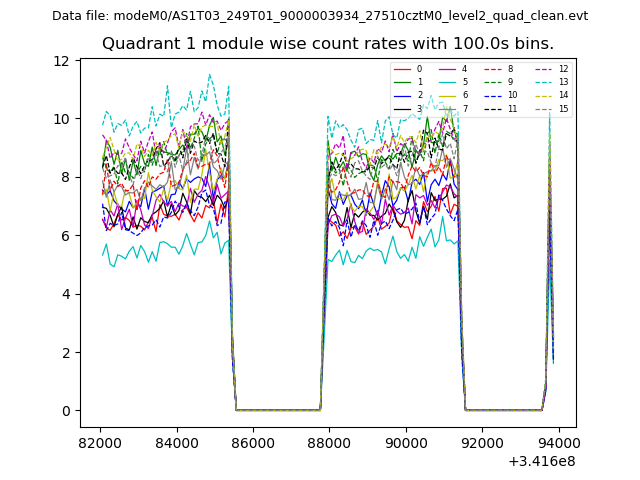
| Module-wise count rates for Quadrant B Data is divided into 100 sec bins |
 |
 |
| Module-wise count rates for Quadrant C Data is divided into 100 sec bins |
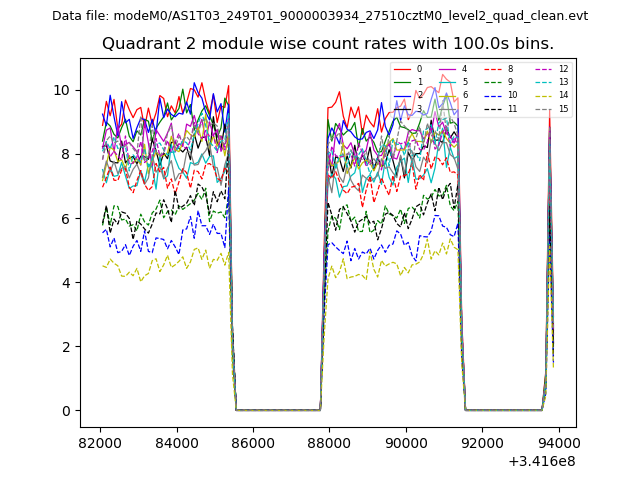 |
 |
| Module-wise count rates for Quadrant D Data is divided into 100 sec bins |
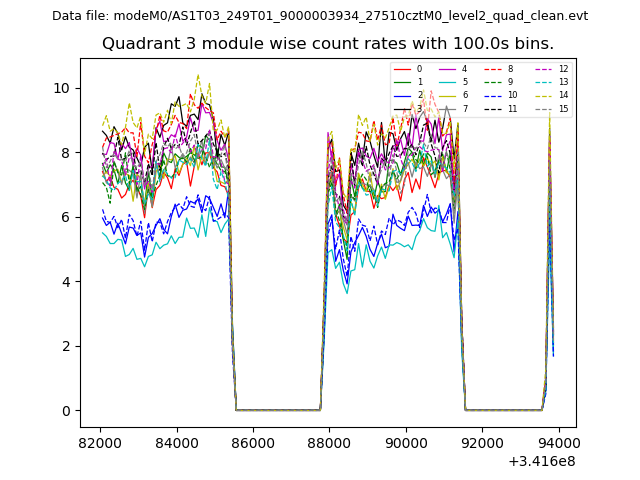 |
 |
| Parameter | Plot |
|---|---|
| CZT HV Monitor |  |
| D_VDD | 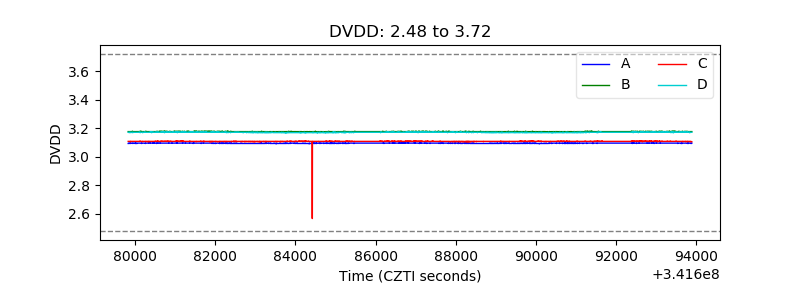 |
| Temperature 1 | 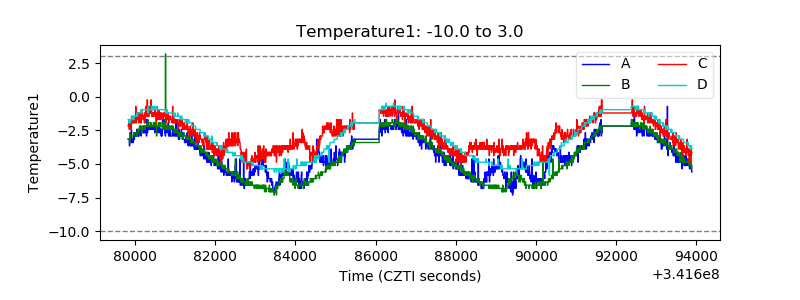 |
| Veto HV Monitor | 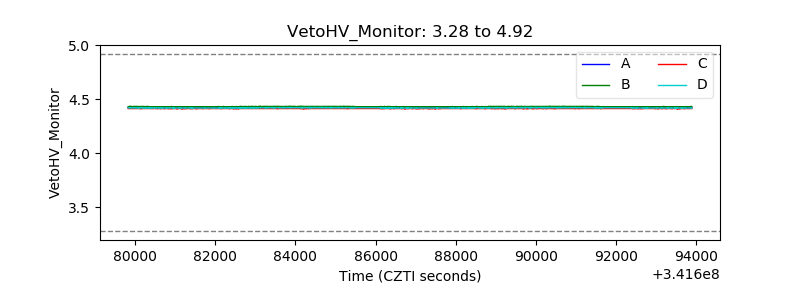 |
| Veto LLD | 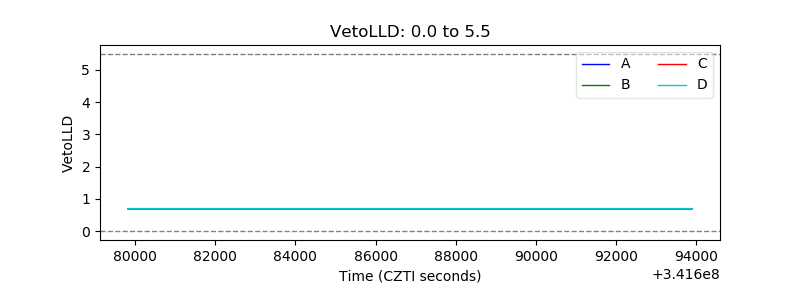 |
| Alpha Counter | 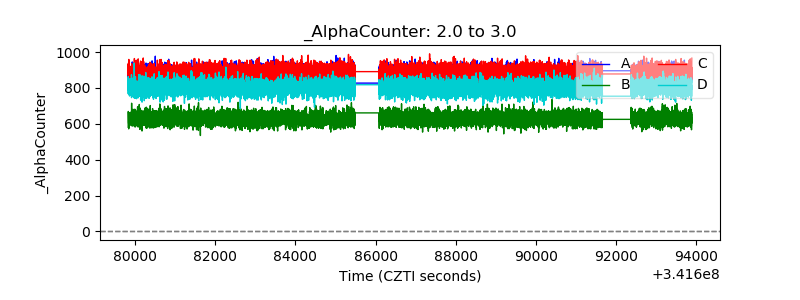 |
| _CPM_Rate | 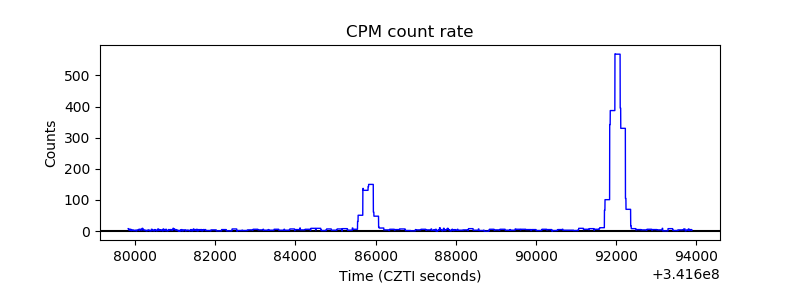 |
| CZT Counter | 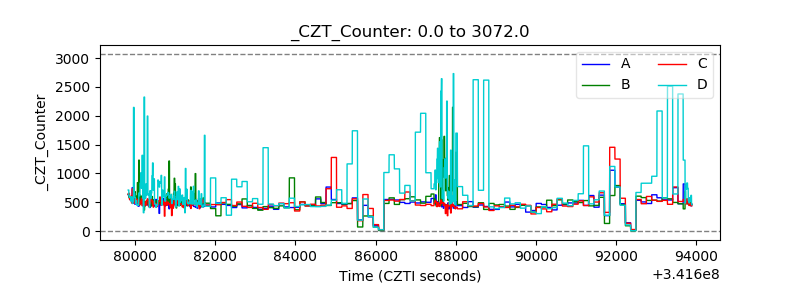 |
| +2.5 Volts monitor |  |
| +5 Volts monitor |  |
| _ROLL_ROT | 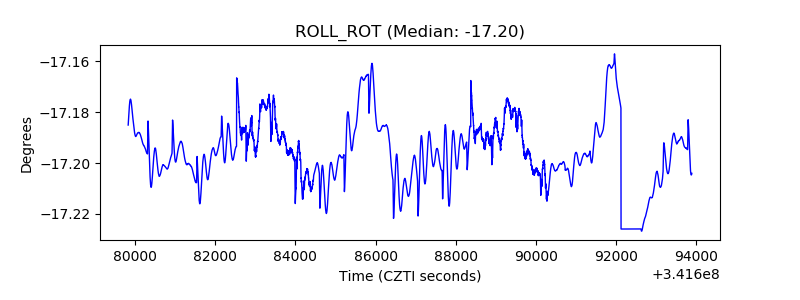 |
| _Roll_DEC | 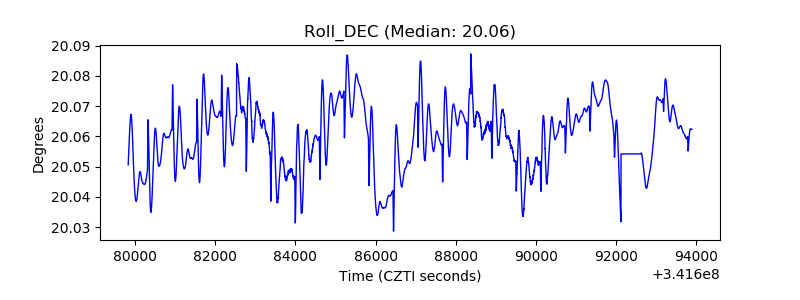 |
| _Roll_RA | 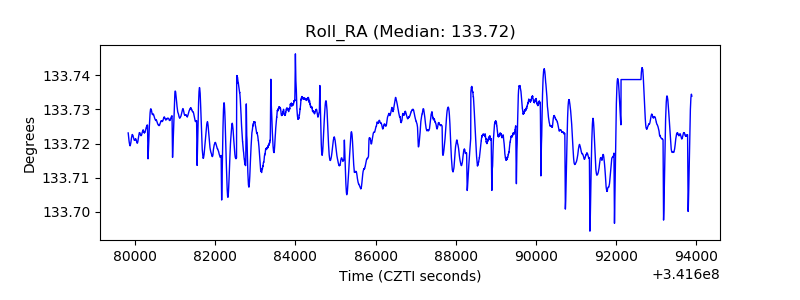 |
| Veto Counter | 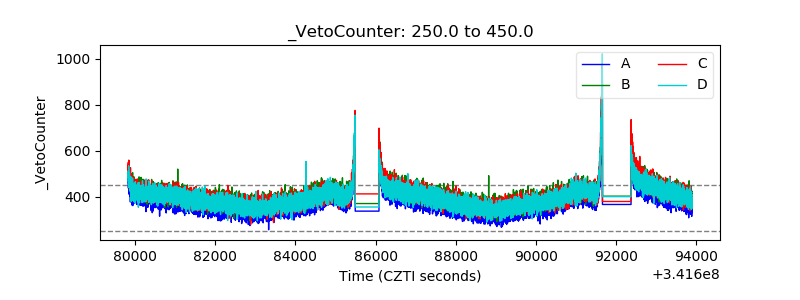 |