| Param | Original file | Final file |
|---|---|---|
| Filename | modeM0/AS1T03_249T01_9000003934_27512cztM0_level2.evt | modeM0/AS1T03_249T01_9000003934_27512cztM0_level2_quad_clean.evt |
| Size (bytes) | 531,852,480 | 90,768,960 |
| Size | 507.2 MB | 86.6 MB |
| Events in quadrant A | 3,229,766 | 586,507 |
| Events in quadrant B | 3,317,339 | 593,602 |
| Events in quadrant C | 3,251,326 | 564,432 |
| Events in quadrant D | 5,860,706 | 543,577 |
| Mode M0 | |||
|---|---|---|---|
| Quadrant | BADHDUFLAG | Total packets | Discarded packets |
| A | 0 | 13915 | 0 |
| B | 0 | 14221 | 0 |
| C | 0 | 13969 | 0 |
| D | 0 | 22024 | 0 |
| Mode M9 | |||
|---|---|---|---|
| Quadrant | BADHDUFLAG | Total packets | Discarded packets |
| A | 0 | 12 | 0 |
| B | 0 | 13 | 0 |
| C | 0 | 13 | 0 |
| D | 0 | 13 | 0 |
| Quadrant | Total seconds | Saturated seconds | Saturation percentage |
|---|---|---|---|
| A | 6607 | 27 | 0.408657% |
| B | 6607 | 50 | 0.756773% |
| C | 6606 | 91 | 1.377536% |
| D | 6606 | 739 | 11.186800% |
Noise dominated data is calculated using 1-second bins in cleaned event files. If a bin has >2000 counts, and if more than 50% of those come from <1% of pixels, then it is considered to be noise-dominated and hence unusable.
| Quadrant | # 1 sec bins | Bins with >0 counts | Bins with >2000 counts | High rate bins dominated by noise | Noise dominated (total time) | Noise dominated (detector-on time) | Marked lightcurve |
|---|---|---|---|---|---|---|---|
| A | 7652 | 6608 | 1 | 1 | 0.01% | 0.02% | 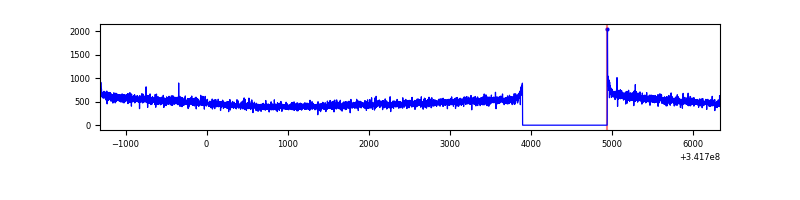 |
| B | 7652 | 6608 | 2 | 2 | 0.03% | 0.03% | 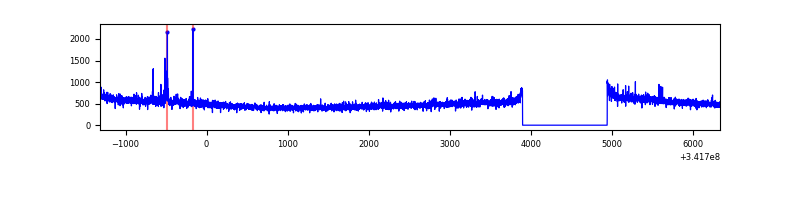 |
| C | 7651 | 6606 | 0 | 0 | 0.00% | 0.00% | 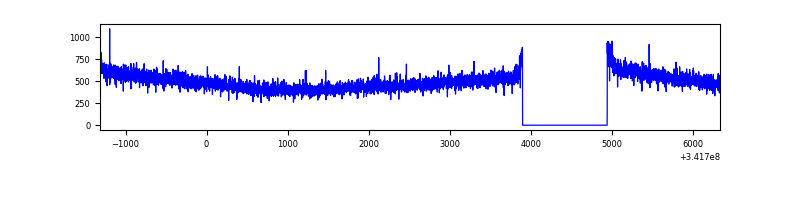 |
| D | 7651 | 6606 | 657 | 657 | 8.59% | 9.95% | 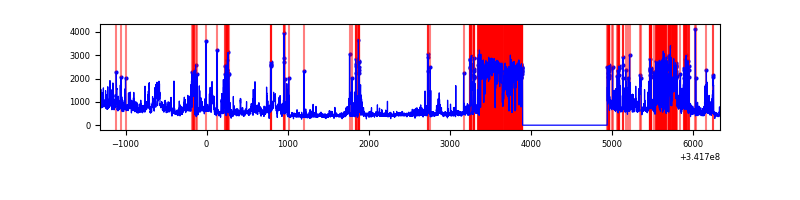 |
Top three noisy pixels from each quadrant. If the there are fewer than three noisy pixels in the level2.evt file, extra rows are filled as -1
| Pixel properties | Quadrant properties | ||||||
|---|---|---|---|---|---|---|---|
| Quadrant | DetID | PixID | Counts | Sigma | Mean | Median | Sigma |
| A | 13 | 254 | 11507 | 63.49 | 835 | 818 | 168.3 |
| A | 3 | 137 | 8159 | 43.61 | 835 | 818 | 168.3 |
| A | 0 | 226 | 7163 | 37.69 | 835 | 818 | 168.3 |
| B | 0 | 230 | 27362 | 166.81 | 832 | 811 | 159.2 |
| B | 15 | 32 | 19667 | 118.47 | 832 | 811 | 159.2 |
| B | 12 | 111 | 19375 | 116.63 | 832 | 811 | 159.2 |
| C | 14 | 238 | 128438 | 676.81 | 801 | 806 | 188.6 |
| C | 13 | 61 | 5416 | 24.45 | 801 | 806 | 188.6 |
| C | 2 | 16 | 2449 | 8.71 | 801 | 806 | 188.6 |
| D | 1 | 52 | 2187645 | 11804.4 | 766 | 745 | 185.3 |
| D | 7 | 80 | 494926 | 2667.48 | 766 | 745 | 185.3 |
| D | 2 | 250 | 122401 | 656.67 | 766 | 745 | 185.3 |
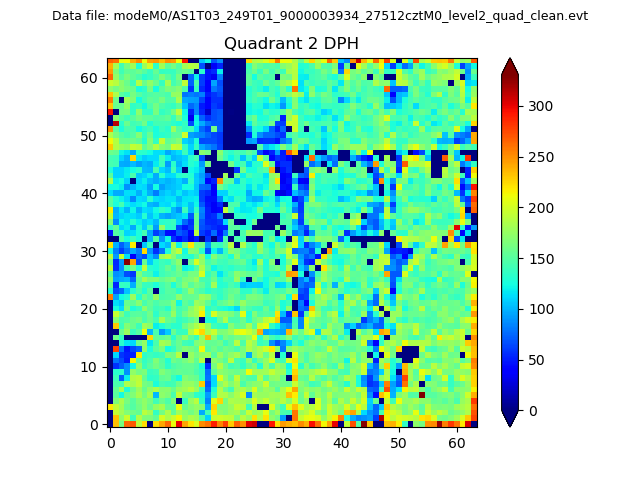
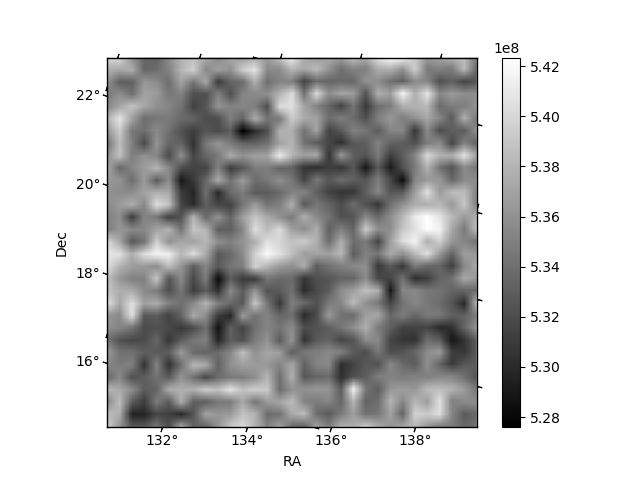
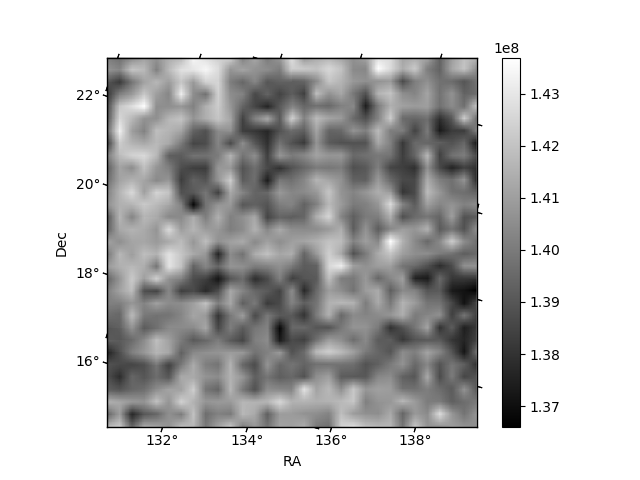
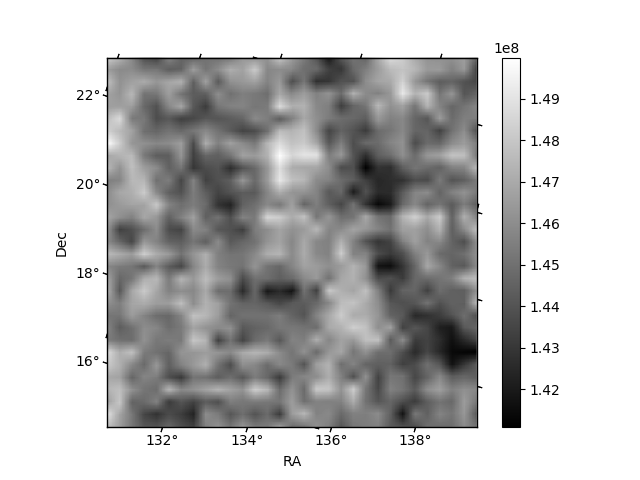
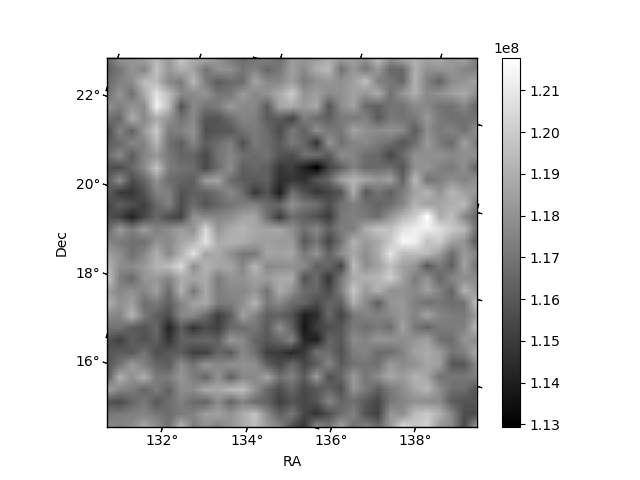
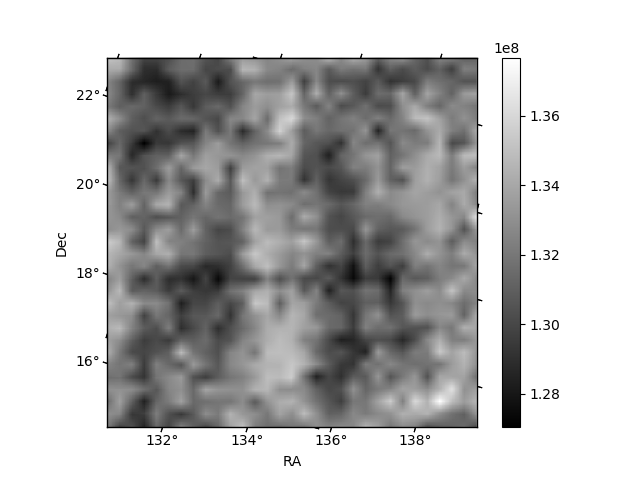
Histogram calculated using DETX and DETY for each event in the final _common_clean file
| Quadrant A | 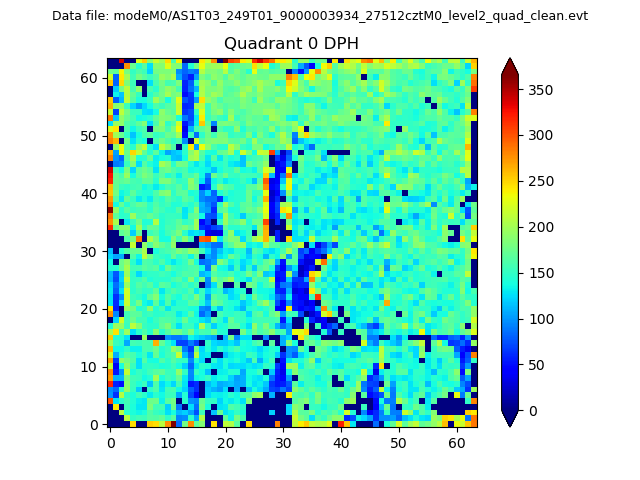 |
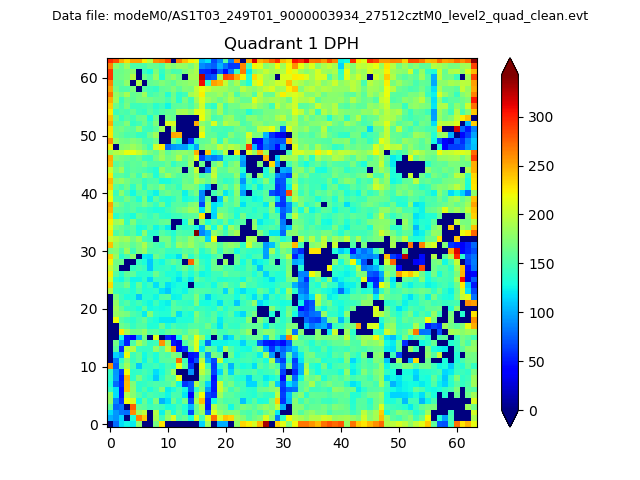 |
Quadrant B |
|---|---|---|---|
| Quadrant D | 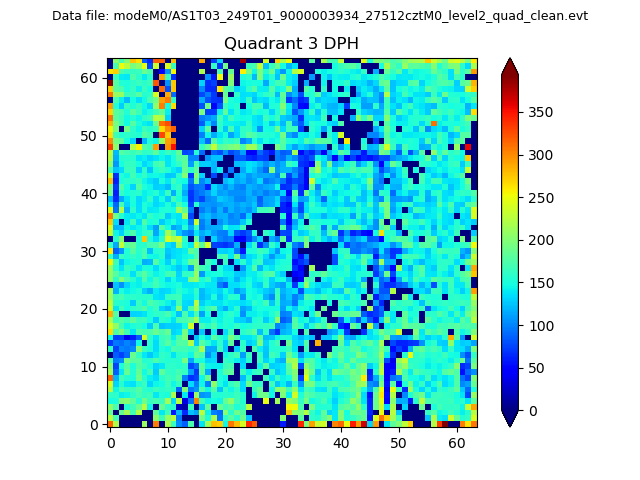 |
 |
Quadrant C |
| Plot type | Count rate plots | Images |
|---|---|---|
| Comparison with Poisson distribution Blue bars denote a histogram of data divided into 1 sec bins. Red curve is a Poisson curve with rate = median count rate of data. |
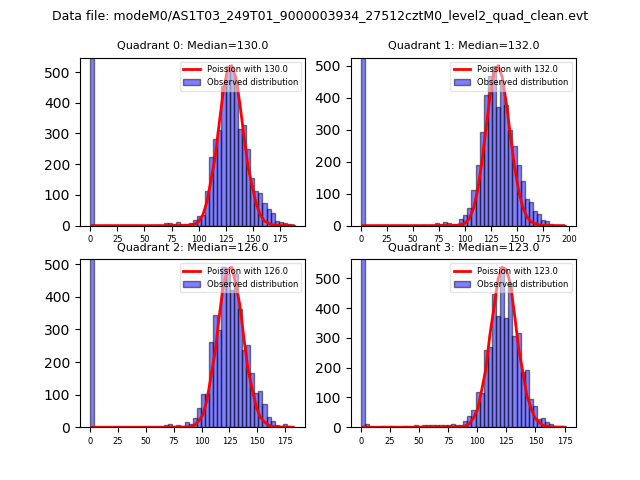 |
 |
| Quadrant-wise count rates Data is divided into 100 sec bins |
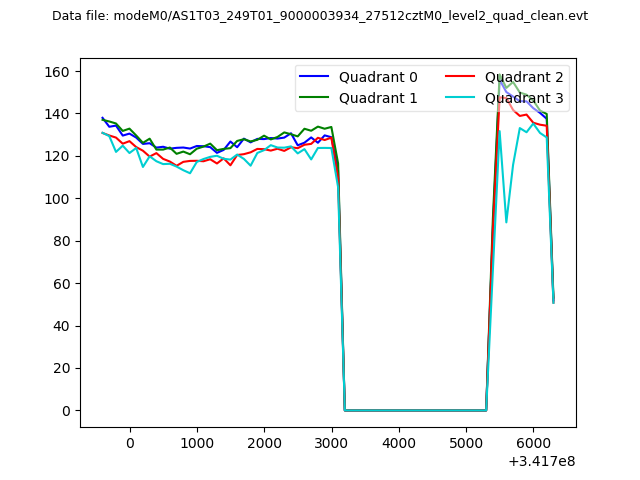 |
|
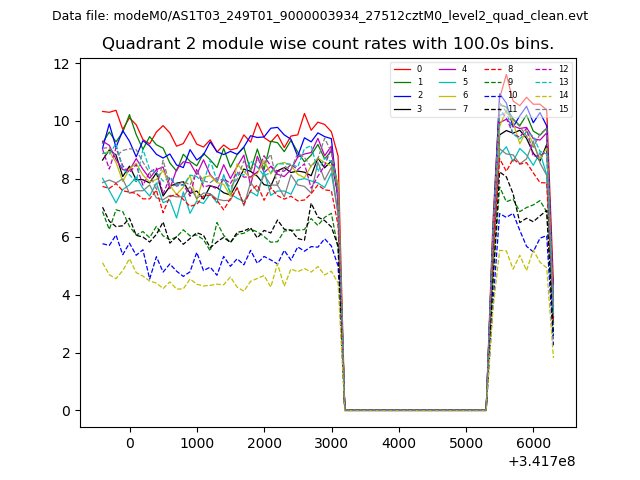
| Module-wise count rates for Quadrant A Data is divided into 100 sec bins |
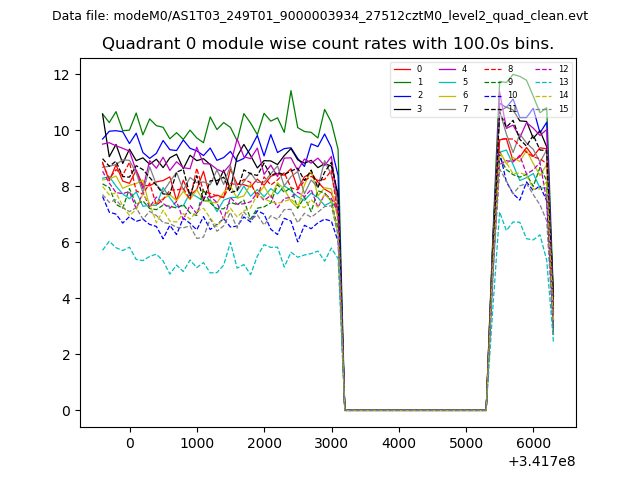 |
 |
| Module-wise count rates for Quadrant B Data is divided into 100 sec bins |
 |
 |
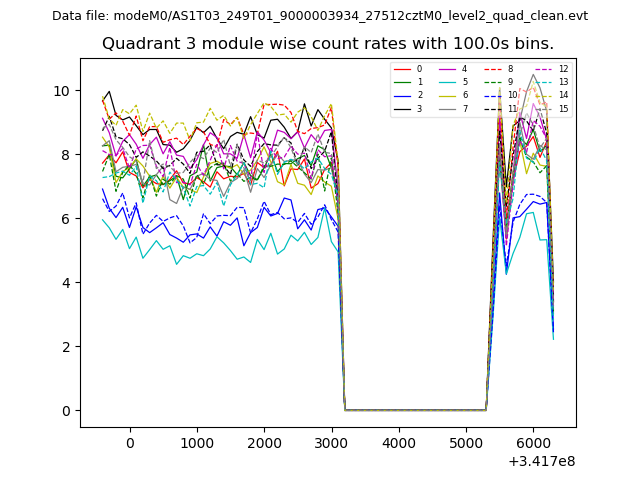
| Module-wise count rates for Quadrant C Data is divided into 100 sec bins |
 |
 |
| Module-wise count rates for Quadrant D Data is divided into 100 sec bins |
 |
 |
| Parameter | Plot |
|---|---|
| CZT HV Monitor | 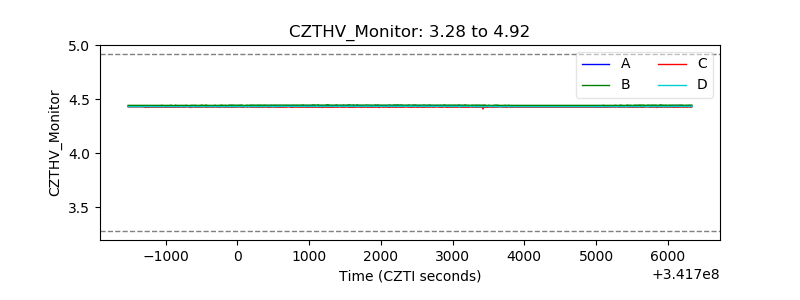 |
| D_VDD | 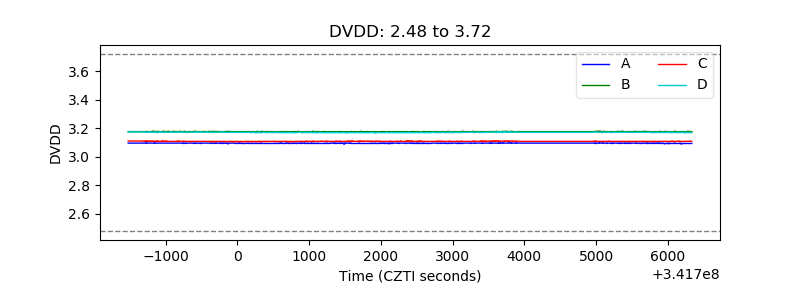 |
| Temperature 1 | 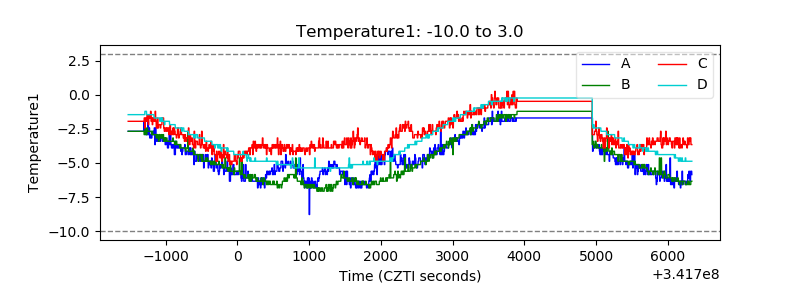 |
| Veto HV Monitor | 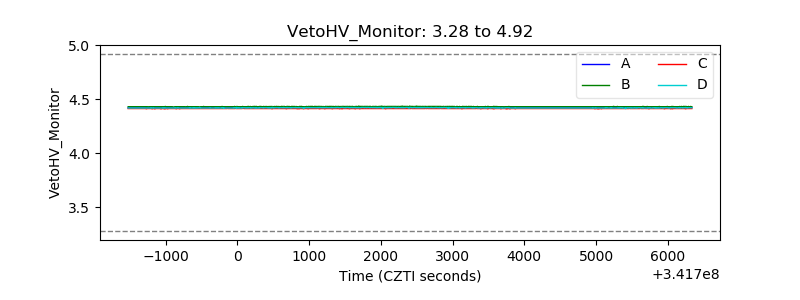 |
| Veto LLD | 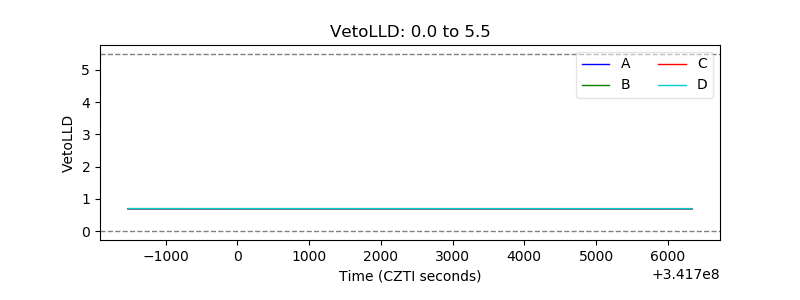 |
| Alpha Counter |  |
| _CPM_Rate | 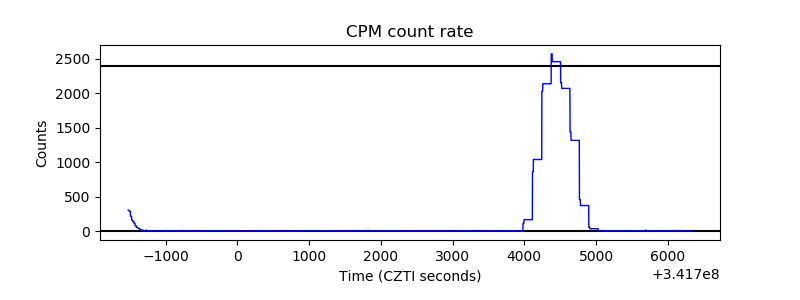 |
| CZT Counter | 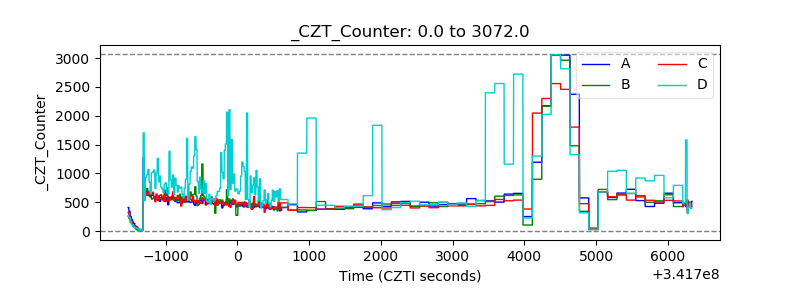 |
| +2.5 Volts monitor |  |
| +5 Volts monitor |  |
| _ROLL_ROT | 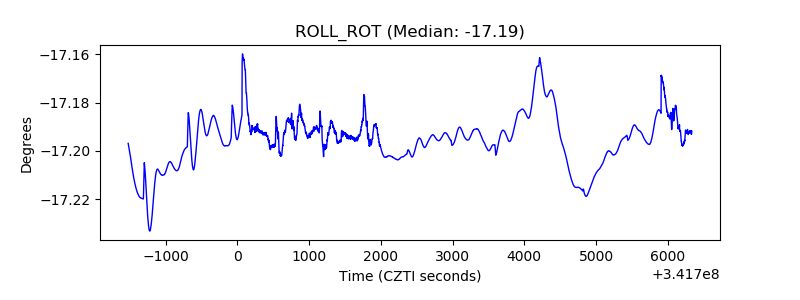 |
| _Roll_DEC | 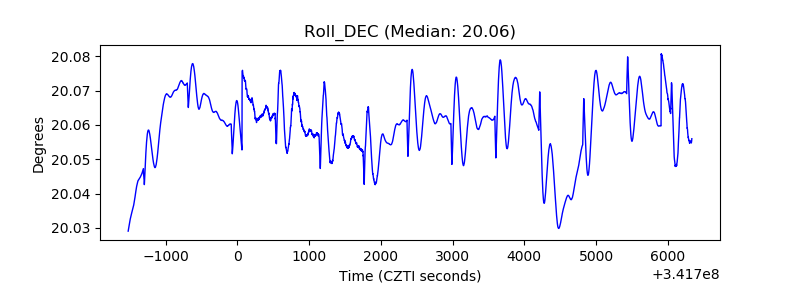 |
| _Roll_RA | 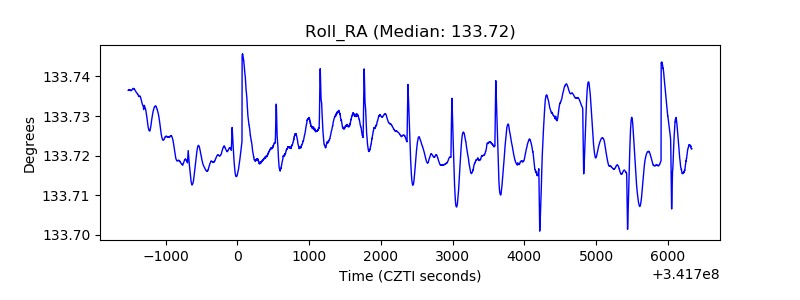 |
| Veto Counter | 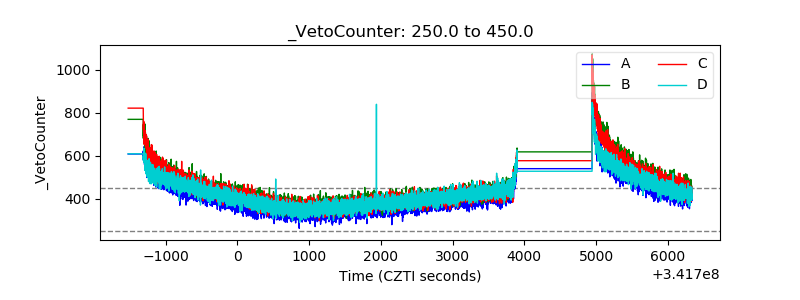 |