| Param | Original file | Final file |
|---|---|---|
| Filename | modeM0/AS1T03_249T01_9000003934_27514cztM0_level2.evt | modeM0/AS1T03_249T01_9000003934_27514cztM0_level2_quad_clean.evt |
| Size (bytes) | 480,726,720 | 102,556,800 |
| Size | 458.5 MB | 97.8 MB |
| Events in quadrant A | 3,058,833 | 686,908 |
| Events in quadrant B | 3,168,005 | 700,613 |
| Events in quadrant C | 3,090,975 | 660,126 |
| Events in quadrant D | 4,820,017 | 625,647 |
| Mode M0 | |||
|---|---|---|---|
| Quadrant | BADHDUFLAG | Total packets | Discarded packets |
| A | 0 | 13074 | 0 |
| B | 0 | 13427 | 0 |
| C | 0 | 13162 | 0 |
| D | 0 | 18590 | 0 |
| Mode M9 | |||
|---|---|---|---|
| Quadrant | BADHDUFLAG | Total packets | Discarded packets |
| A | 0 | 12 | 0 |
| B | 0 | 12 | 0 |
| C | 0 | 12 | 0 |
| D | 0 | 12 | 0 |
| Quadrant | Total seconds | Saturated seconds | Saturation percentage |
|---|---|---|---|
| A | 6201 | 32 | 0.516046% |
| B | 6201 | 38 | 0.612804% |
| C | 6200 | 63 | 1.016129% |
| D | 6201 | 472 | 7.611676% |
Noise dominated data is calculated using 1-second bins in cleaned event files. If a bin has >2000 counts, and if more than 50% of those come from <1% of pixels, then it is considered to be noise-dominated and hence unusable.
| Quadrant | # 1 sec bins | Bins with >0 counts | Bins with >2000 counts | High rate bins dominated by noise | Noise dominated (total time) | Noise dominated (detector-on time) | Marked lightcurve |
|---|---|---|---|---|---|---|---|
| A | 7391 | 6202 | 1 | 1 | 0.01% | 0.02% | 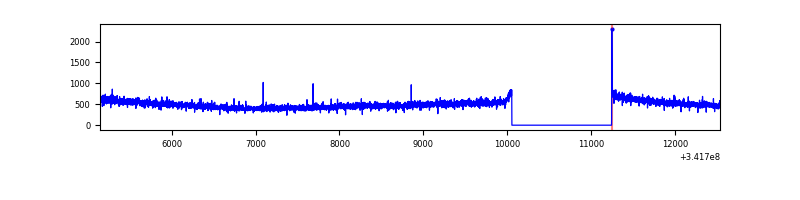 |
| B | 7391 | 6201 | 0 | 0 | 0.00% | 0.00% | 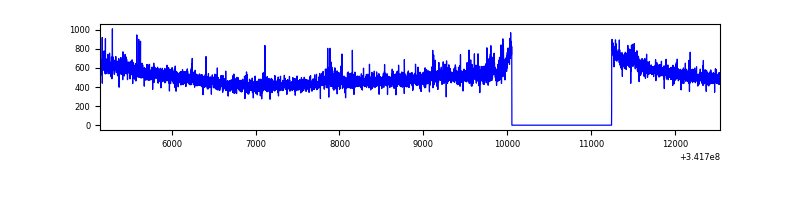 |
| C | 7390 | 6200 | 0 | 0 | 0.00% | 0.00% | 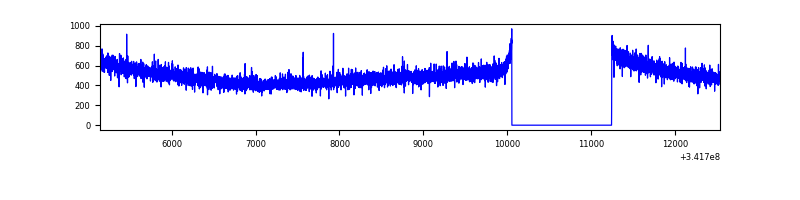 |
| D | 7391 | 6202 | 410 | 410 | 5.55% | 6.61% | 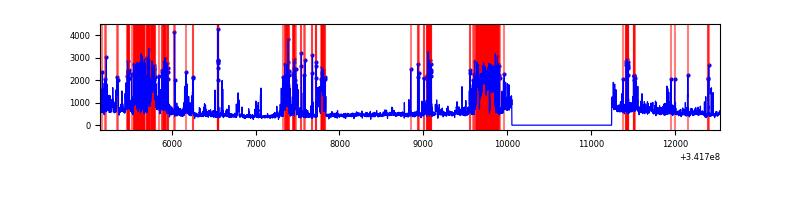 |
Top three noisy pixels from each quadrant. If the there are fewer than three noisy pixels in the level2.evt file, extra rows are filled as -1
| Pixel properties | Quadrant properties | ||||||
|---|---|---|---|---|---|---|---|
| Quadrant | DetID | PixID | Counts | Sigma | Mean | Median | Sigma |
| A | 13 | 254 | 10654 | 62.4 | 791 | 778 | 158.3 |
| A | 3 | 137 | 7431 | 42.03 | 791 | 778 | 158.3 |
| A | 8 | 192 | 7198 | 40.56 | 791 | 778 | 158.3 |
| B | 0 | 230 | 27082 | 175.29 | 792 | 772 | 150.1 |
| B | 3 | 64 | 20522 | 131.58 | 792 | 772 | 150.1 |
| B | 12 | 111 | 18100 | 115.45 | 792 | 772 | 150.1 |
| C | 14 | 238 | 123296 | 686.88 | 760 | 764 | 178.4 |
| C | 13 | 61 | 5259 | 25.19 | 760 | 764 | 178.4 |
| C | 4 | 224 | 4088 | 18.63 | 760 | 764 | 178.4 |
| D | 7 | 80 | 1275117 | 7247.1 | 733 | 713 | 175.9 |
| D | 1 | 52 | 681996 | 3874.22 | 733 | 713 | 175.9 |
| D | 2 | 250 | 35495 | 197.79 | 733 | 713 | 175.9 |
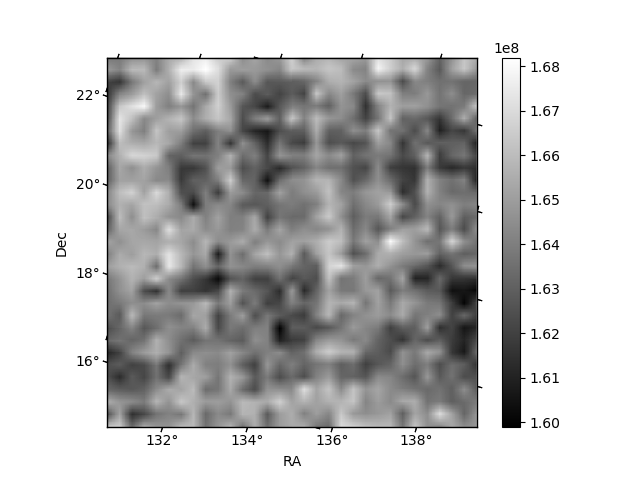
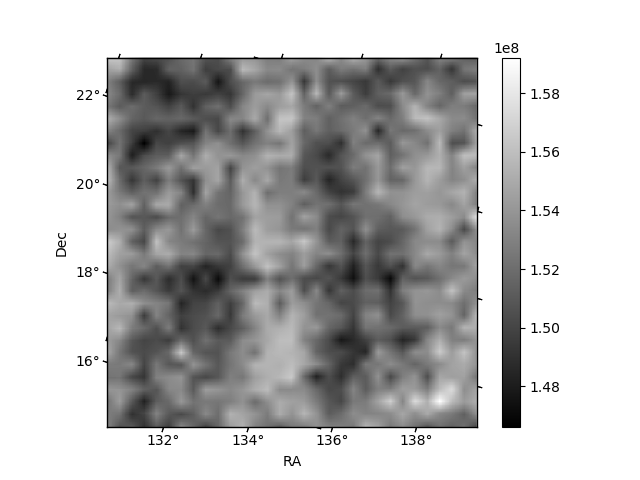
Histogram calculated using DETX and DETY for each event in the final _common_clean file
| Quadrant A | 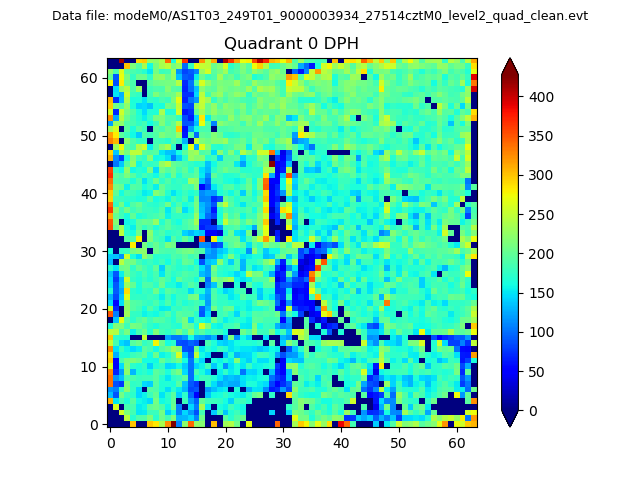 |
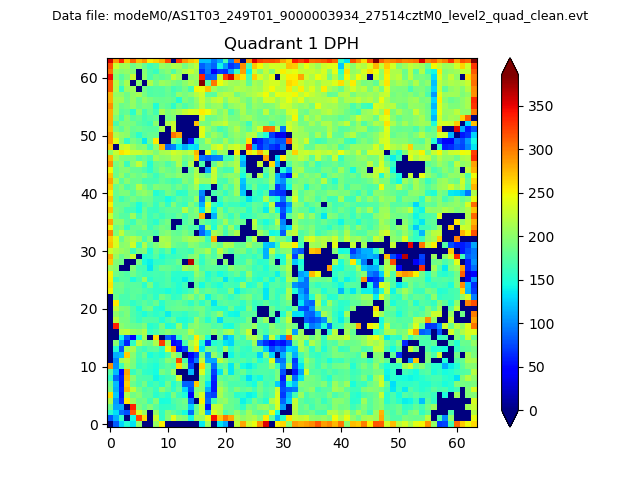 |
Quadrant B |
|---|---|---|---|
| Quadrant D | 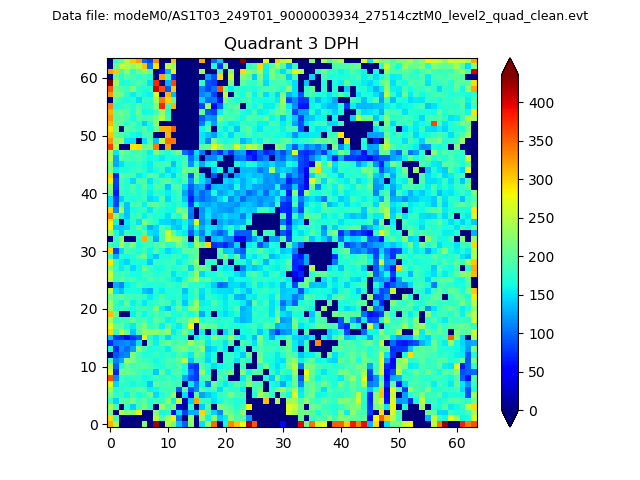 |
 |
Quadrant C |
| Plot type | Count rate plots | Images |
|---|---|---|
| Comparison with Poisson distribution Blue bars denote a histogram of data divided into 1 sec bins. Red curve is a Poisson curve with rate = median count rate of data. |
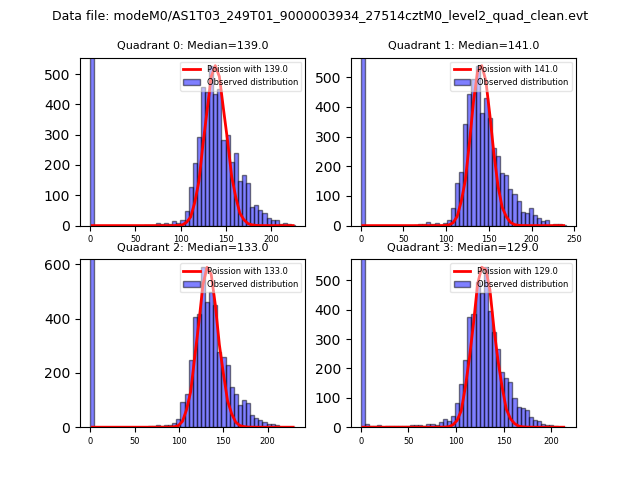 |
 |
| Quadrant-wise count rates Data is divided into 100 sec bins |
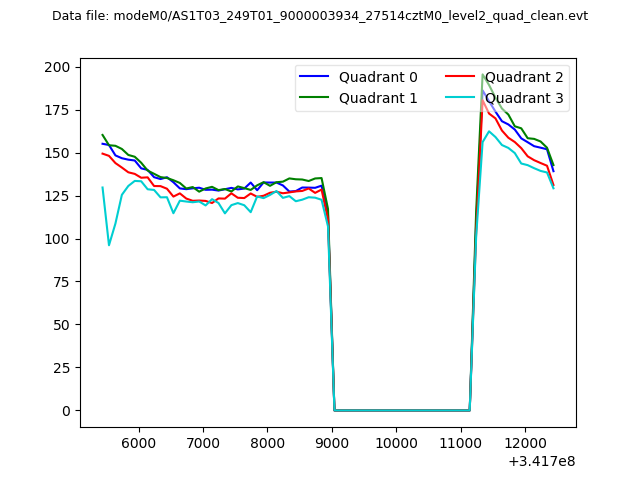 |
|
| Module-wise count rates for Quadrant A Data is divided into 100 sec bins |
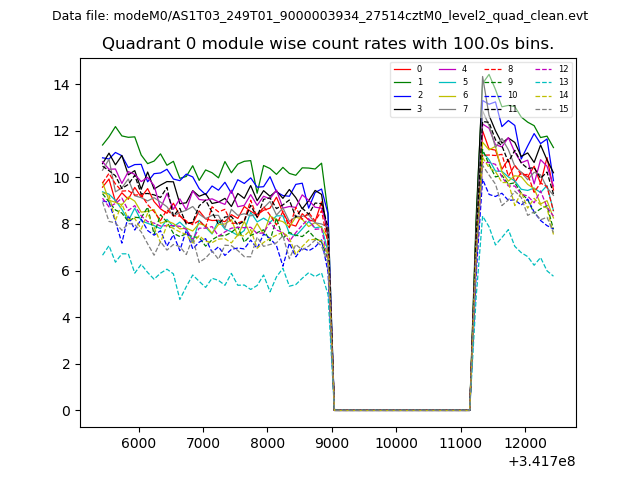 |
 |
| Module-wise count rates for Quadrant B Data is divided into 100 sec bins |
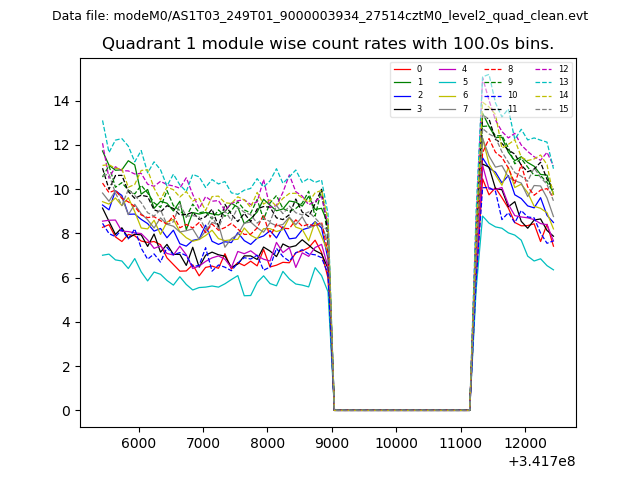 |
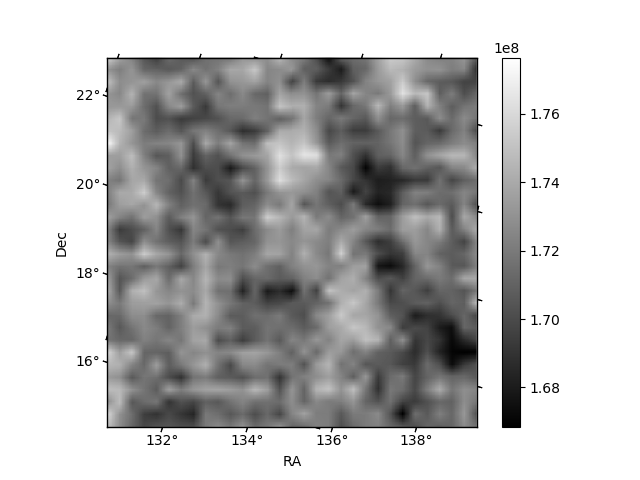 |
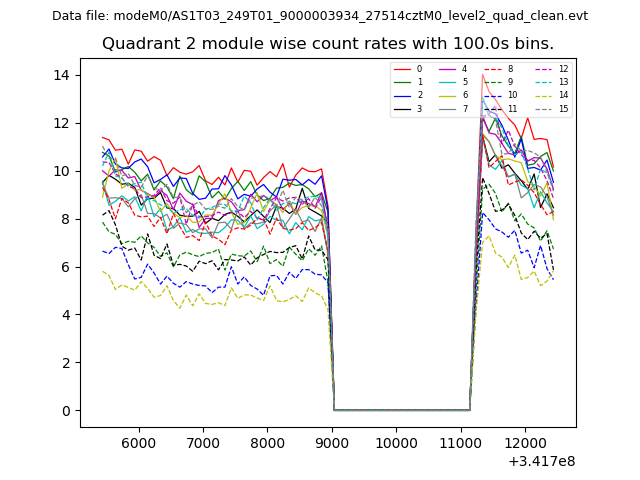
| Module-wise count rates for Quadrant C Data is divided into 100 sec bins |
 |
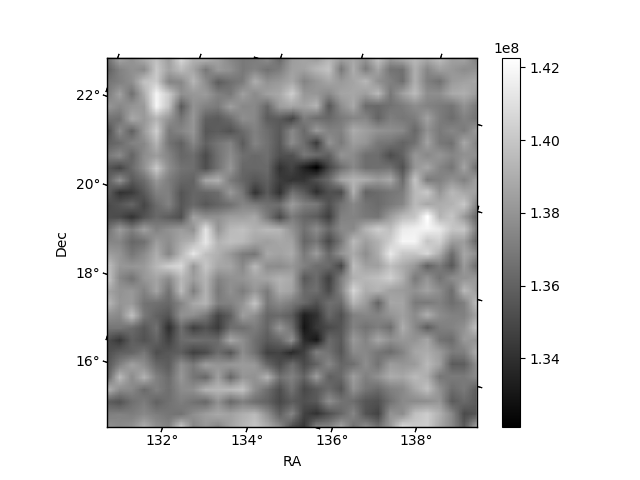 |
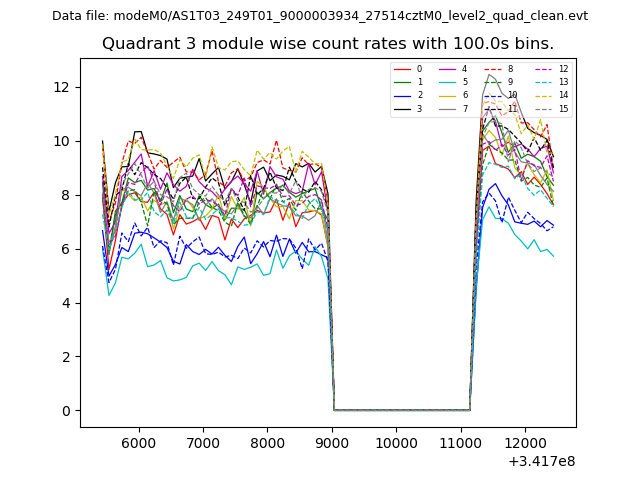
| Module-wise count rates for Quadrant D Data is divided into 100 sec bins |
 |
 |
| Parameter | Plot |
|---|---|
| CZT HV Monitor | 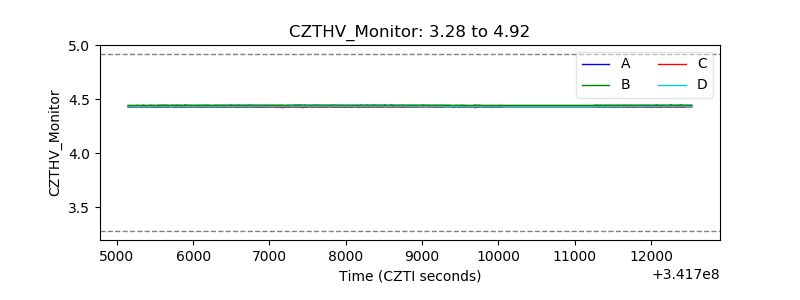 |
| D_VDD | 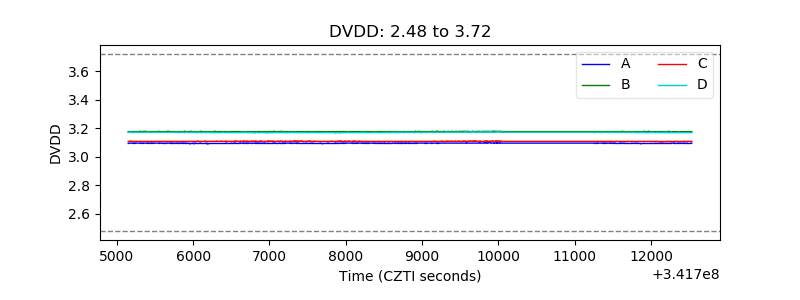 |
| Temperature 1 | 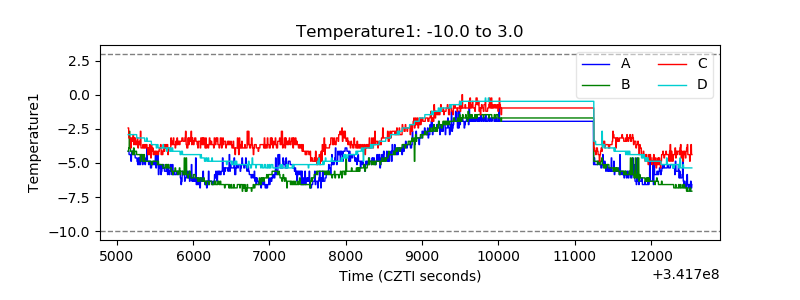 |
| Veto HV Monitor | 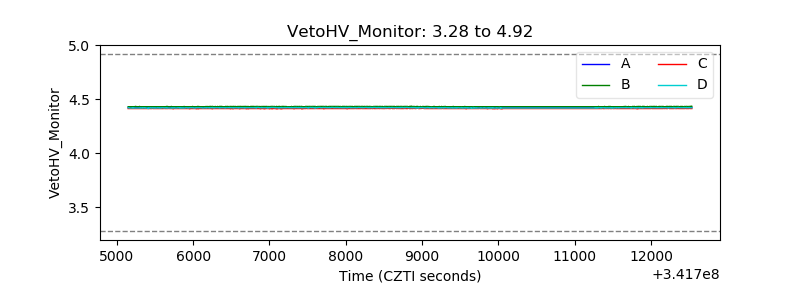 |
| Veto LLD | 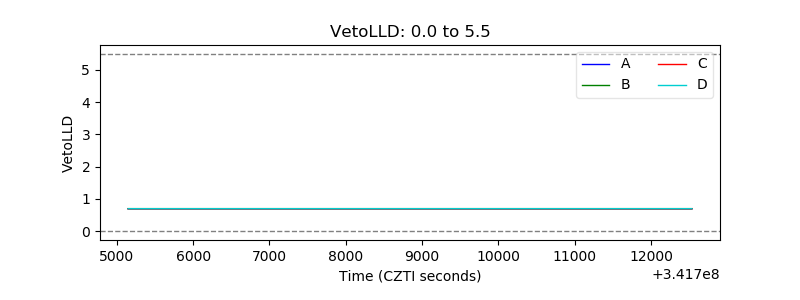 |
| Alpha Counter |  |
| _CPM_Rate | 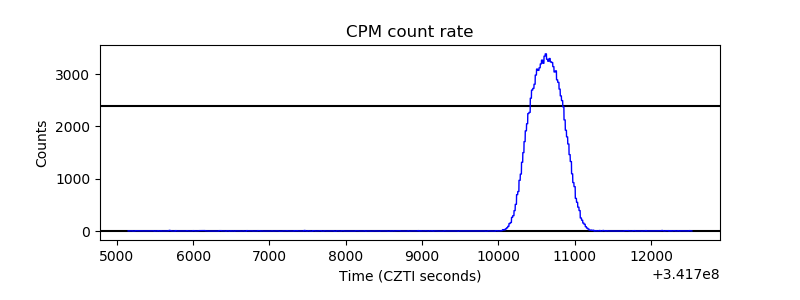 |
| CZT Counter |  |
| +2.5 Volts monitor |  |
| +5 Volts monitor | 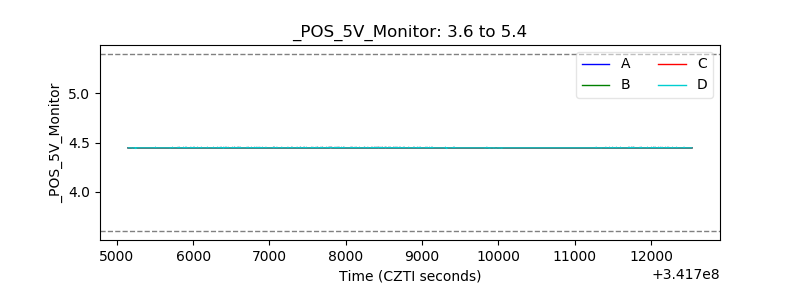 |
| _ROLL_ROT | 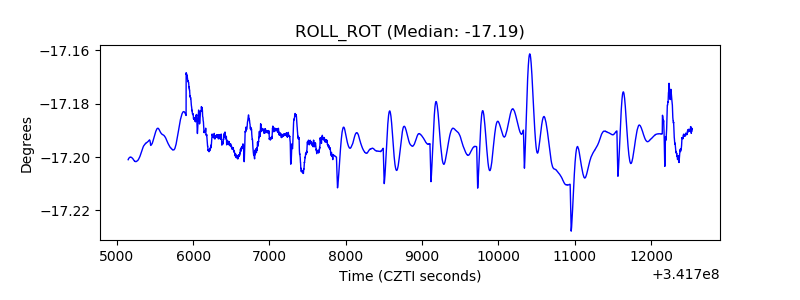 |
| _Roll_DEC | 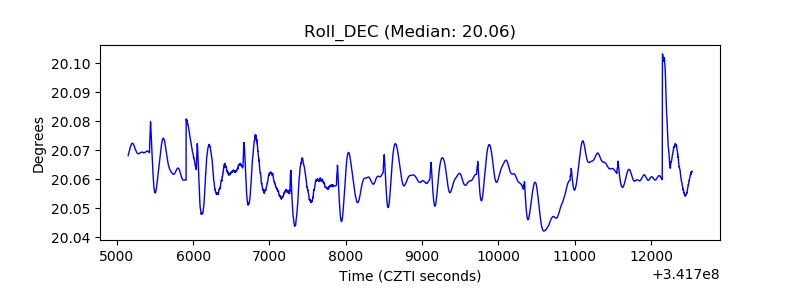 |
| _Roll_RA | 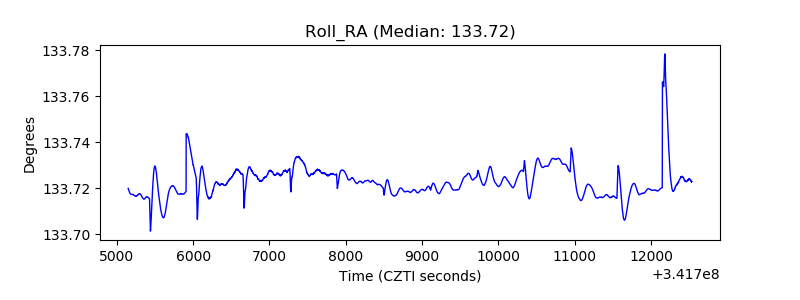 |
| Veto Counter | 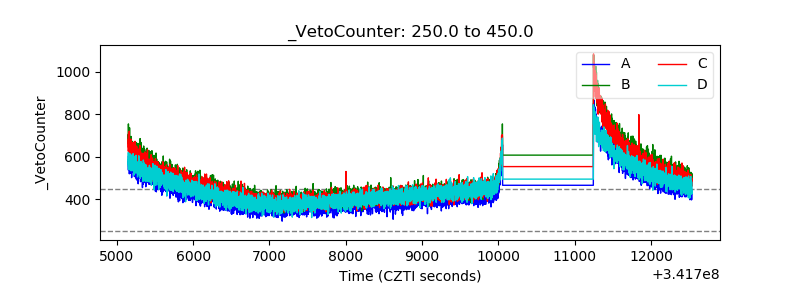 |