| Param | Original file | Final file |
|---|---|---|
| Filename | modeM0/AS1T03_249T01_9000003934_27518cztM0_level2.evt | modeM0/AS1T03_249T01_9000003934_27518cztM0_level2_quad_clean.evt |
| Size (bytes) | 424,869,120 | 84,441,600 |
| Size | 405.2 MB | 80.5 MB |
| Events in quadrant A | 3,033,464 | 546,113 |
| Events in quadrant B | 3,097,619 | 555,493 |
| Events in quadrant C | 3,012,001 | 523,710 |
| Events in quadrant D | 3,316,693 | 513,126 |
| Mode M0 | |||
|---|---|---|---|
| Quadrant | BADHDUFLAG | Total packets | Discarded packets |
| A | 0 | 12599 | 0 |
| B | 0 | 12768 | 0 |
| C | 0 | 12560 | 0 |
| D | 0 | 13696 | 0 |
| Mode M9 | |||
|---|---|---|---|
| Quadrant | BADHDUFLAG | Total packets | Discarded packets |
| A | 0 | 12 | 0 |
| B | 0 | 12 | 0 |
| C | 0 | 12 | 0 |
| D | 0 | 12 | 0 |
| Quadrant | Total seconds | Saturated seconds | Saturation percentage |
|---|---|---|---|
| A | 6000 | 63 | 1.050000% |
| B | 6000 | 94 | 1.566667% |
| C | 6000 | 113 | 1.883333% |
| D | 6000 | 81 | 1.350000% |
Noise dominated data is calculated using 1-second bins in cleaned event files. If a bin has >2000 counts, and if more than 50% of those come from <1% of pixels, then it is considered to be noise-dominated and hence unusable.
| Quadrant | # 1 sec bins | Bins with >0 counts | Bins with >2000 counts | High rate bins dominated by noise | Noise dominated (total time) | Noise dominated (detector-on time) | Marked lightcurve |
|---|---|---|---|---|---|---|---|
| A | 7185 | 6000 | 0 | 0 | 0.00% | 0.00% | 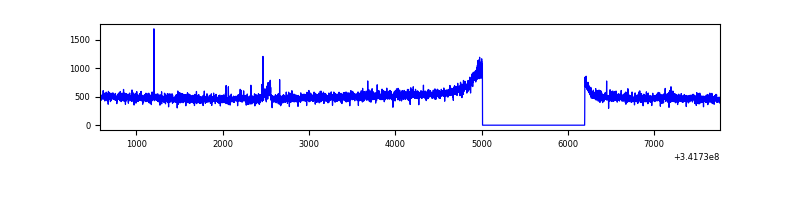 |
| B | 7185 | 6000 | 0 | 0 | 0.00% | 0.00% | 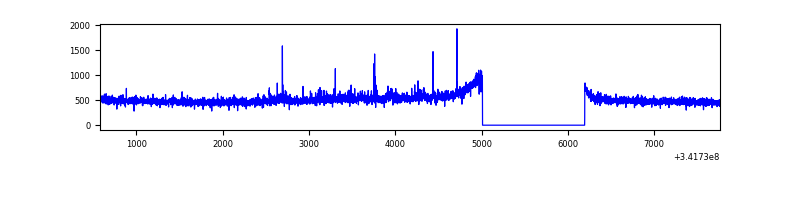 |
| C | 7185 | 6000 | 0 | 0 | 0.00% | 0.00% | 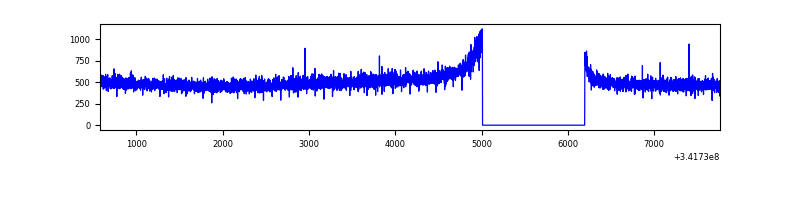 |
| D | 7185 | 6000 | 34 | 34 | 0.47% | 0.57% | 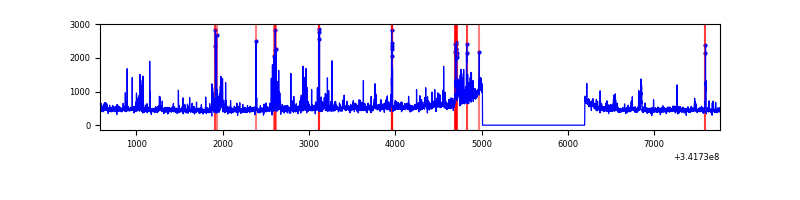 |
Top three noisy pixels from each quadrant. If the there are fewer than three noisy pixels in the level2.evt file, extra rows are filled as -1
| Pixel properties | Quadrant properties | ||||||
|---|---|---|---|---|---|---|---|
| Quadrant | DetID | PixID | Counts | Sigma | Mean | Median | Sigma |
| A | 6 | 16 | 17959 | 109.72 | 782 | 770 | 156.7 |
| A | 13 | 254 | 9421 | 55.22 | 782 | 770 | 156.7 |
| A | 3 | 137 | 7223 | 41.19 | 782 | 770 | 156.7 |
| B | 0 | 230 | 25816 | 170.12 | 772 | 753 | 147.3 |
| B | 12 | 111 | 17877 | 116.23 | 772 | 753 | 147.3 |
| B | 3 | 64 | 16410 | 106.27 | 772 | 753 | 147.3 |
| C | 14 | 238 | 119975 | 685.89 | 742 | 746 | 173.8 |
| C | 13 | 61 | 5073 | 24.89 | 742 | 746 | 173.8 |
| C | 4 | 224 | 1799 | 6.06 | 742 | 746 | 173.8 |
| D | 1 | 52 | 339052 | 1880.89 | 750 | 733 | 179.9 |
| D | 13 | 168 | 30589 | 165.99 | 750 | 733 | 179.9 |
| D | 7 | 69 | 27968 | 151.41 | 750 | 733 | 179.9 |
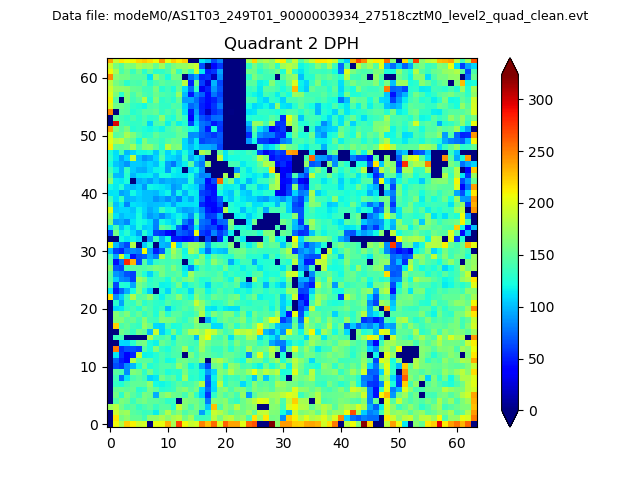
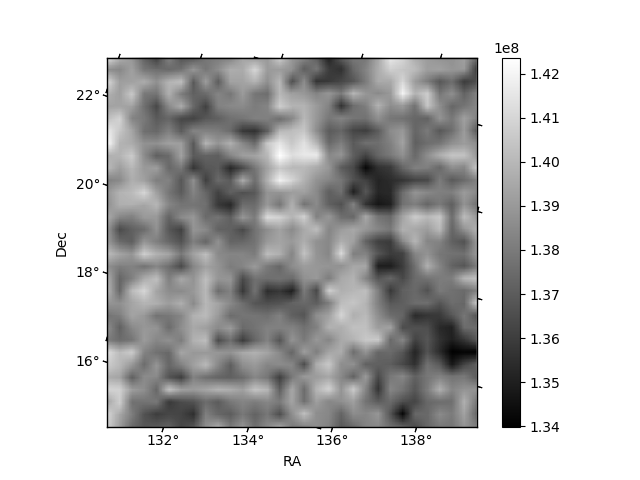
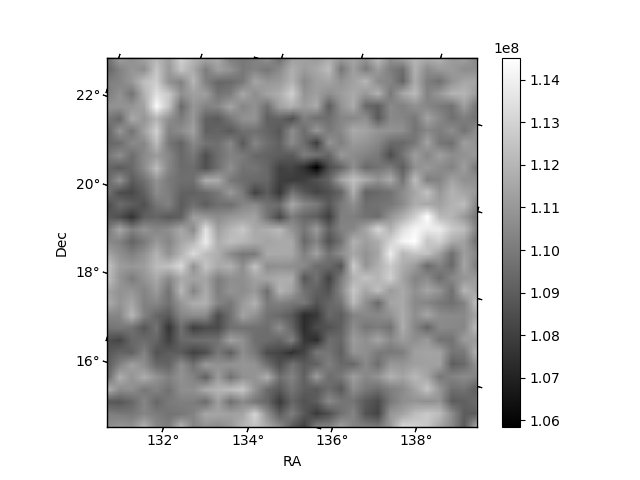
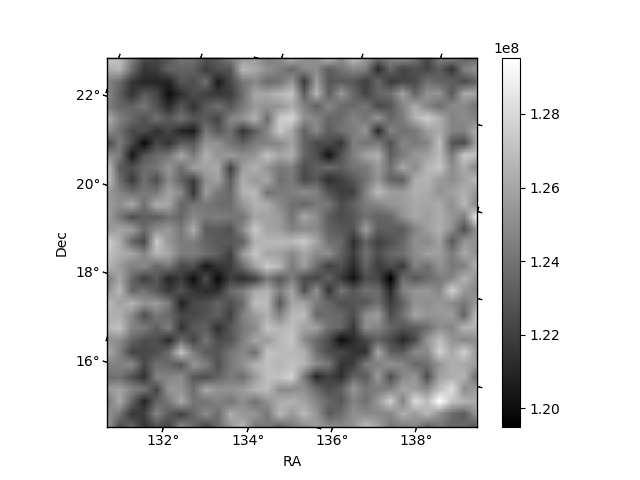
Histogram calculated using DETX and DETY for each event in the final _common_clean file
| Quadrant A | 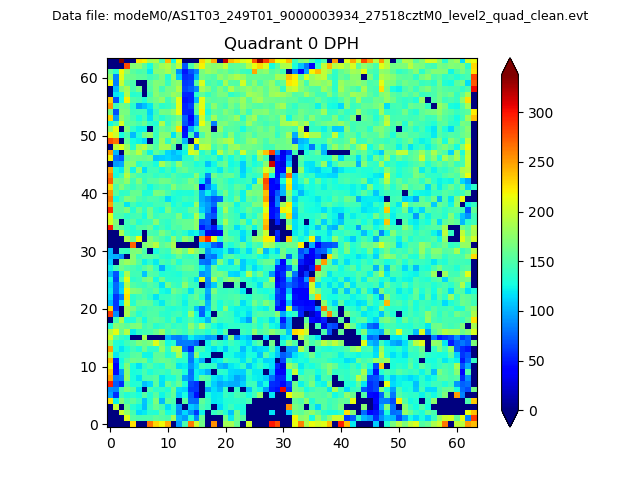 |
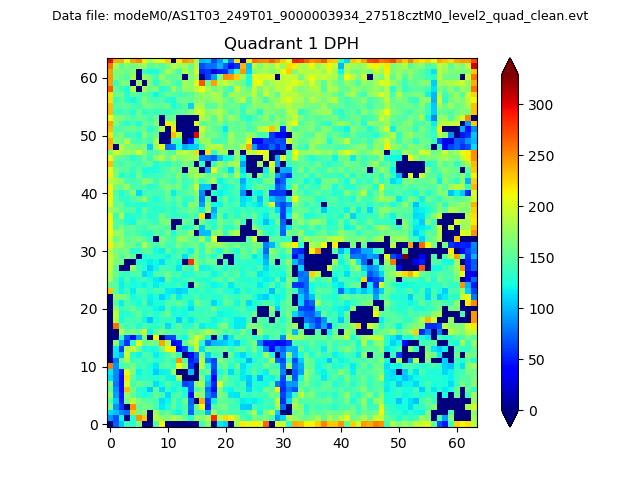 |
Quadrant B |
|---|---|---|---|
| Quadrant D | 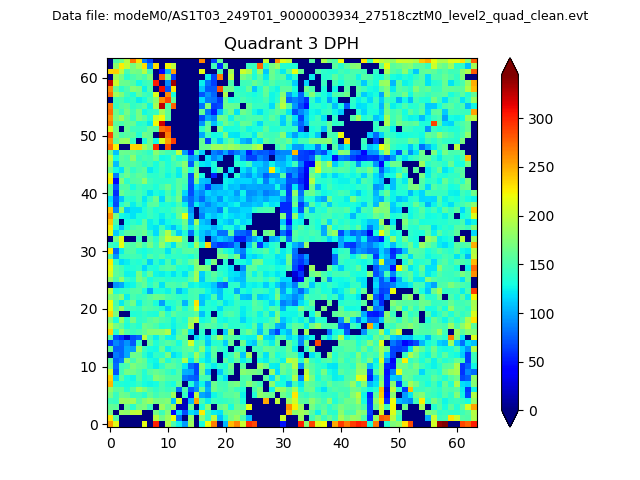 |
 |
Quadrant C |
| Plot type | Count rate plots | Images |
|---|---|---|
| Comparison with Poisson distribution Blue bars denote a histogram of data divided into 1 sec bins. Red curve is a Poisson curve with rate = median count rate of data. |
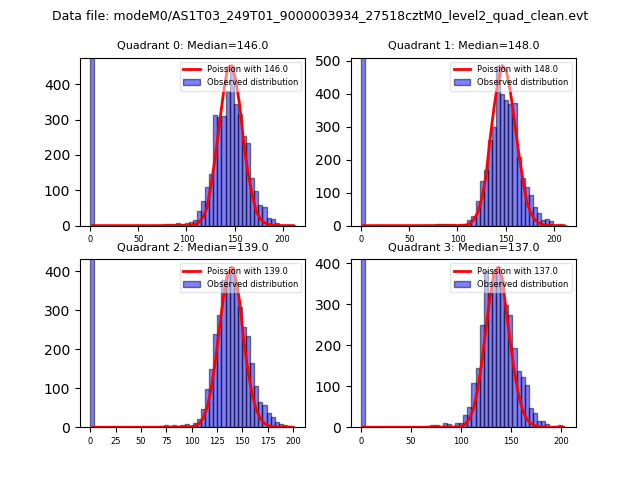 |
 |
| Quadrant-wise count rates Data is divided into 100 sec bins |
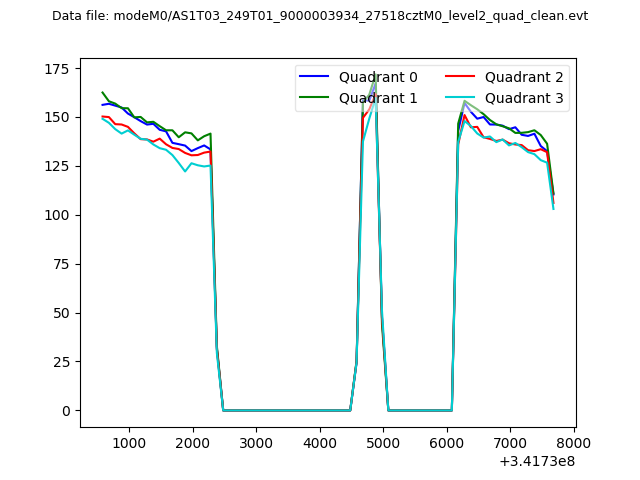 |
|
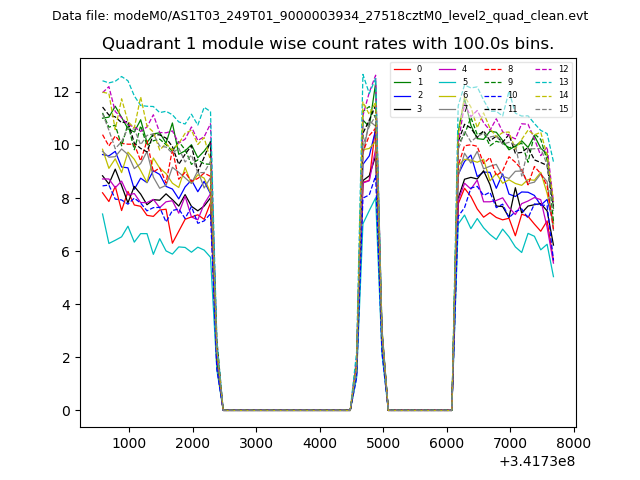
| Module-wise count rates for Quadrant A Data is divided into 100 sec bins |
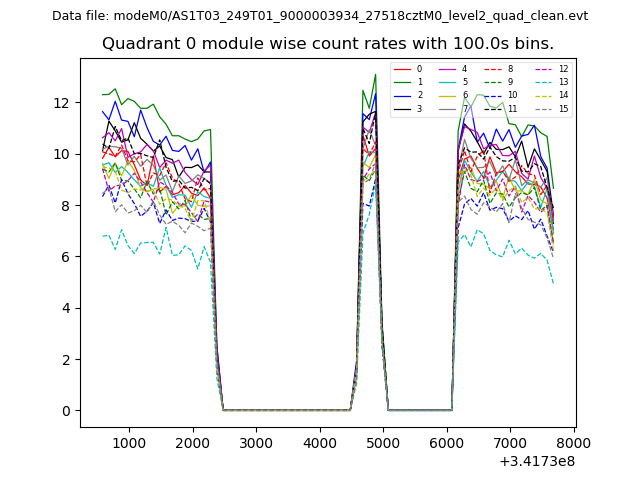 |
 |
| Module-wise count rates for Quadrant B Data is divided into 100 sec bins |
 |
 |
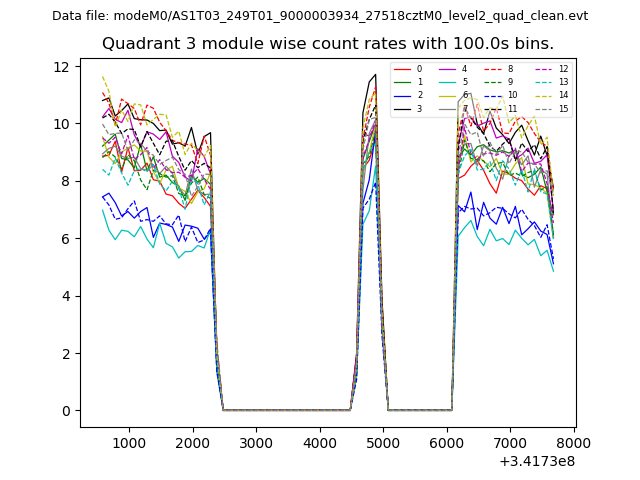
| Module-wise count rates for Quadrant C Data is divided into 100 sec bins |
 |
 |
| Module-wise count rates for Quadrant D Data is divided into 100 sec bins |
 |
 |
| Parameter | Plot |
|---|---|
| CZT HV Monitor | 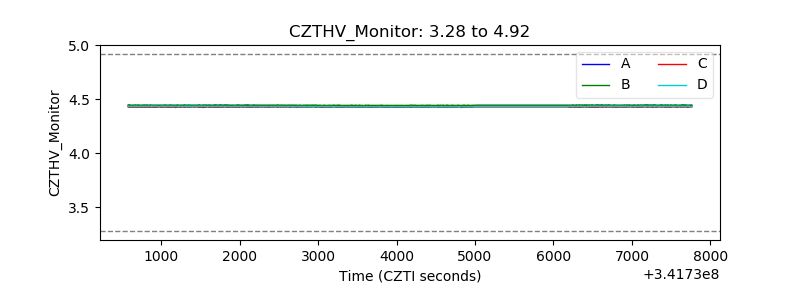 |
| D_VDD | 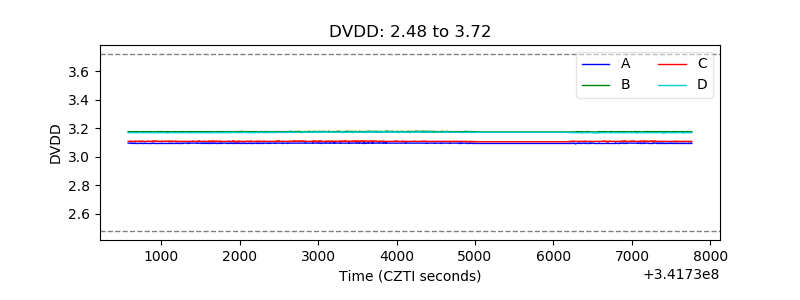 |
| Temperature 1 | 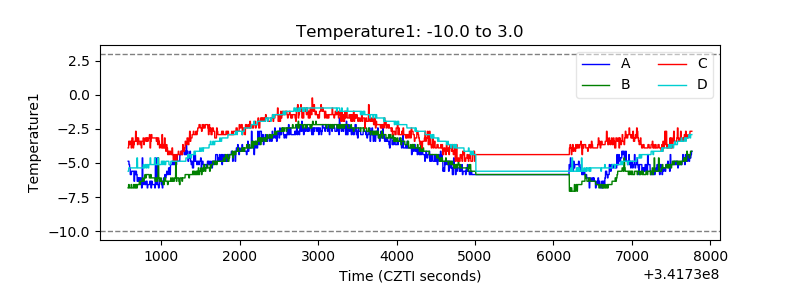 |
| Veto HV Monitor | 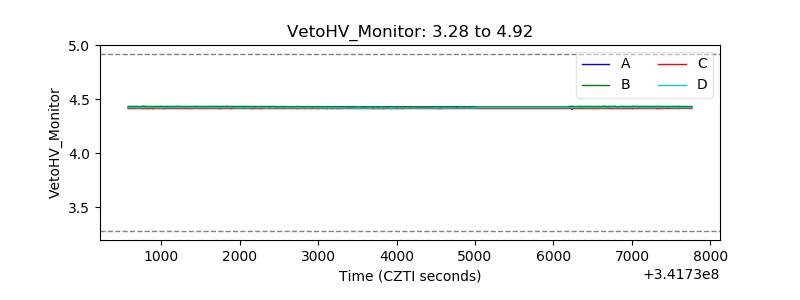 |
| Veto LLD | 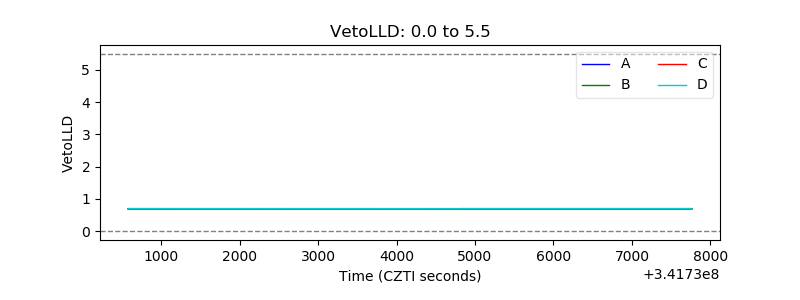 |
| Alpha Counter | 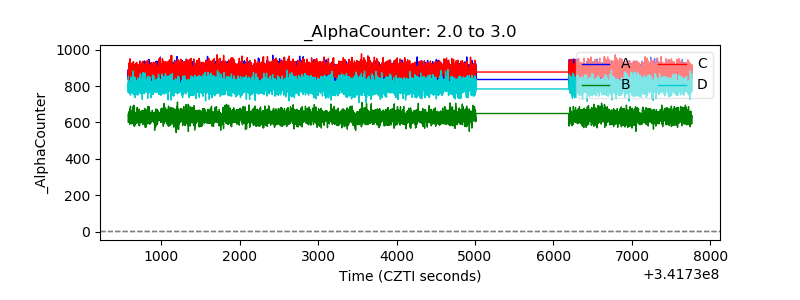 |
| _CPM_Rate | 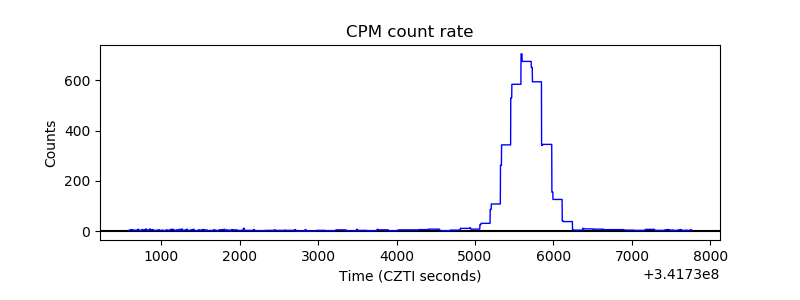 |
| CZT Counter |  |
| +2.5 Volts monitor |  |
| +5 Volts monitor |  |
| _ROLL_ROT | 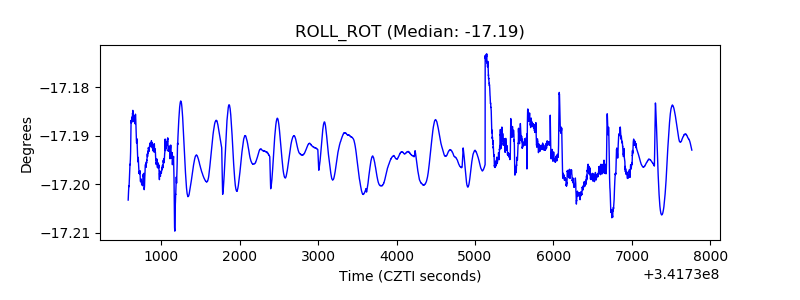 |
| _Roll_DEC | 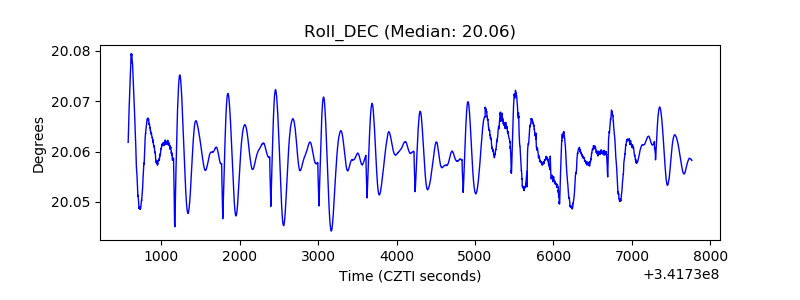 |
| _Roll_RA | 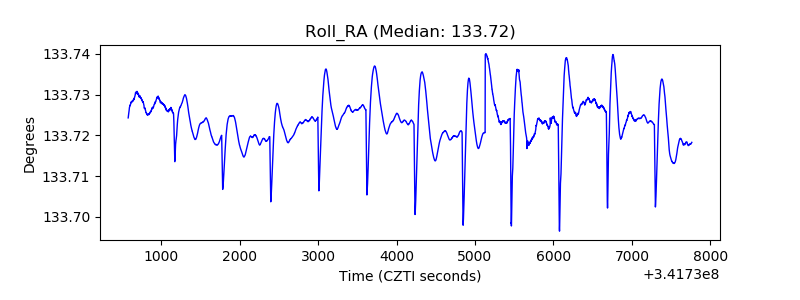 |
| Veto Counter | 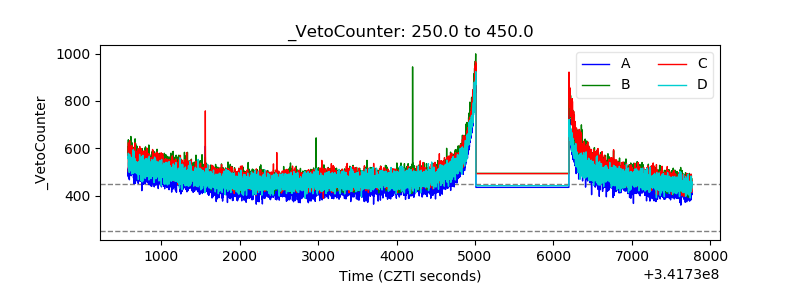 |