| Param | Original file | Final file |
|---|---|---|
| Filename | modeM0/AS1T03_249T01_9000003934_27519cztM0_level2.evt | modeM0/AS1T03_249T01_9000003934_27519cztM0_level2_quad_clean.evt |
| Size (bytes) | 430,263,360 | 83,393,280 |
| Size | 410.3 MB | 79.5 MB |
| Events in quadrant A | 2,993,912 | 534,973 |
| Events in quadrant B | 3,079,698 | 542,604 |
| Events in quadrant C | 3,023,064 | 514,639 |
| Events in quadrant D | 3,516,459 | 504,505 |
| Mode M0 | |||
|---|---|---|---|
| Quadrant | BADHDUFLAG | Total packets | Discarded packets |
| A | 0 | 12619 | 0 |
| B | 0 | 12847 | 0 |
| C | 0 | 12672 | 0 |
| D | 0 | 14333 | 0 |
| Mode M9 | |||
|---|---|---|---|
| Quadrant | BADHDUFLAG | Total packets | Discarded packets |
| A | 0 | 9 | 0 |
| B | 0 | 9 | 0 |
| C | 0 | 9 | 0 |
| D | 0 | 9 | 0 |
| Quadrant | Total seconds | Saturated seconds | Saturation percentage |
|---|---|---|---|
| A | 6137 | 57 | 0.928793% |
| B | 6137 | 60 | 0.977676% |
| C | 6137 | 77 | 1.254685% |
| D | 6137 | 75 | 1.222095% |
Noise dominated data is calculated using 1-second bins in cleaned event files. If a bin has >2000 counts, and if more than 50% of those come from <1% of pixels, then it is considered to be noise-dominated and hence unusable.
| Quadrant | # 1 sec bins | Bins with >0 counts | Bins with >2000 counts | High rate bins dominated by noise | Noise dominated (total time) | Noise dominated (detector-on time) | Marked lightcurve |
|---|---|---|---|---|---|---|---|
| A | 7042 | 6137 | 1 | 1 | 0.01% | 0.02% | 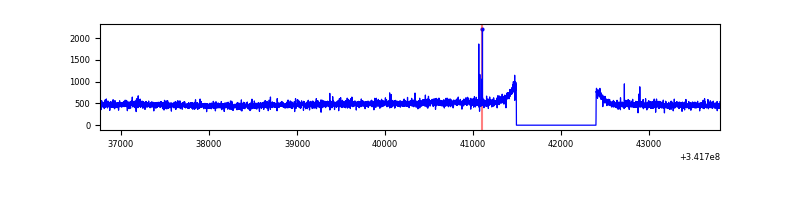 |
| B | 7042 | 6137 | 0 | 0 | 0.00% | 0.00% | 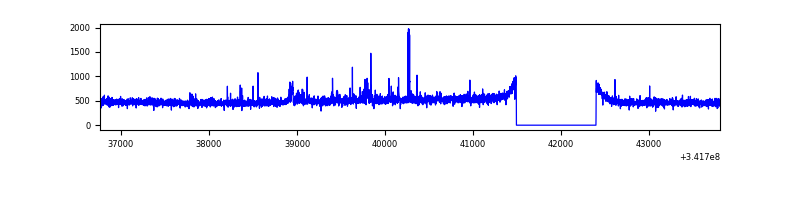 |
| C | 7042 | 6137 | 0 | 0 | 0.00% | 0.00% | 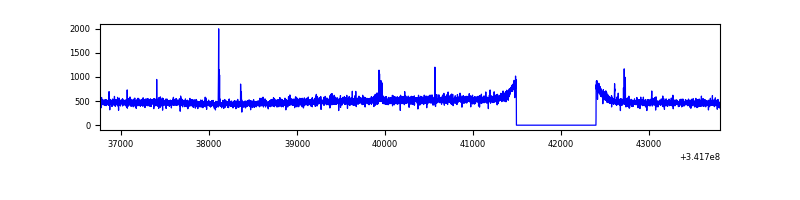 |
| D | 7042 | 6138 | 36 | 36 | 0.51% | 0.59% | 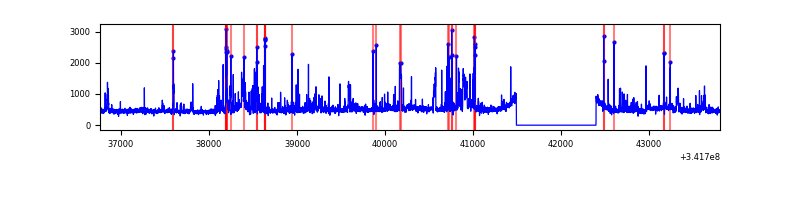 |
Top three noisy pixels from each quadrant. If the there are fewer than three noisy pixels in the level2.evt file, extra rows are filled as -1
| Pixel properties | Quadrant properties | ||||||
|---|---|---|---|---|---|---|---|
| Quadrant | DetID | PixID | Counts | Sigma | Mean | Median | Sigma |
| A | 13 | 254 | 9757 | 57.22 | 775 | 759 | 157.2 |
| A | 3 | 137 | 7230 | 41.15 | 775 | 759 | 157.2 |
| A | 0 | 226 | 6616 | 37.25 | 775 | 759 | 157.2 |
| B | 15 | 32 | 40365 | 265.55 | 765 | 744 | 149.2 |
| B | 0 | 230 | 26747 | 174.28 | 765 | 744 | 149.2 |
| B | 4 | 200 | 18603 | 119.69 | 765 | 744 | 149.2 |
| C | 14 | 238 | 117516 | 670.79 | 737 | 741 | 174.1 |
| C | 2 | 16 | 31849 | 178.69 | 737 | 741 | 174.1 |
| C | 13 | 61 | 5127 | 25.19 | 737 | 741 | 174.1 |
| D | 1 | 52 | 458530 | 2542.58 | 746 | 724 | 180.1 |
| D | 7 | 80 | 86242 | 474.95 | 746 | 724 | 180.1 |
| D | 2 | 250 | 74163 | 407.87 | 746 | 724 | 180.1 |
Histogram calculated using DETX and DETY for each event in the final _common_clean file
| Quadrant A | 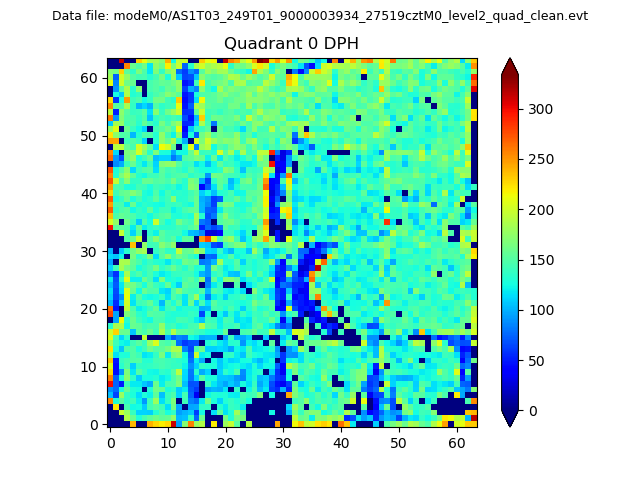 |
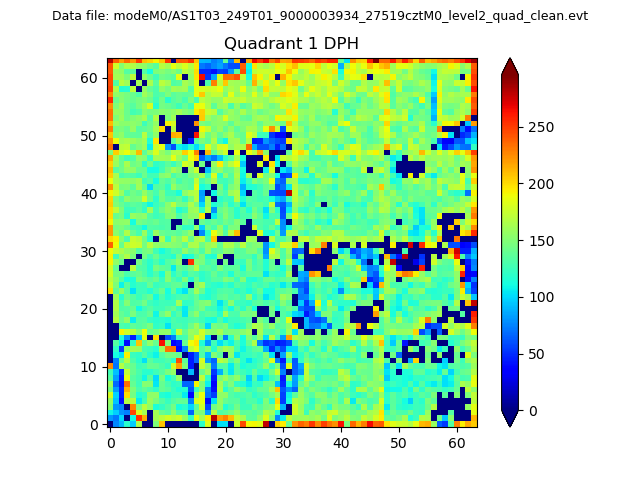 |
Quadrant B |
|---|---|---|---|
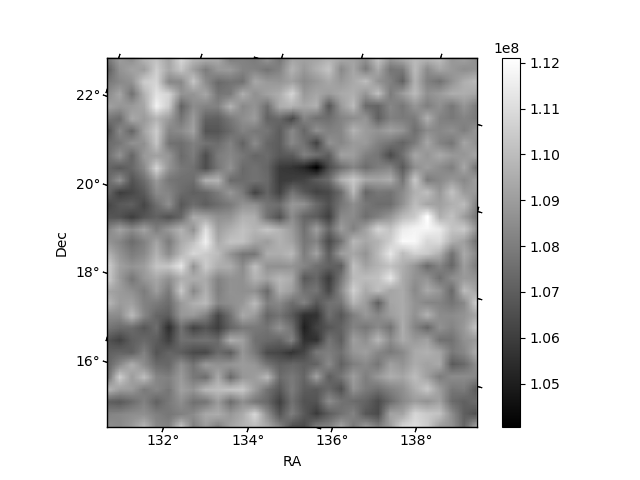
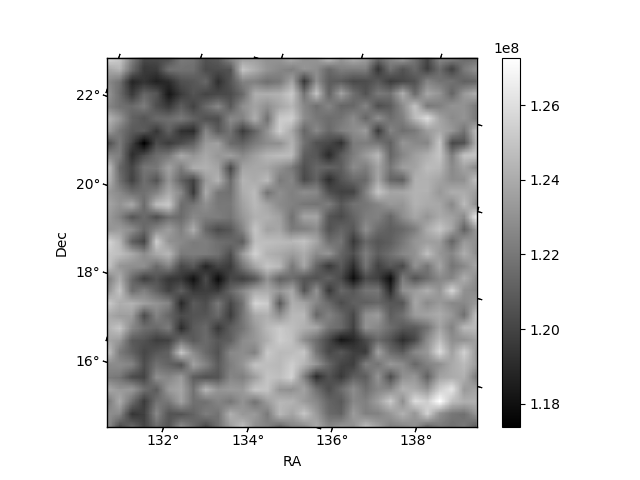
| Quadrant D | 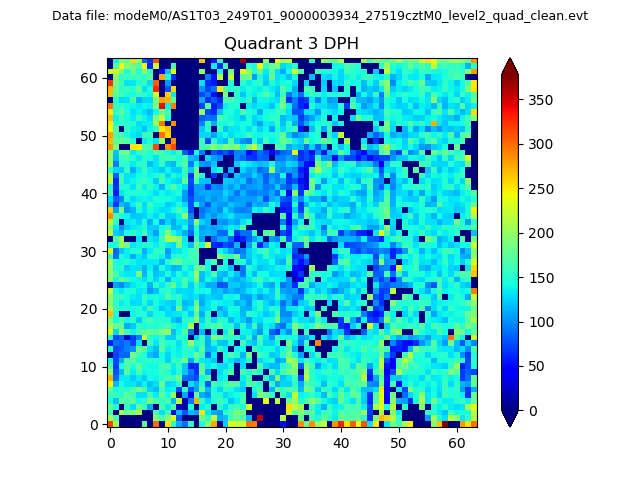 |
 |
Quadrant C |
| Plot type | Count rate plots | Images |
|---|---|---|
| Comparison with Poisson distribution Blue bars denote a histogram of data divided into 1 sec bins. Red curve is a Poisson curve with rate = median count rate of data. |
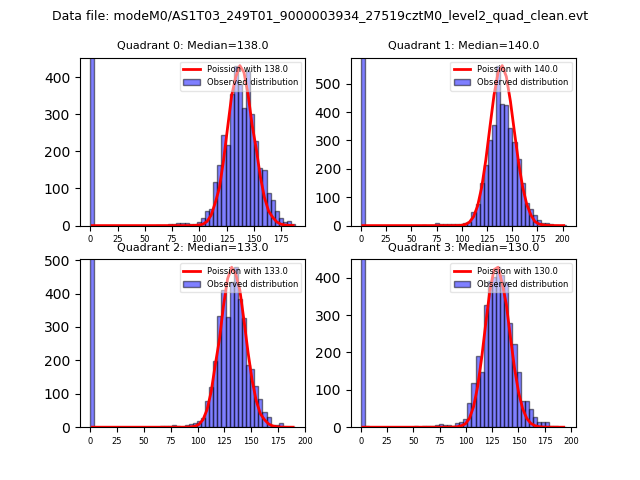 |
 |
| Quadrant-wise count rates Data is divided into 100 sec bins |
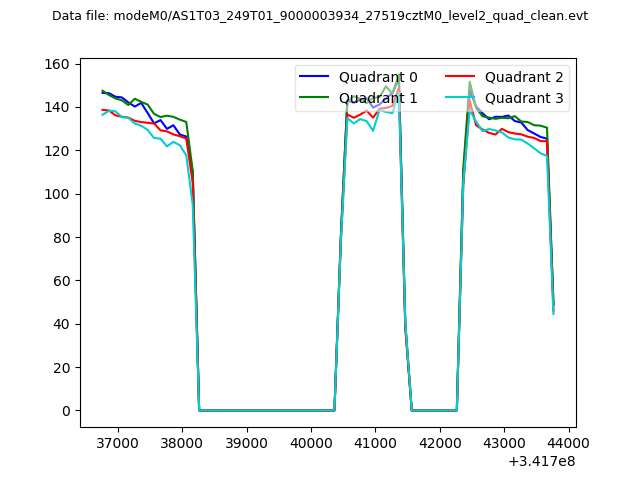 |
|
| Module-wise count rates for Quadrant A Data is divided into 100 sec bins |
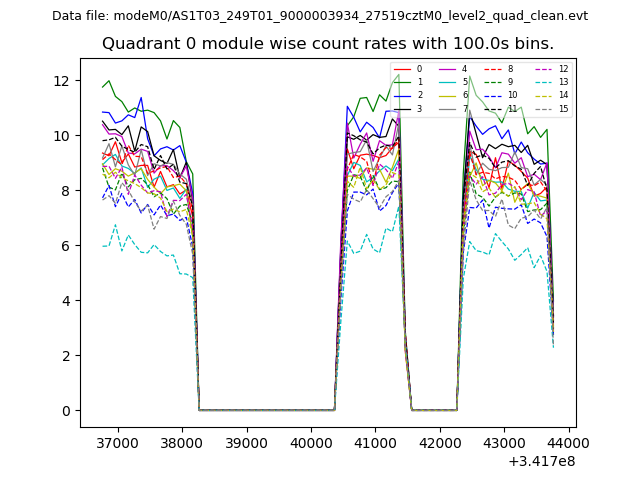 |
 |
| Module-wise count rates for Quadrant B Data is divided into 100 sec bins |
 |
 |
| Module-wise count rates for Quadrant C Data is divided into 100 sec bins |
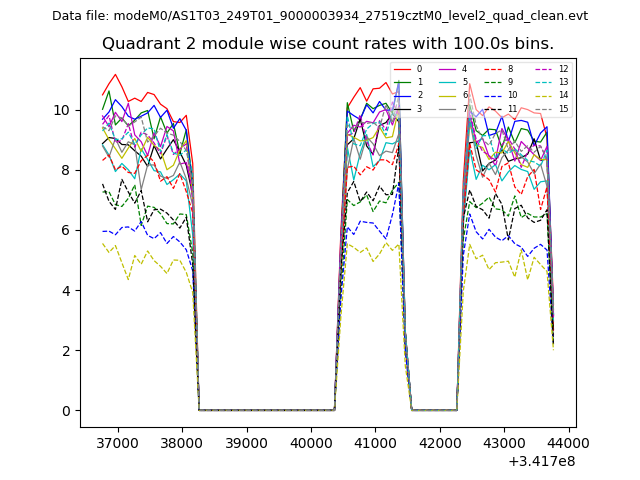 |
 |
| Module-wise count rates for Quadrant D Data is divided into 100 sec bins |
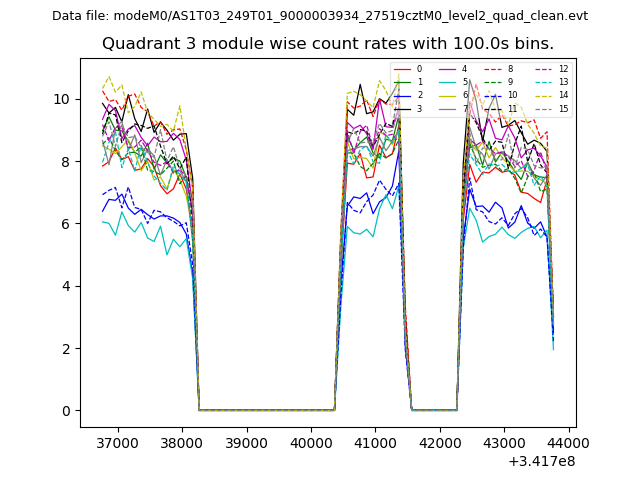 |
 |
| Parameter | Plot |
|---|---|
| CZT HV Monitor | 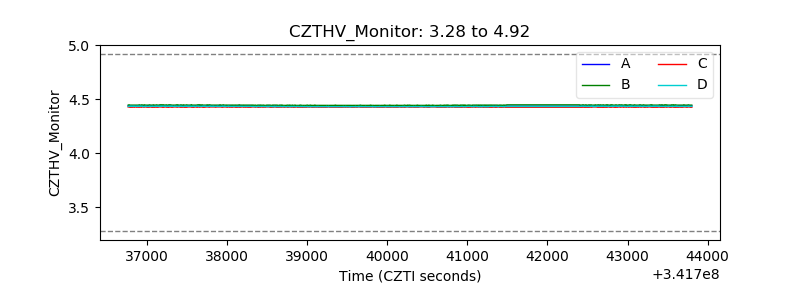 |
| D_VDD | 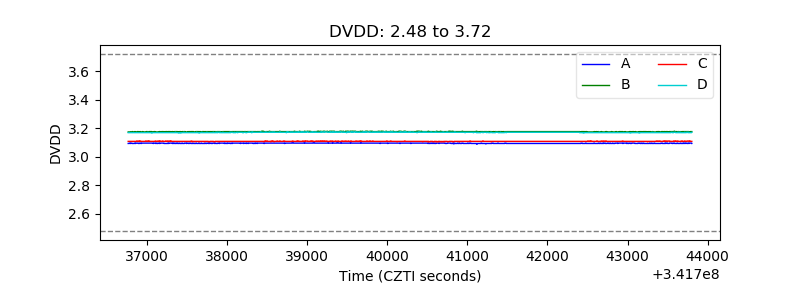 |
| Temperature 1 | 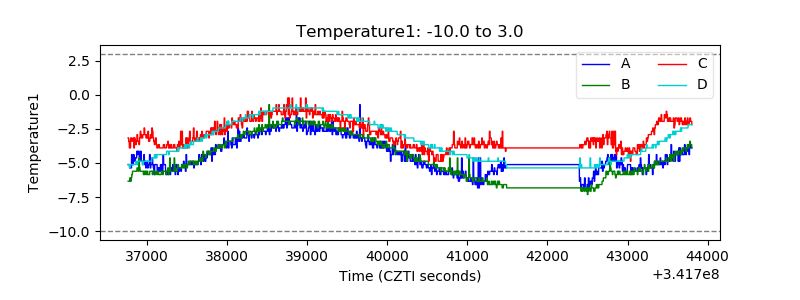 |
| Veto HV Monitor | 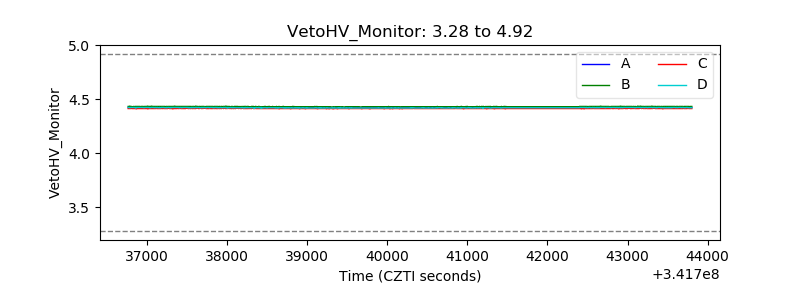 |
| Veto LLD | 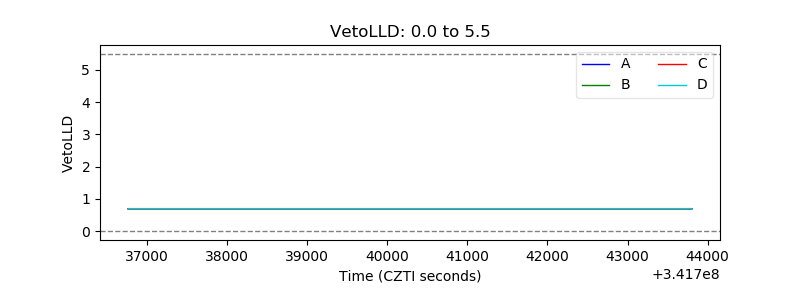 |
| Alpha Counter |  |
| _CPM_Rate | 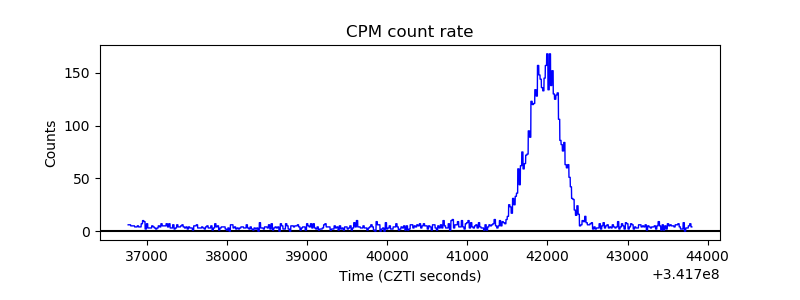 |
| CZT Counter |  |
| +2.5 Volts monitor | 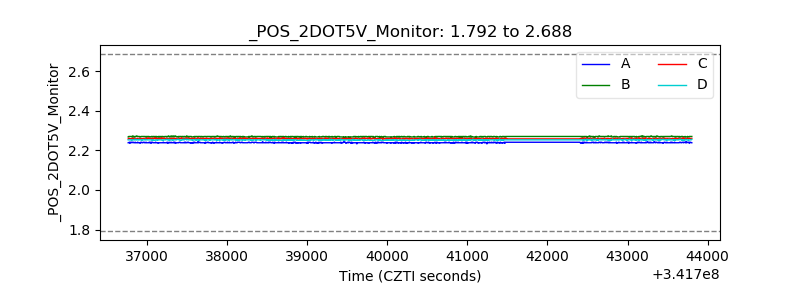 |
| +5 Volts monitor |  |
| _ROLL_ROT | 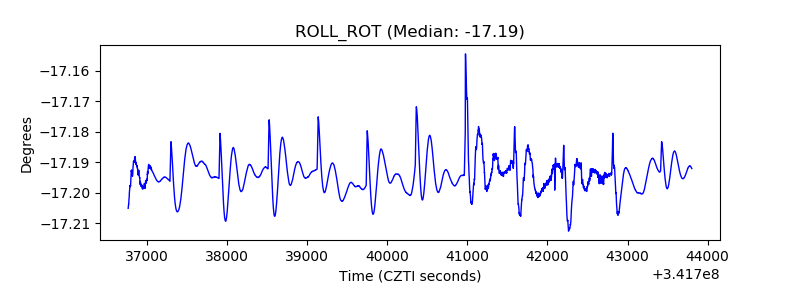 |
| _Roll_DEC | 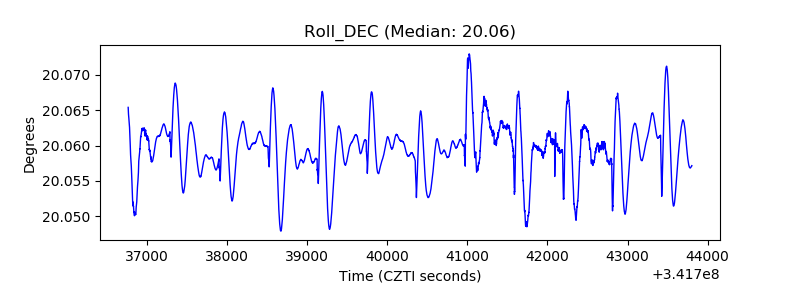 |
| _Roll_RA | 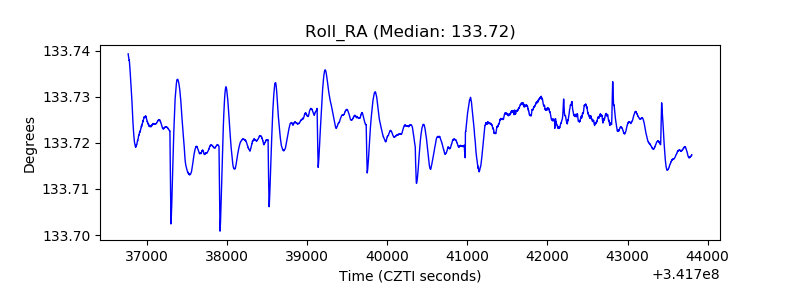 |
| Veto Counter | 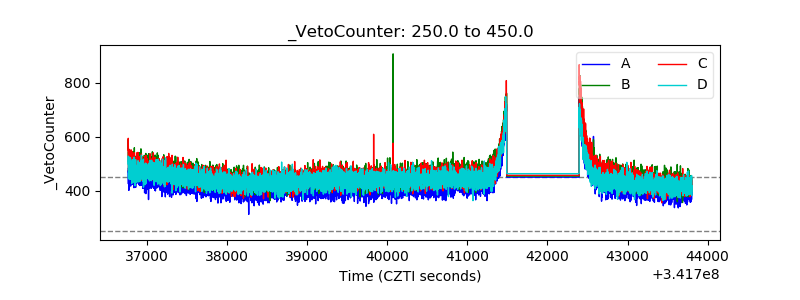 |