| Param | Original file | Final file |
|---|---|---|
| Filename | modeM0/AS1T03_249T01_9000003934_27520cztM0_level2.evt | modeM0/AS1T03_249T01_9000003934_27520cztM0_level2_quad_clean.evt |
| Size (bytes) | 485,274,240 | 86,725,440 |
| Size | 462.8 MB | 82.7 MB |
| Events in quadrant A | 3,181,466 | 552,016 |
| Events in quadrant B | 3,240,206 | 559,703 |
| Events in quadrant C | 3,198,185 | 530,829 |
| Events in quadrant D | 4,625,228 | 519,988 |
| Mode M0 | |||
|---|---|---|---|
| Quadrant | BADHDUFLAG | Total packets | Discarded packets |
| A | 0 | 13612 | 0 |
| B | 0 | 13679 | 0 |
| C | 0 | 13603 | 0 |
| D | 0 | 18162 | 0 |
| Mode M9 | |||
|---|---|---|---|
| Quadrant | BADHDUFLAG | Total packets | Discarded packets |
| A | 0 | 5 | 0 |
| B | 0 | 5 | 0 |
| C | 0 | 5 | 0 |
| D | 0 | 5 | 0 |
| Quadrant | Total seconds | Saturated seconds | Saturation percentage |
|---|---|---|---|
| A | 6654 | 69 | 1.036970% |
| B | 6654 | 74 | 1.112113% |
| C | 6654 | 89 | 1.337541% |
| D | 6654 | 172 | 2.584911% |
Noise dominated data is calculated using 1-second bins in cleaned event files. If a bin has >2000 counts, and if more than 50% of those come from <1% of pixels, then it is considered to be noise-dominated and hence unusable.
| Quadrant | # 1 sec bins | Bins with >0 counts | Bins with >2000 counts | High rate bins dominated by noise | Noise dominated (total time) | Noise dominated (detector-on time) | Marked lightcurve |
|---|---|---|---|---|---|---|---|
| A | 7139 | 6654 | 0 | 0 | 0.00% | 0.00% | 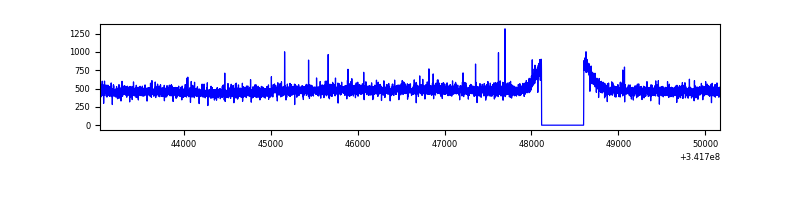 |
| B | 7139 | 6654 | 4 | 4 | 0.06% | 0.06% | 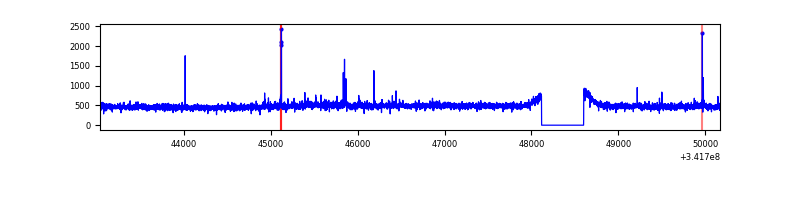 |
| C | 7139 | 6655 | 0 | 0 | 0.00% | 0.00% |  |
| D | 7139 | 6654 | 123 | 123 | 1.72% | 1.85% | 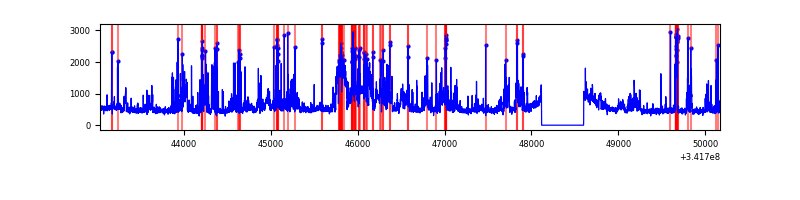 |
Top three noisy pixels from each quadrant. If the there are fewer than three noisy pixels in the level2.evt file, extra rows are filled as -1
| Pixel properties | Quadrant properties | ||||||
|---|---|---|---|---|---|---|---|
| Quadrant | DetID | PixID | Counts | Sigma | Mean | Median | Sigma |
| A | 13 | 254 | 10713 | 59.65 | 824 | 807 | 166.1 |
| A | 3 | 137 | 7942 | 42.97 | 824 | 807 | 166.1 |
| A | 0 | 226 | 7140 | 38.14 | 824 | 807 | 166.1 |
| B | 12 | 111 | 19538 | 118.97 | 811 | 791 | 157.6 |
| B | 0 | 230 | 18115 | 109.94 | 811 | 791 | 157.6 |
| B | 15 | 32 | 17481 | 105.91 | 811 | 791 | 157.6 |
| C | 14 | 238 | 124537 | 668.54 | 784 | 788 | 185.1 |
| C | 2 | 16 | 18305 | 94.63 | 784 | 788 | 185.1 |
| C | 13 | 61 | 5347 | 24.63 | 784 | 788 | 185.1 |
| D | 1 | 52 | 1334316 | 6994.8 | 789 | 766 | 190.6 |
| D | 11 | 176 | 92856 | 483.03 | 789 | 766 | 190.6 |
| D | 7 | 80 | 83030 | 431.49 | 789 | 766 | 190.6 |
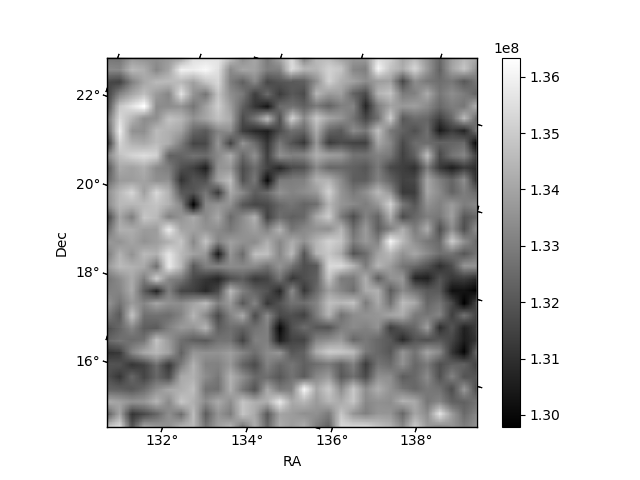
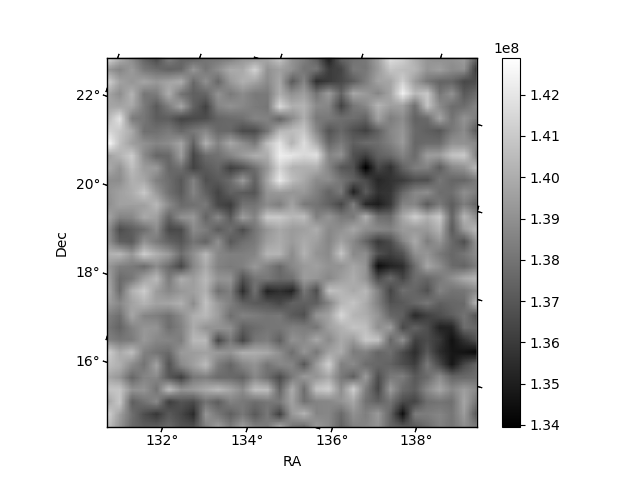
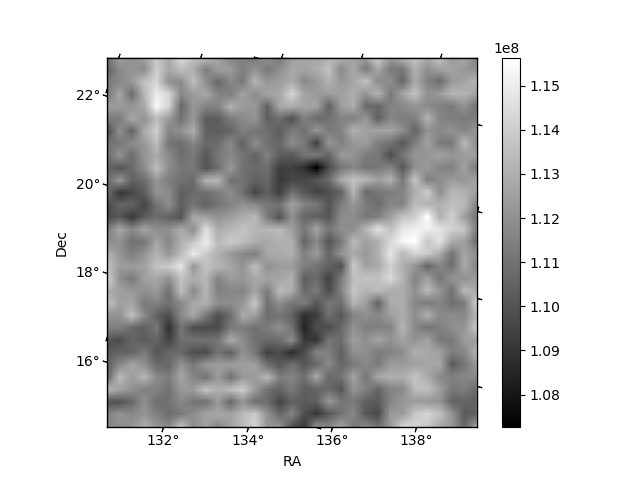
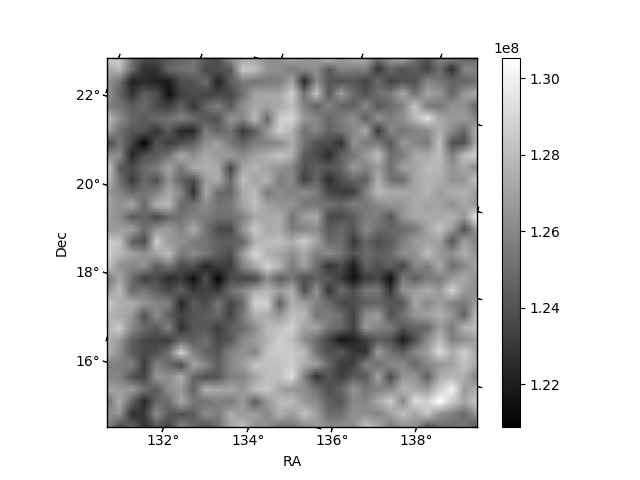
Histogram calculated using DETX and DETY for each event in the final _common_clean file
| Quadrant A | 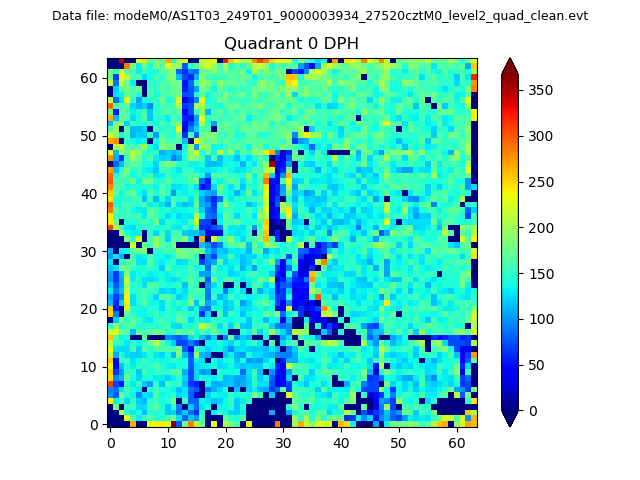 |
 |
Quadrant B |
|---|---|---|---|
| Quadrant D | 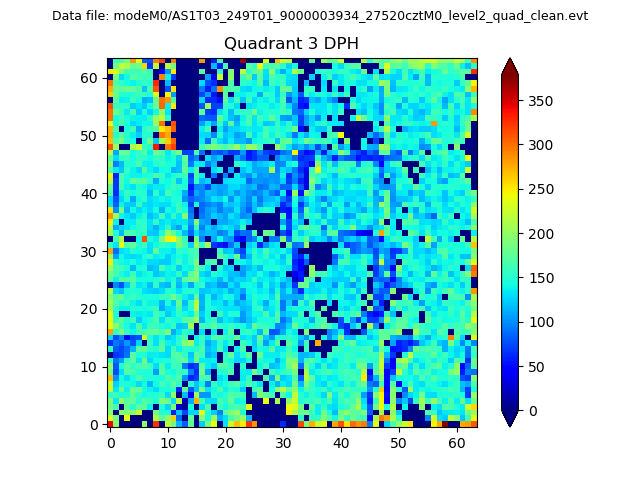 |
 |
Quadrant C |
| Plot type | Count rate plots | Images |
|---|---|---|
| Comparison with Poisson distribution Blue bars denote a histogram of data divided into 1 sec bins. Red curve is a Poisson curve with rate = median count rate of data. |
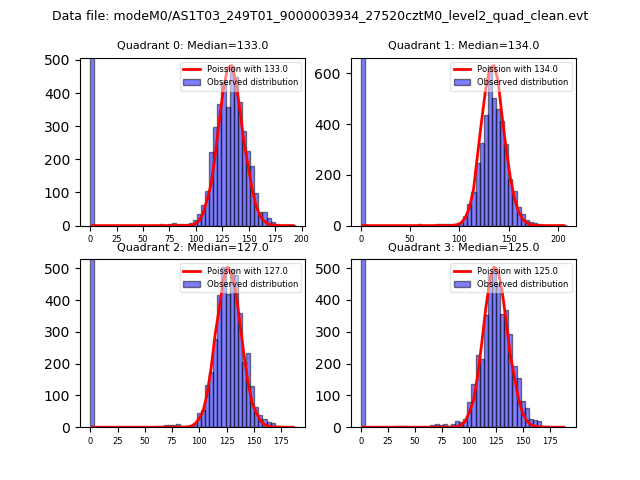 |
 |
| Quadrant-wise count rates Data is divided into 100 sec bins |
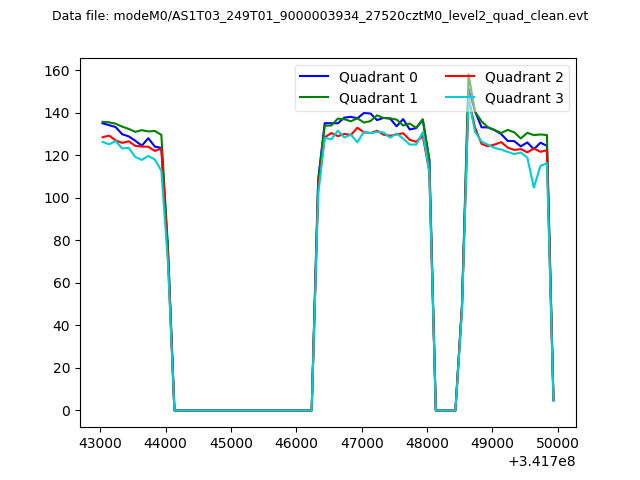 |
|
| Module-wise count rates for Quadrant A Data is divided into 100 sec bins |
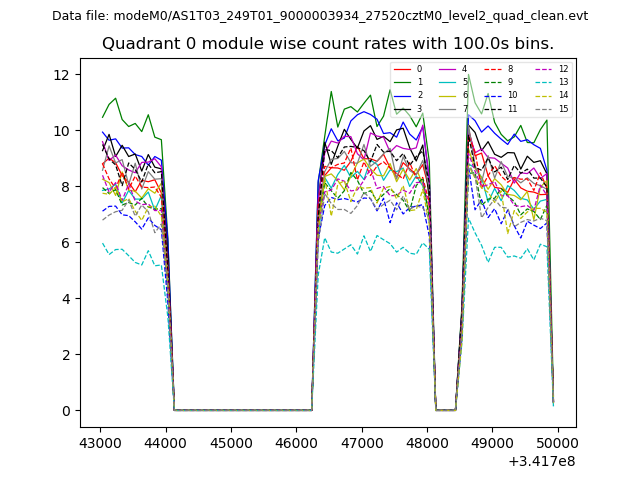 |
 |
| Module-wise count rates for Quadrant B Data is divided into 100 sec bins |
 |
 |
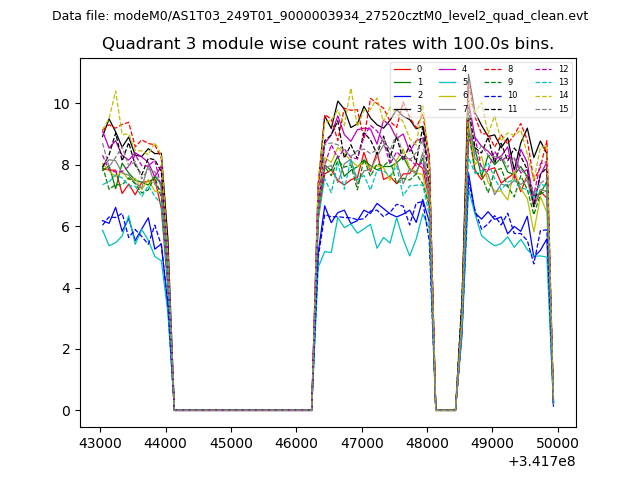
| Module-wise count rates for Quadrant C Data is divided into 100 sec bins |
 |
 |
| Module-wise count rates for Quadrant D Data is divided into 100 sec bins |
 |
 |
| Parameter | Plot |
|---|---|
| CZT HV Monitor | 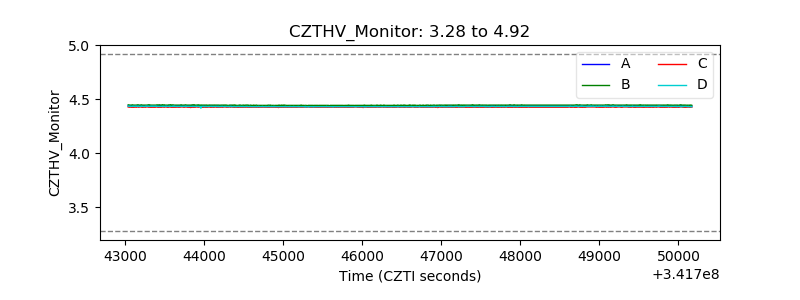 |
| D_VDD | 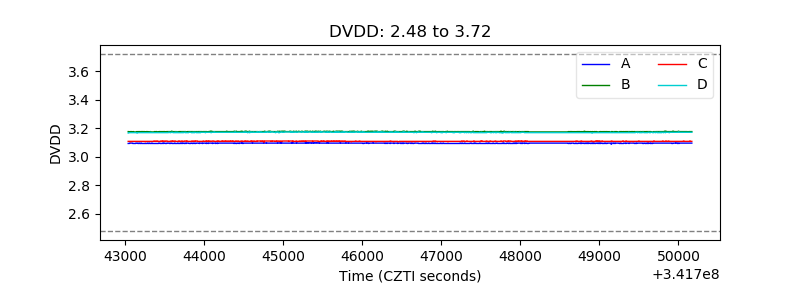 |
| Temperature 1 | 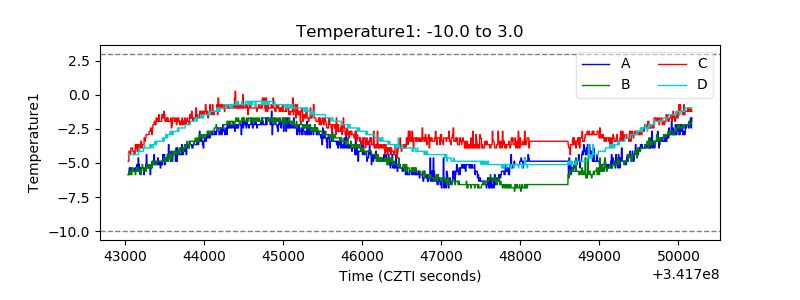 |
| Veto HV Monitor | 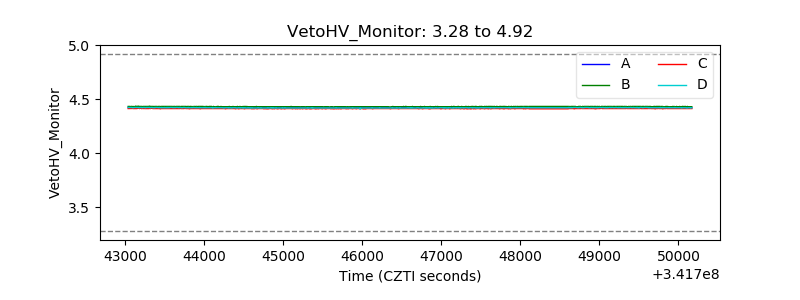 |
| Veto LLD |  |
| Alpha Counter | 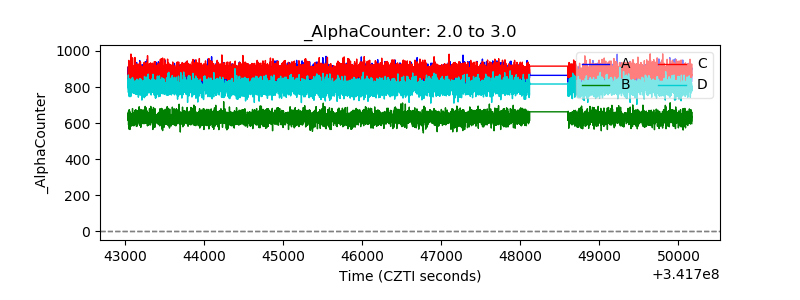 |
| _CPM_Rate | 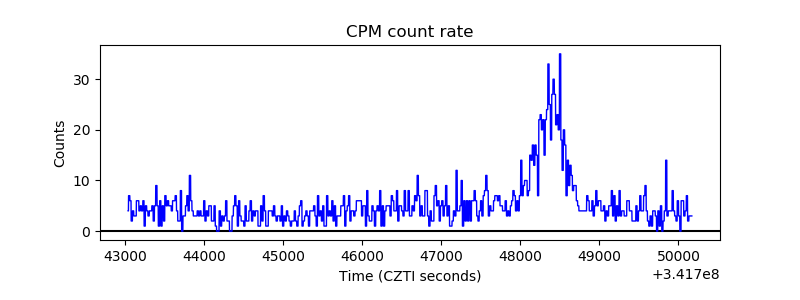 |
| CZT Counter |  |
| +2.5 Volts monitor |  |
| +5 Volts monitor | 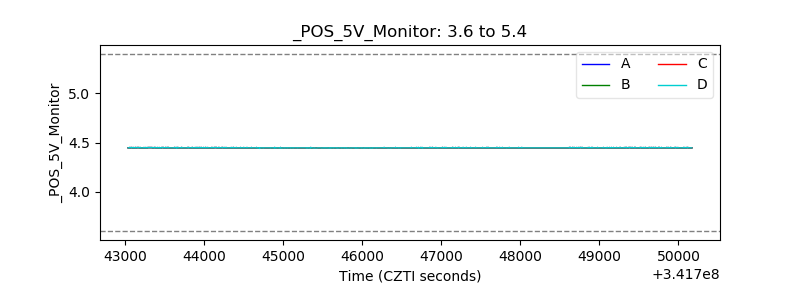 |
| _ROLL_ROT | 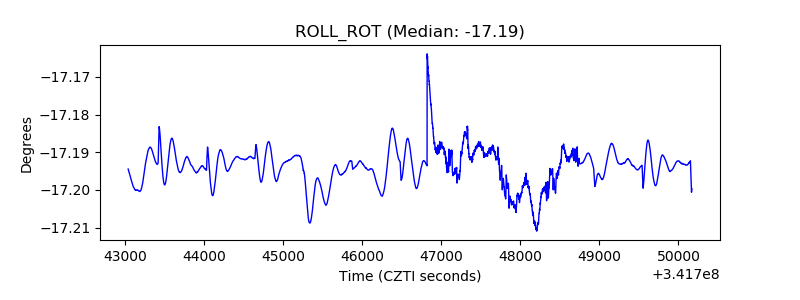 |
| _Roll_DEC | 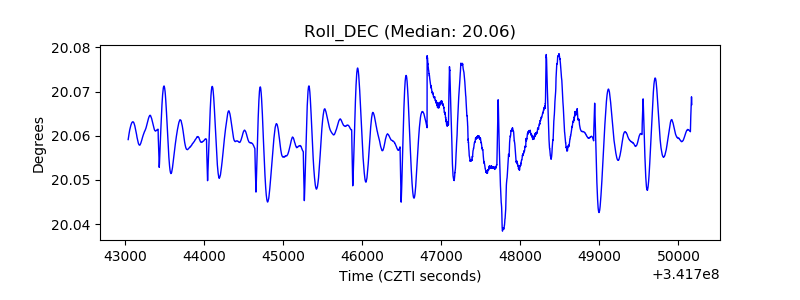 |
| _Roll_RA |  |
| Veto Counter | 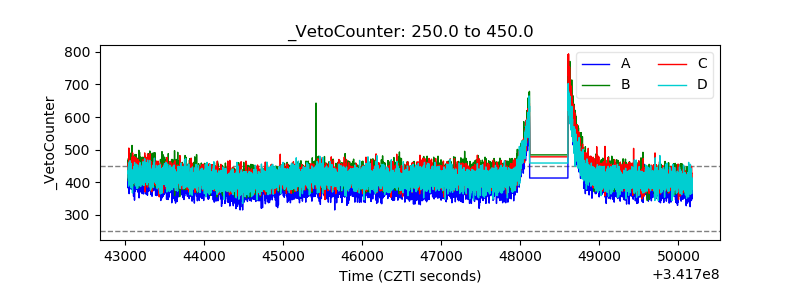 |