| Param | Original file | Final file |
|---|---|---|
| Filename | modeM0/AS1T03_249T01_9000003934_27521cztM0_level2.evt | modeM0/AS1T03_249T01_9000003934_27521cztM0_level2_quad_clean.evt |
| Size (bytes) | 543,061,440 | 92,980,800 |
| Size | 517.9 MB | 88.7 MB |
| Events in quadrant A | 3,550,503 | 591,368 |
| Events in quadrant B | 3,632,469 | 594,158 |
| Events in quadrant C | 3,559,794 | 564,640 |
| Events in quadrant D | 5,209,513 | 558,406 |
| Mode M0 | |||
|---|---|---|---|
| Quadrant | BADHDUFLAG | Total packets | Discarded packets |
| A | 0 | 15161 | 0 |
| B | 0 | 15256 | 0 |
| C | 0 | 15157 | 0 |
| D | 0 | 20289 | 0 |
| Quadrant | Total seconds | Saturated seconds | Saturation percentage |
|---|---|---|---|
| A | 7277 | 259 | 3.559159% |
| B | 7278 | 276 | 3.792251% |
| C | 7278 | 299 | 4.108272% |
| D | 7278 | 507 | 6.966200% |
Noise dominated data is calculated using 1-second bins in cleaned event files. If a bin has >2000 counts, and if more than 50% of those come from <1% of pixels, then it is considered to be noise-dominated and hence unusable.
| Quadrant | # 1 sec bins | Bins with >0 counts | Bins with >2000 counts | High rate bins dominated by noise | Noise dominated (total time) | Noise dominated (detector-on time) | Marked lightcurve |
|---|---|---|---|---|---|---|---|
| A | 7292 | 7277 | 0 | 0 | 0.00% | 0.00% | 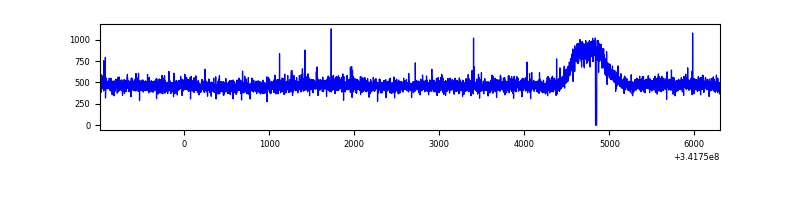 |
| B | 7293 | 7278 | 2 | 2 | 0.03% | 0.03% | 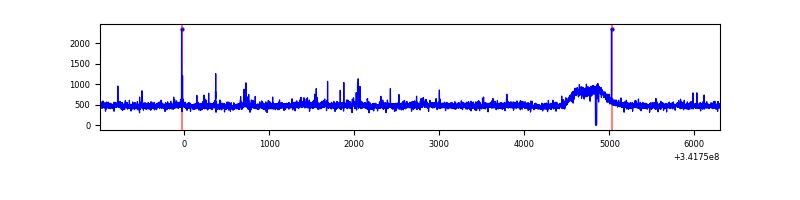 |
| C | 7293 | 7278 | 0 | 0 | 0.00% | 0.00% | 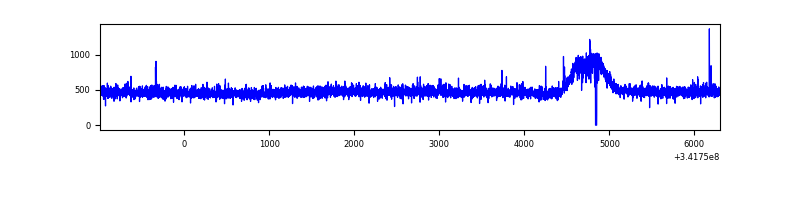 |
| D | 7293 | 7278 | 261 | 261 | 3.58% | 3.59% | 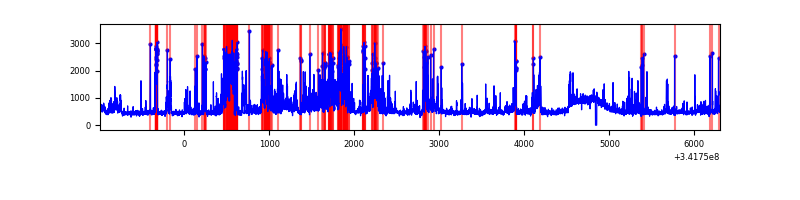 |
Top three noisy pixels from each quadrant. If the there are fewer than three noisy pixels in the level2.evt file, extra rows are filled as -1
| Pixel properties | Quadrant properties | ||||||
|---|---|---|---|---|---|---|---|
| Quadrant | DetID | PixID | Counts | Sigma | Mean | Median | Sigma |
| A | 13 | 254 | 12135 | 60.18 | 919 | 897 | 186.7 |
| A | 3 | 137 | 9006 | 43.42 | 919 | 897 | 186.7 |
| A | 0 | 226 | 7958 | 37.81 | 919 | 897 | 186.7 |
| B | 0 | 230 | 37325 | 206.5 | 904 | 879 | 176.5 |
| B | 15 | 32 | 26977 | 147.87 | 904 | 879 | 176.5 |
| B | 12 | 111 | 22204 | 120.83 | 904 | 879 | 176.5 |
| C | 14 | 238 | 136192 | 645.06 | 875 | 880 | 209.8 |
| C | 2 | 16 | 8691 | 37.24 | 875 | 880 | 209.8 |
| C | 13 | 61 | 5878 | 23.83 | 875 | 880 | 209.8 |
| D | 1 | 52 | 1492609 | 6989.4 | 880 | 856 | 213.4 |
| D | 2 | 250 | 122721 | 570.98 | 880 | 856 | 213.4 |
| D | 11 | 176 | 94662 | 439.51 | 880 | 856 | 213.4 |
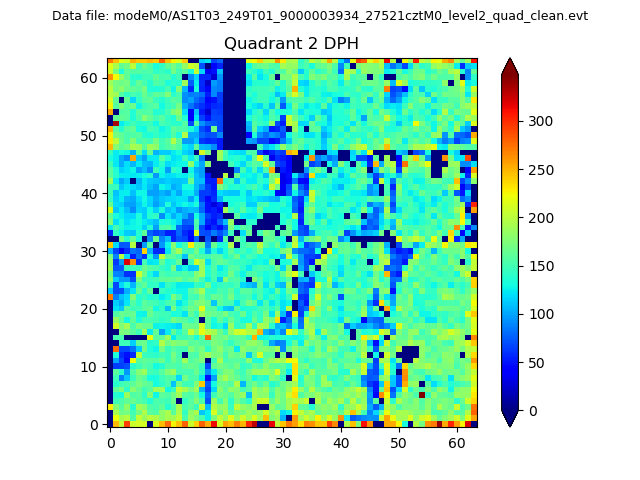
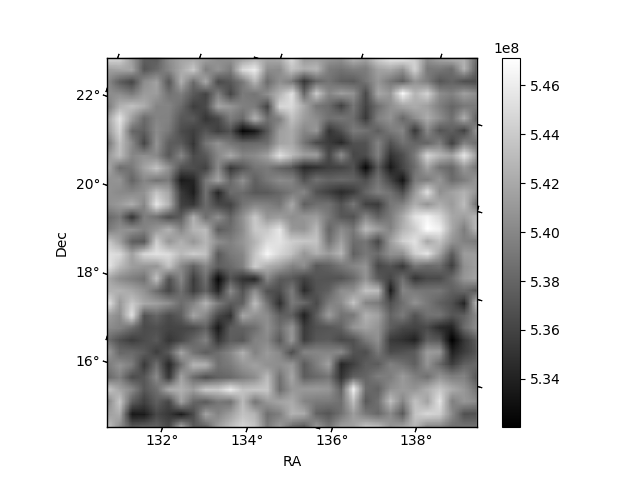
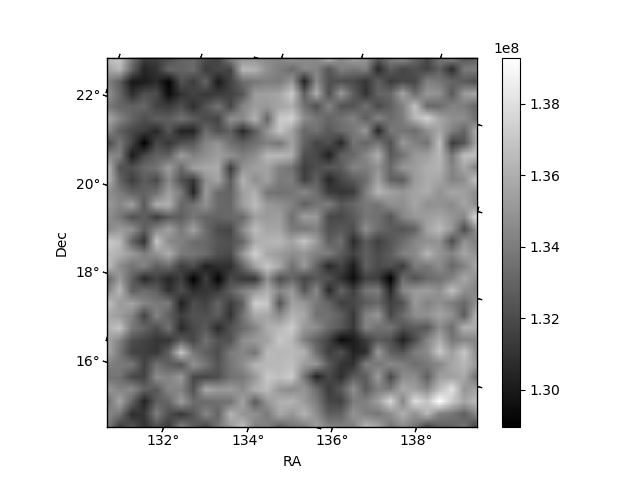
Histogram calculated using DETX and DETY for each event in the final _common_clean file
| Quadrant A | 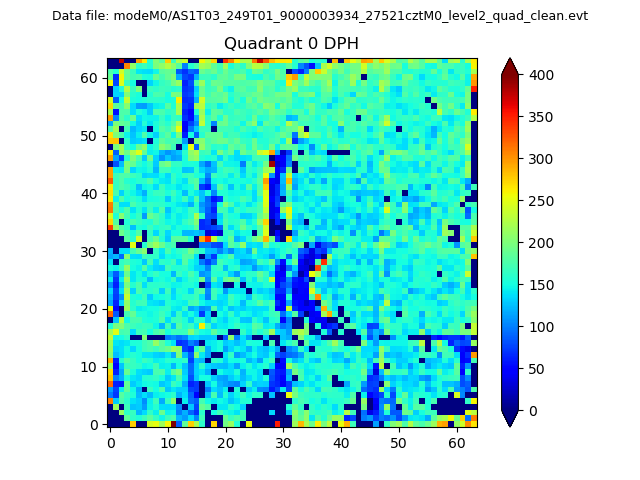 |
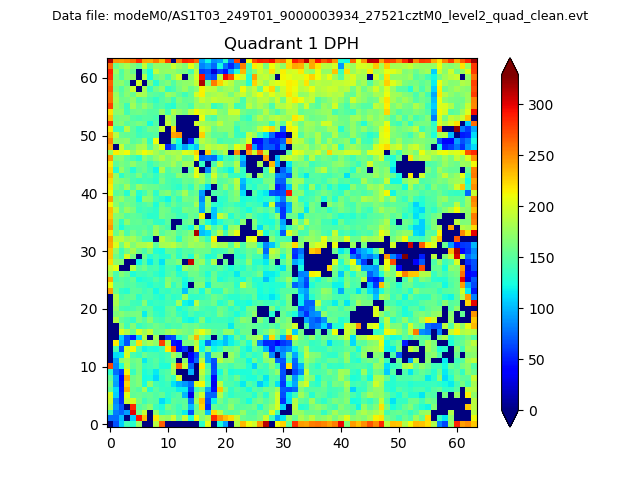 |
Quadrant B |
|---|---|---|---|
| Quadrant D | 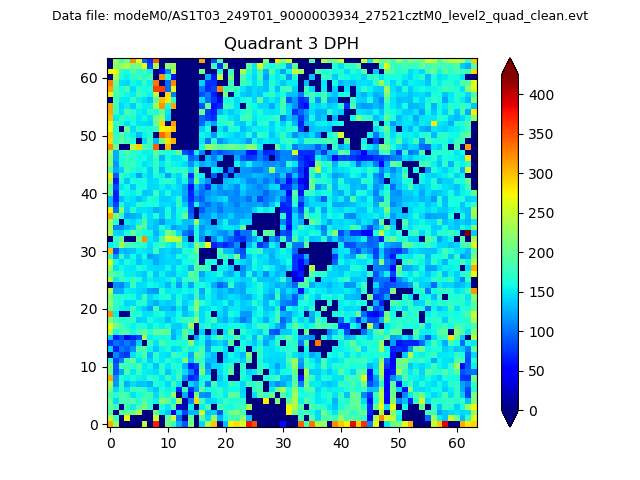 |
 |
Quadrant C |
| Plot type | Count rate plots | Images |
|---|---|---|
| Comparison with Poisson distribution Blue bars denote a histogram of data divided into 1 sec bins. Red curve is a Poisson curve with rate = median count rate of data. |
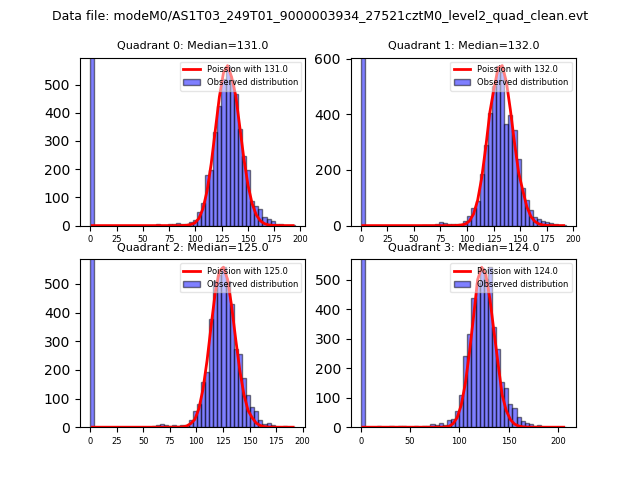 |
 |
| Quadrant-wise count rates Data is divided into 100 sec bins |
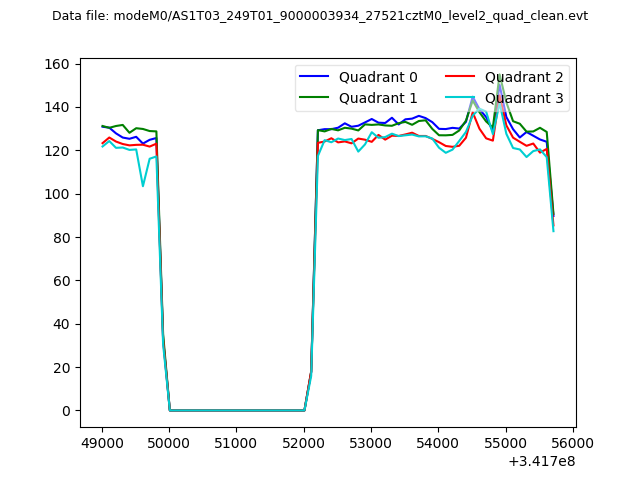 |
|
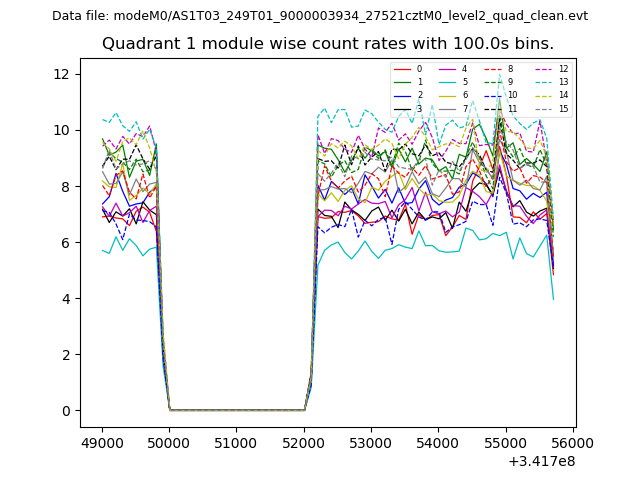
| Module-wise count rates for Quadrant A Data is divided into 100 sec bins |
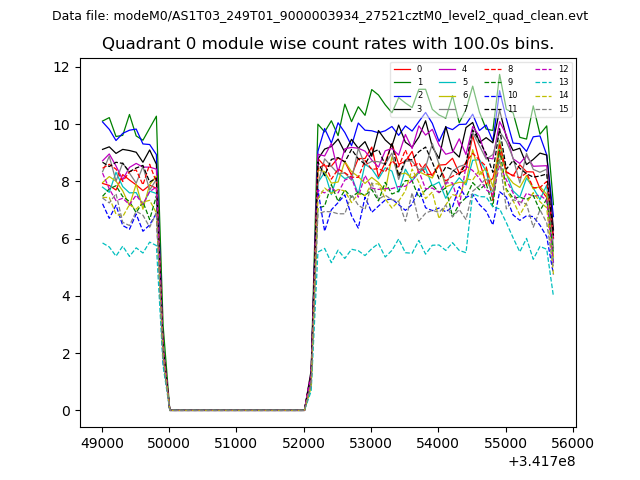 |
 |
| Module-wise count rates for Quadrant B Data is divided into 100 sec bins |
 |
 |
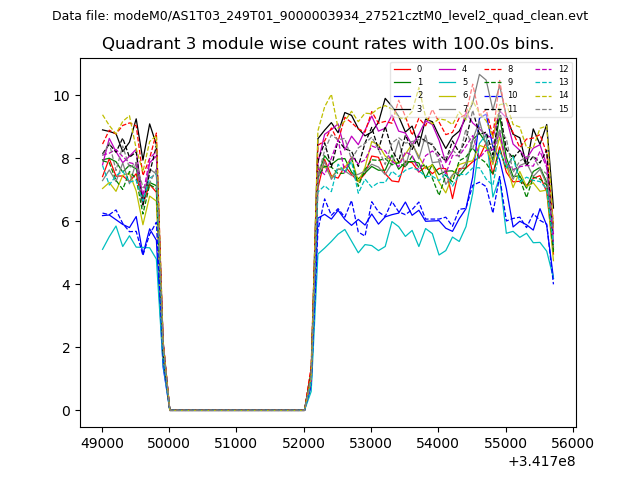
| Module-wise count rates for Quadrant C Data is divided into 100 sec bins |
 |
 |
| Module-wise count rates for Quadrant D Data is divided into 100 sec bins |
 |
 |
| Parameter | Plot |
|---|---|
| CZT HV Monitor | 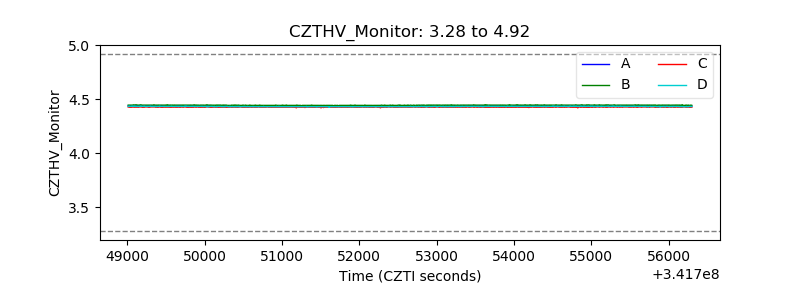 |
| D_VDD | 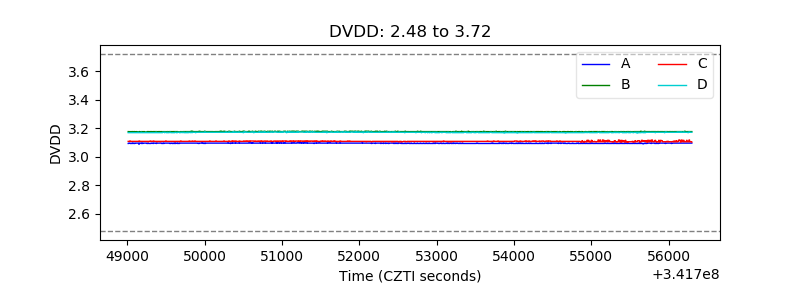 |
| Temperature 1 | 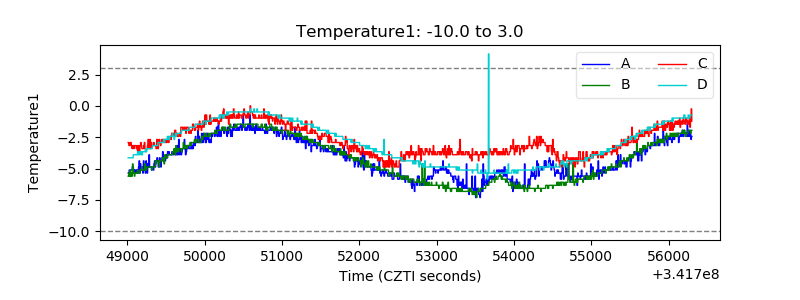 |
| Veto HV Monitor | 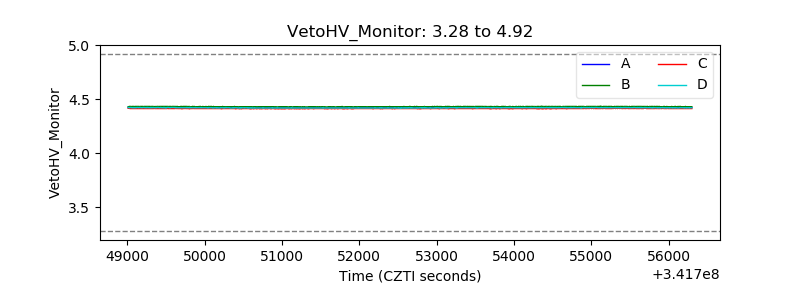 |
| Veto LLD | 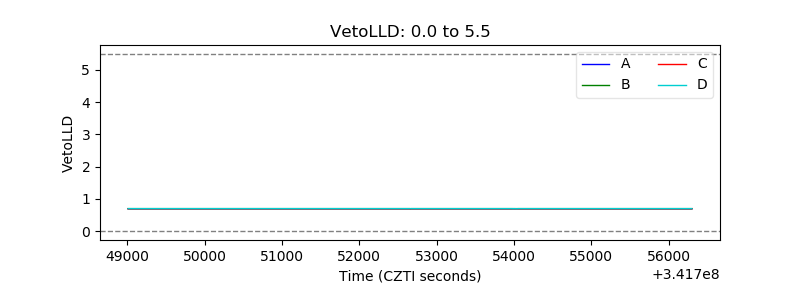 |
| Alpha Counter |  |
| _CPM_Rate | 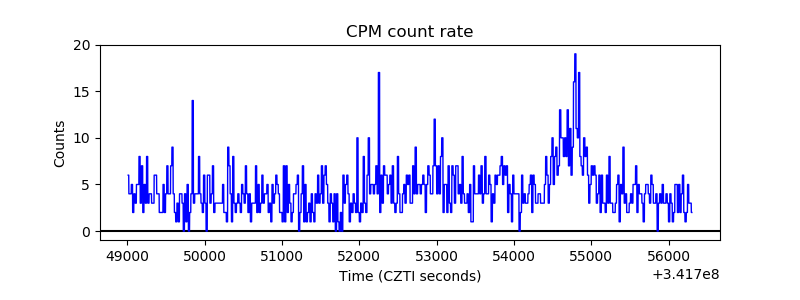 |
| CZT Counter |  |
| +2.5 Volts monitor |  |
| +5 Volts monitor |  |
| _ROLL_ROT | 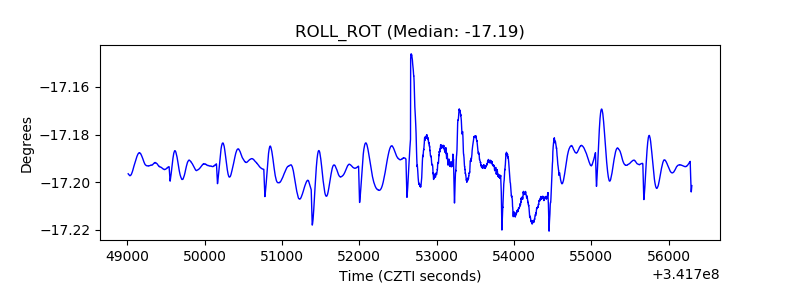 |
| _Roll_DEC | 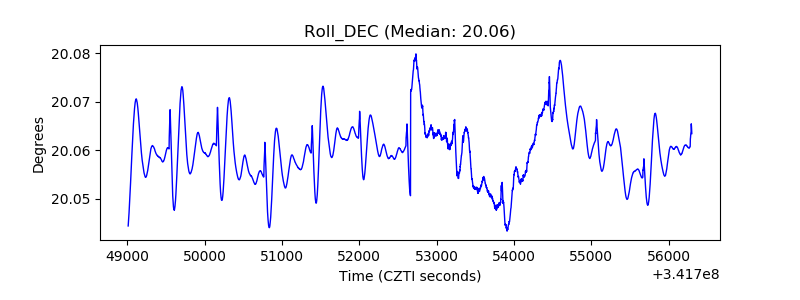 |
| _Roll_RA |  |
| Veto Counter | 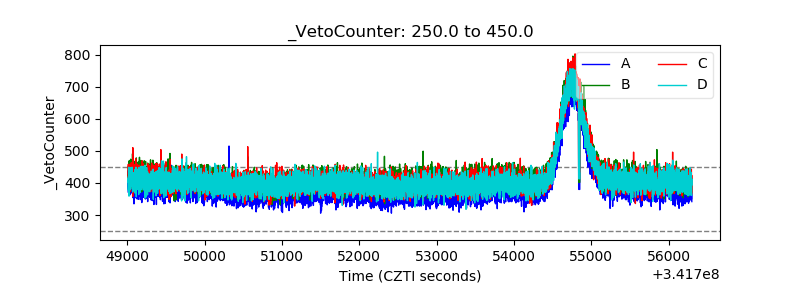 |