| Param | Original file | Final file |
|---|---|---|
| Filename | modeM0/AS1T03_249T01_9000003934_27525cztM0_level2.evt | modeM0/AS1T03_249T01_9000003934_27525cztM0_level2_quad_clean.evt |
| Size (bytes) | 1,452,268,800 | 219,931,200 |
| Size | 1.4 GB | 209.7 MB |
| Events in quadrant A | 9,031,784 | 1,389,480 |
| Events in quadrant B | 9,057,751 | 1,386,394 |
| Events in quadrant C | 9,012,963 | 1,324,864 |
| Events in quadrant D | 15,633,165 | 1,287,888 |
| Mode M0 | |||
|---|---|---|---|
| Quadrant | BADHDUFLAG | Total packets | Discarded packets |
| A | 0 | 38636 | 0 |
| B | 0 | 38554 | 0 |
| C | 0 | 38432 | 0 |
| D | 0 | 59170 | 0 |
| Mode M9 | |||
|---|---|---|---|
| Quadrant | BADHDUFLAG | Total packets | Discarded packets |
| A | 0 | 18 | 0 |
| B | 0 | 18 | 0 |
| C | 0 | 18 | 0 |
| D | 0 | 18 | 0 |
| Quadrant | Total seconds | Saturated seconds | Saturation percentage |
|---|---|---|---|
| A | 18451 | 208 | 1.127310% |
| B | 18452 | 270 | 1.463256% |
| C | 18452 | 335 | 1.815521% |
| D | 18452 | 1762 | 9.549100% |
Noise dominated data is calculated using 1-second bins in cleaned event files. If a bin has >2000 counts, and if more than 50% of those come from <1% of pixels, then it is considered to be noise-dominated and hence unusable.
| Quadrant | # 1 sec bins | Bins with >0 counts | Bins with >2000 counts | High rate bins dominated by noise | Noise dominated (total time) | Noise dominated (detector-on time) | Marked lightcurve |
|---|---|---|---|---|---|---|---|
| A | 20361 | 18451 | 1 | 1 | 0.00% | 0.01% | 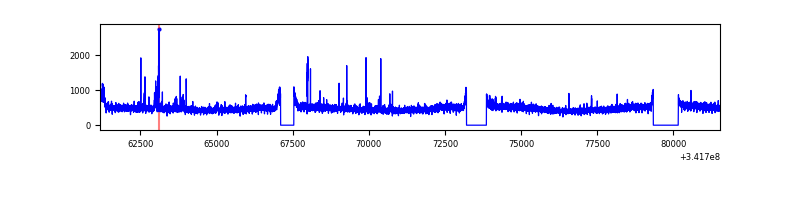 |
| B | 20362 | 18452 | 5 | 5 | 0.02% | 0.03% | 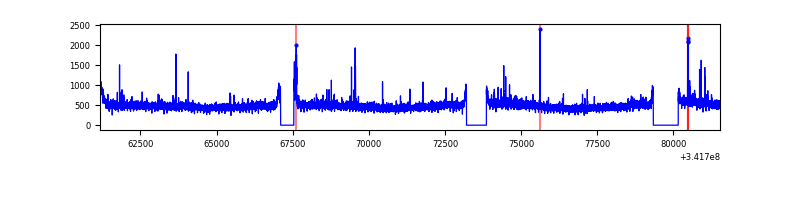 |
| C | 20362 | 18452 | 4 | 4 | 0.02% | 0.02% | 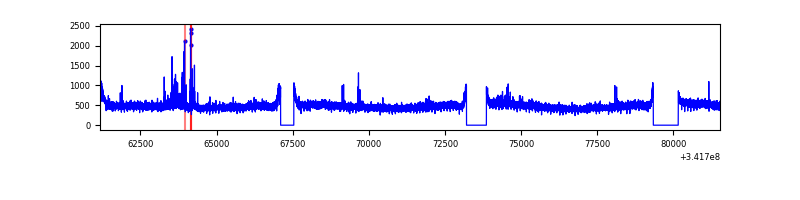 |
| D | 20362 | 18452 | 1369 | 1369 | 6.72% | 7.42% | 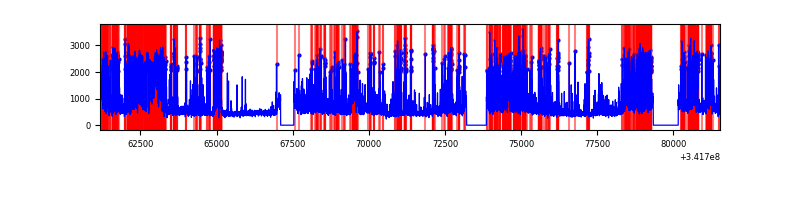 |
Top three noisy pixels from each quadrant. If the there are fewer than three noisy pixels in the level2.evt file, extra rows are filled as -1
| Pixel properties | Quadrant properties | ||||||
|---|---|---|---|---|---|---|---|
| Quadrant | DetID | PixID | Counts | Sigma | Mean | Median | Sigma |
| A | 6 | 16 | 225882 | 485.84 | 2284 | 2232 | 460.3 |
| A | 13 | 254 | 29074 | 58.31 | 2284 | 2232 | 460.3 |
| A | 3 | 137 | 22685 | 44.43 | 2284 | 2232 | 460.3 |
| B | 15 | 32 | 65999 | 147.84 | 2253 | 2192 | 431.6 |
| B | 0 | 230 | 64067 | 143.36 | 2253 | 2192 | 431.6 |
| B | 12 | 111 | 54756 | 121.79 | 2253 | 2192 | 431.6 |
| C | 14 | 238 | 344533 | 664.75 | 2179 | 2189 | 515.0 |
| C | 2 | 16 | 155531 | 297.75 | 2179 | 2189 | 515.0 |
| C | 13 | 61 | 14788 | 24.46 | 2179 | 2189 | 515.0 |
| D | 1 | 52 | 3651404 | 7162.7 | 2138 | 2079 | 509.5 |
| D | 7 | 80 | 3256019 | 6386.66 | 2138 | 2079 | 509.5 |
| D | 2 | 250 | 197358 | 383.28 | 2138 | 2079 | 509.5 |
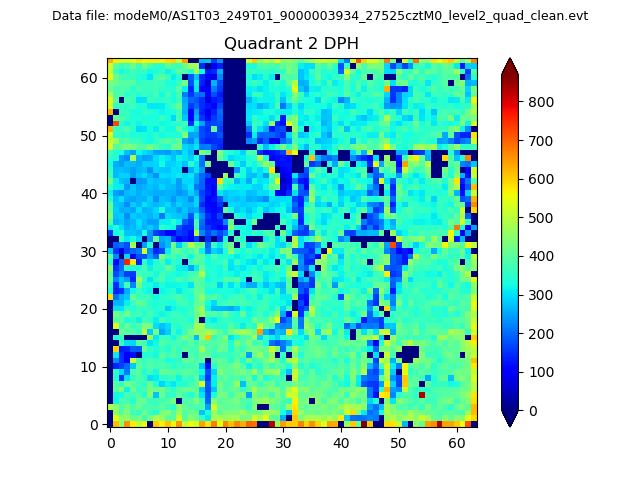
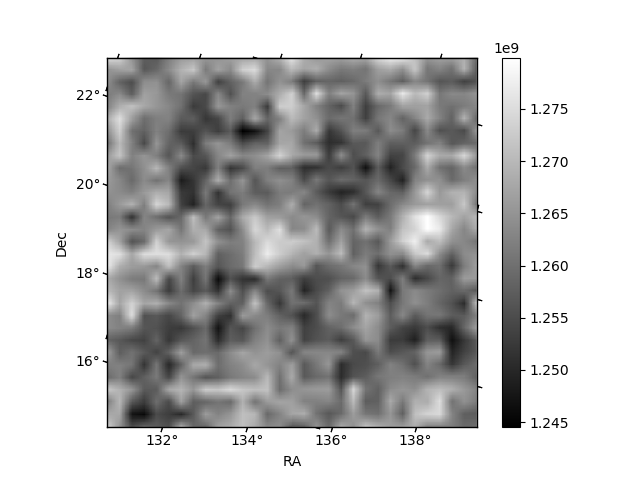
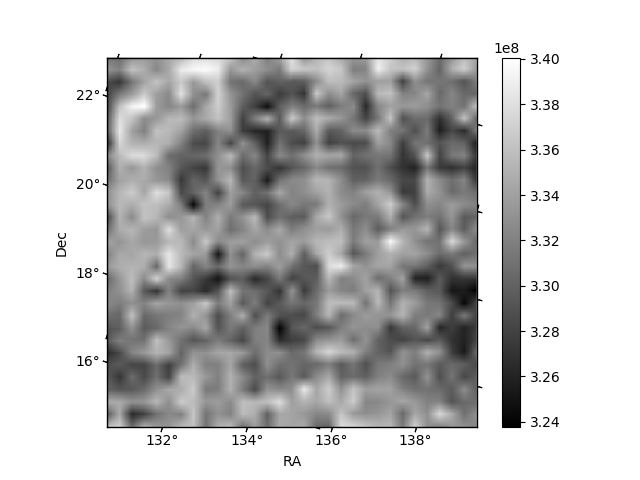
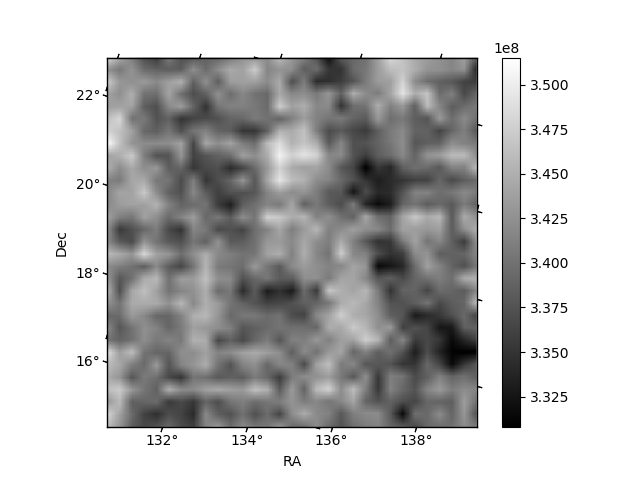
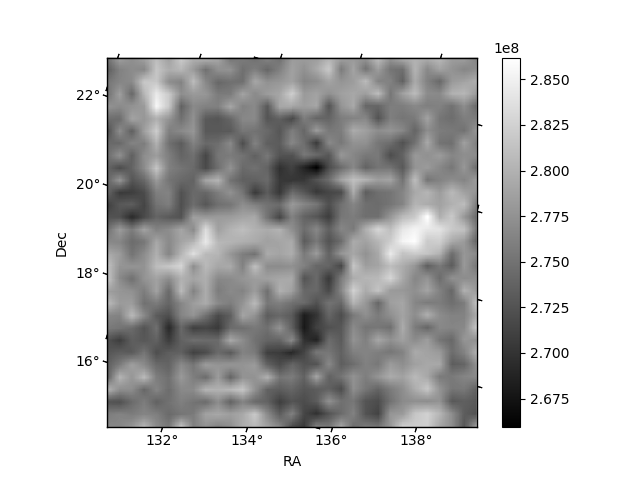
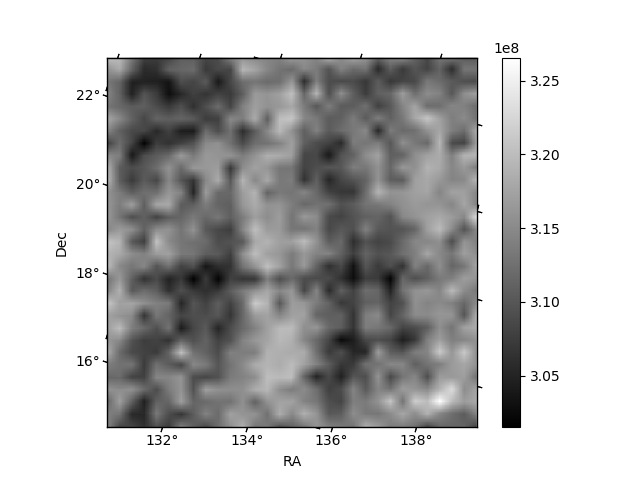
Histogram calculated using DETX and DETY for each event in the final _common_clean file
| Quadrant A | 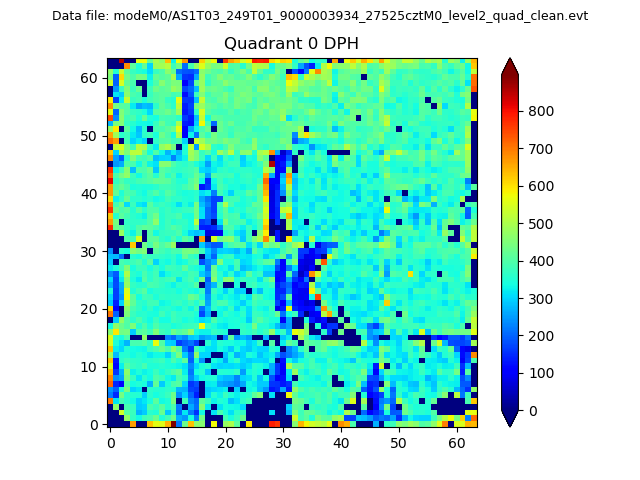 |
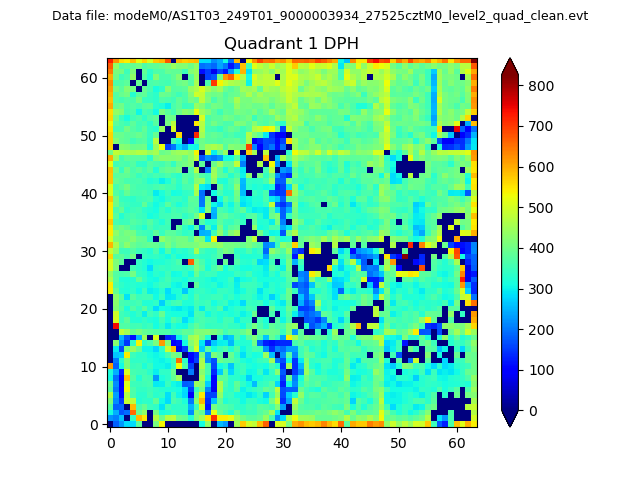 |
Quadrant B |
|---|---|---|---|
| Quadrant D | 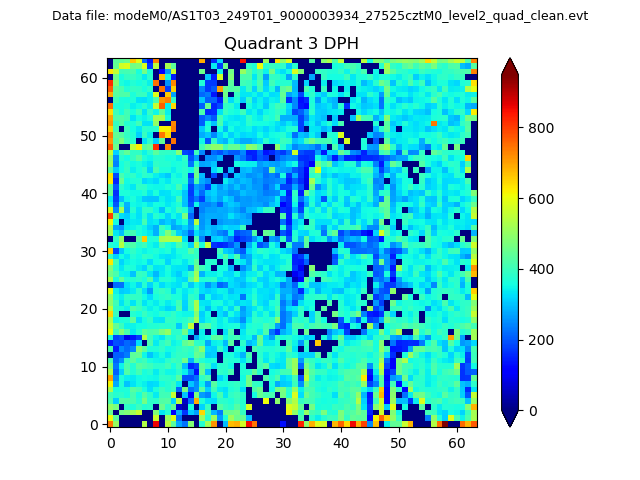 |
 |
Quadrant C |
| Plot type | Count rate plots | Images |
|---|---|---|
| Comparison with Poisson distribution Blue bars denote a histogram of data divided into 1 sec bins. Red curve is a Poisson curve with rate = median count rate of data. |
 |
 |
| Quadrant-wise count rates Data is divided into 100 sec bins |
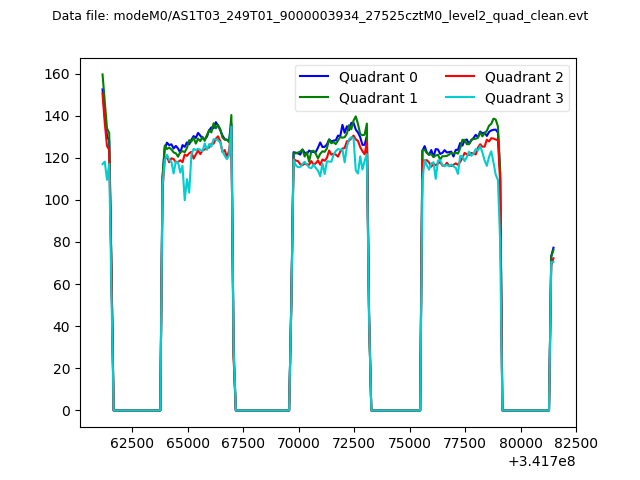 |
|
| Module-wise count rates for Quadrant A Data is divided into 100 sec bins |
 |
 |
| Module-wise count rates for Quadrant B Data is divided into 100 sec bins |
 |
 |
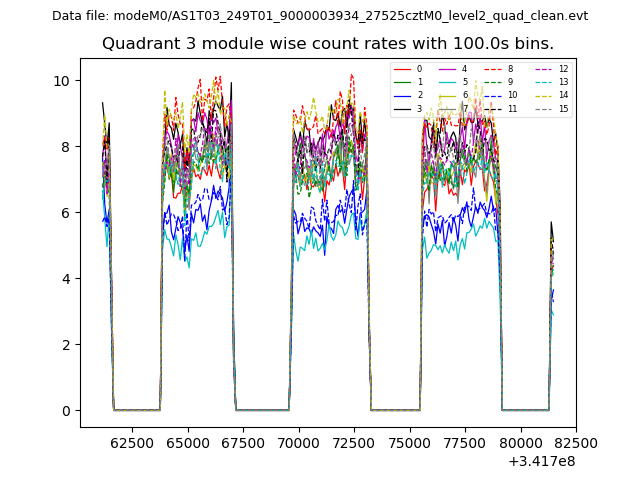
| Module-wise count rates for Quadrant C Data is divided into 100 sec bins |
 |
 |
| Module-wise count rates for Quadrant D Data is divided into 100 sec bins |
 |
 |
| Parameter | Plot |
|---|---|
| CZT HV Monitor |  |
| D_VDD | 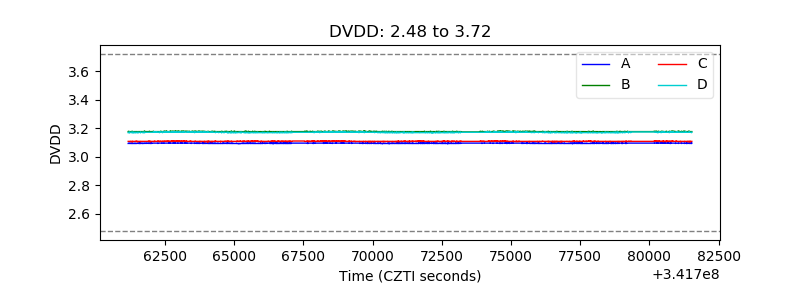 |
| Temperature 1 | 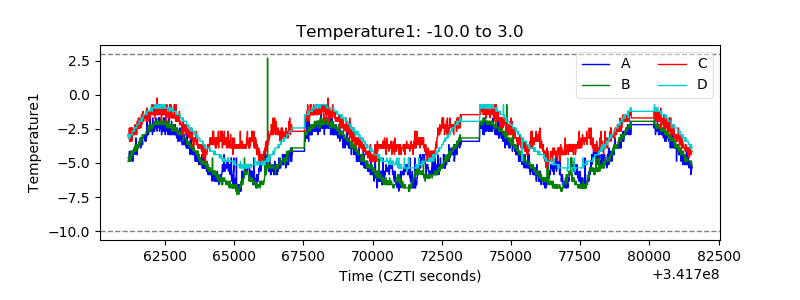 |
| Veto HV Monitor | 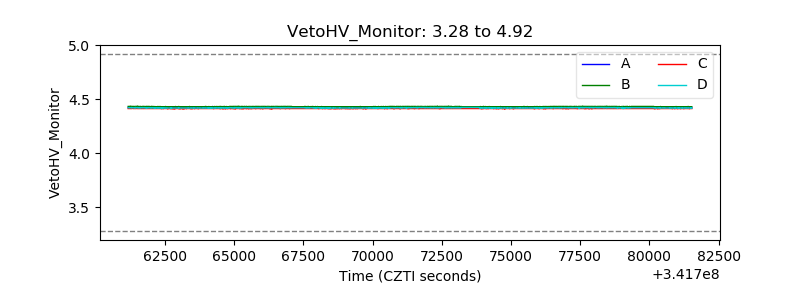 |
| Veto LLD | 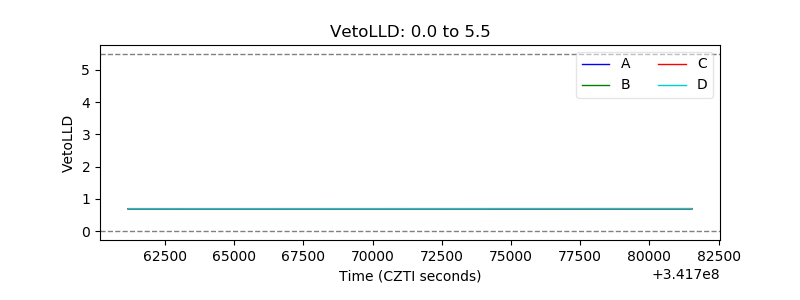 |
| Alpha Counter |  |
| _CPM_Rate | 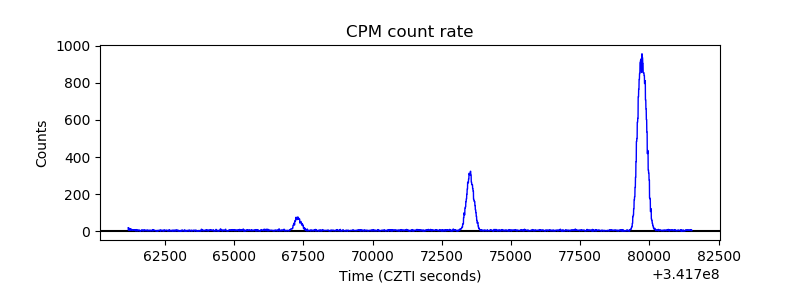 |
| CZT Counter | 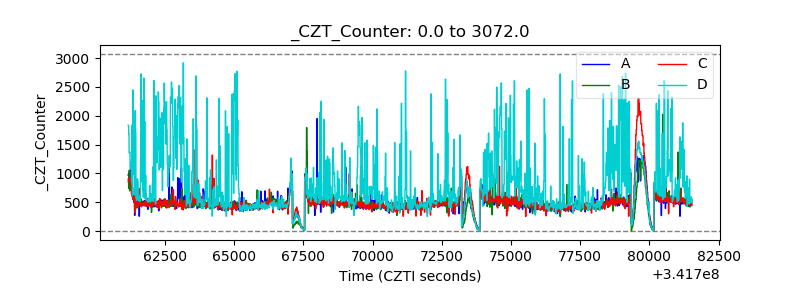 |
| +2.5 Volts monitor |  |
| +5 Volts monitor |  |
| _ROLL_ROT | 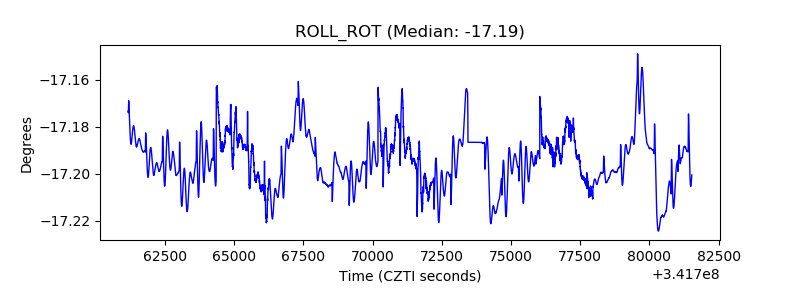 |
| _Roll_DEC | 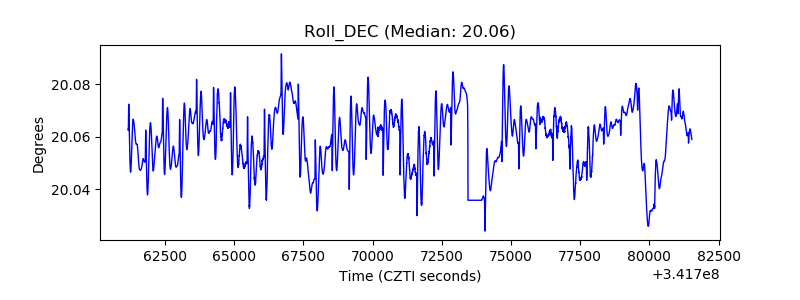 |
| _Roll_RA | 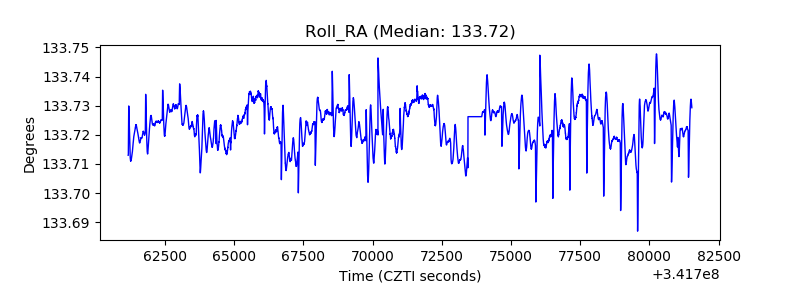 |
| Veto Counter | 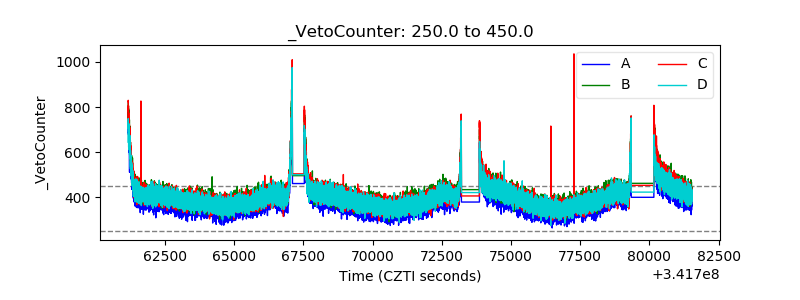 |