| Param | Original file | Final file |
|---|---|---|
| Filename | modeM0/AS1T03_249T01_9000003934_27528cztM0_level2.evt | modeM0/AS1T03_249T01_9000003934_27528cztM0_level2_quad_clean.evt |
| Size (bytes) | 459,627,840 | 90,953,280 |
| Size | 438.3 MB | 86.7 MB |
| Events in quadrant A | 3,037,464 | 598,014 |
| Events in quadrant B | 3,087,600 | 604,451 |
| Events in quadrant C | 3,041,122 | 574,109 |
| Events in quadrant D | 4,341,161 | 553,654 |
| Mode M0 | |||
|---|---|---|---|
| Quadrant | BADHDUFLAG | Total packets | Discarded packets |
| A | 0 | 12945 | 0 |
| B | 0 | 13138 | 0 |
| C | 0 | 13012 | 0 |
| D | 0 | 17196 | 0 |
| Mode M9 | |||
|---|---|---|---|
| Quadrant | BADHDUFLAG | Total packets | Discarded packets |
| A | 0 | 12 | 0 |
| B | 0 | 12 | 0 |
| C | 0 | 12 | 0 |
| D | 0 | 12 | 0 |
| Quadrant | Total seconds | Saturated seconds | Saturation percentage |
|---|---|---|---|
| A | 6078 | 40 | 0.658111% |
| B | 6079 | 42 | 0.690903% |
| C | 6079 | 67 | 1.102155% |
| D | 6079 | 272 | 4.474420% |
Noise dominated data is calculated using 1-second bins in cleaned event files. If a bin has >2000 counts, and if more than 50% of those come from <1% of pixels, then it is considered to be noise-dominated and hence unusable.
| Quadrant | # 1 sec bins | Bins with >0 counts | Bins with >2000 counts | High rate bins dominated by noise | Noise dominated (total time) | Noise dominated (detector-on time) | Marked lightcurve |
|---|---|---|---|---|---|---|---|
| A | 7233 | 6078 | 11 | 11 | 0.15% | 0.18% | 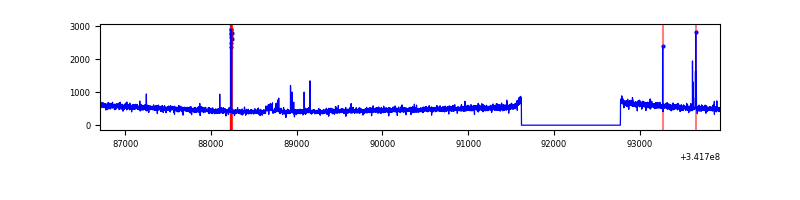 |
| B | 7234 | 6079 | 1 | 1 | 0.01% | 0.02% | 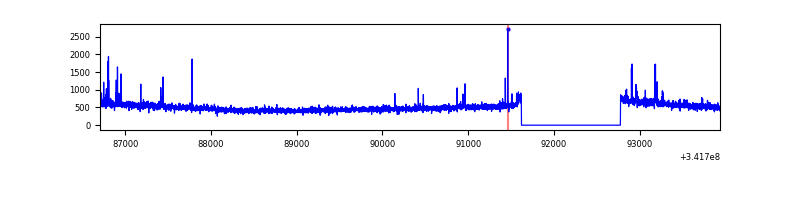 |
| C | 7234 | 6079 | 0 | 0 | 0.00% | 0.00% | 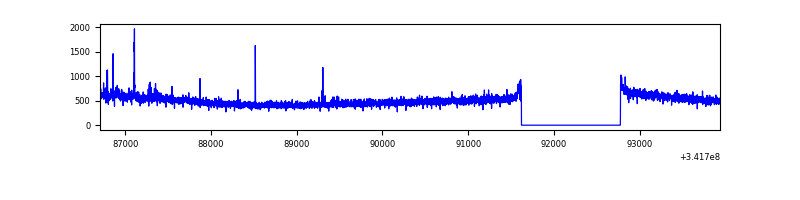 |
| D | 7234 | 6080 | 146 | 146 | 2.02% | 2.40% | 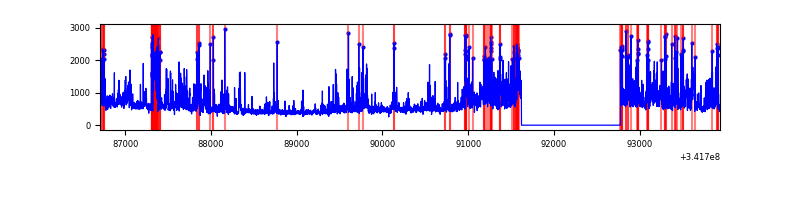 |
Top three noisy pixels from each quadrant. If the there are fewer than three noisy pixels in the level2.evt file, extra rows are filled as -1
| Pixel properties | Quadrant properties | ||||||
|---|---|---|---|---|---|---|---|
| Quadrant | DetID | PixID | Counts | Sigma | Mean | Median | Sigma |
| A | 6 | 16 | 64091 | 408.39 | 770 | 756 | 155.1 |
| A | 13 | 254 | 10309 | 61.6 | 770 | 756 | 155.1 |
| A | 3 | 137 | 7448 | 43.15 | 770 | 756 | 155.1 |
| B | 0 | 230 | 24687 | 161.54 | 769 | 749 | 148.2 |
| B | 0 | 244 | 22140 | 144.35 | 769 | 749 | 148.2 |
| B | 12 | 111 | 17983 | 116.3 | 769 | 749 | 148.2 |
| C | 14 | 238 | 118483 | 674.07 | 739 | 744 | 174.7 |
| C | 7 | 221 | 29120 | 162.46 | 739 | 744 | 174.7 |
| C | 2 | 16 | 11748 | 63.0 | 739 | 744 | 174.7 |
| D | 1 | 52 | 1337405 | 7776.12 | 724 | 705 | 171.9 |
| D | 11 | 176 | 74977 | 432.07 | 724 | 705 | 171.9 |
| D | 2 | 250 | 58309 | 335.1 | 724 | 705 | 171.9 |
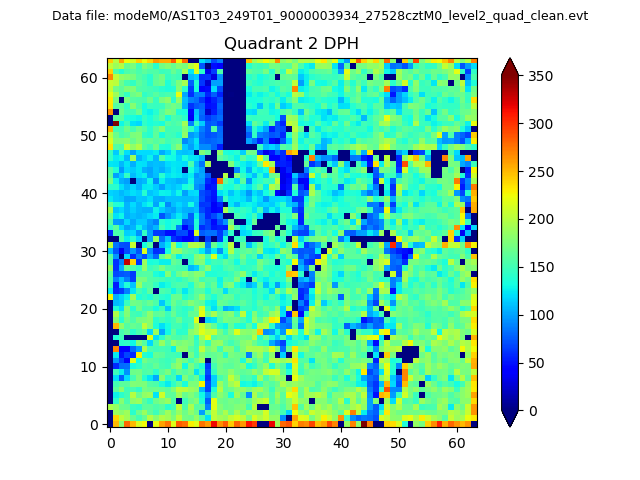
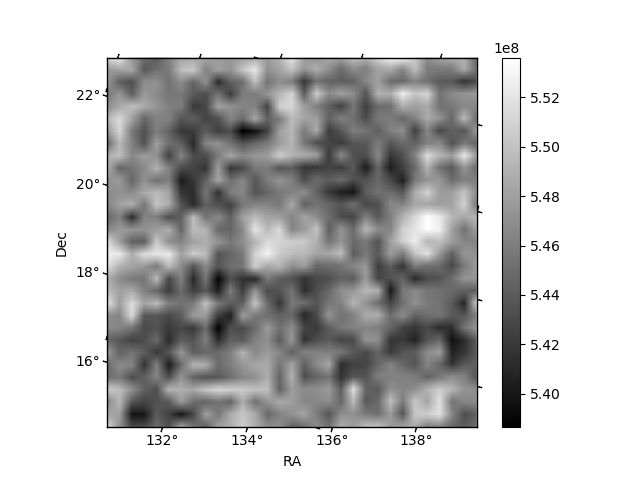
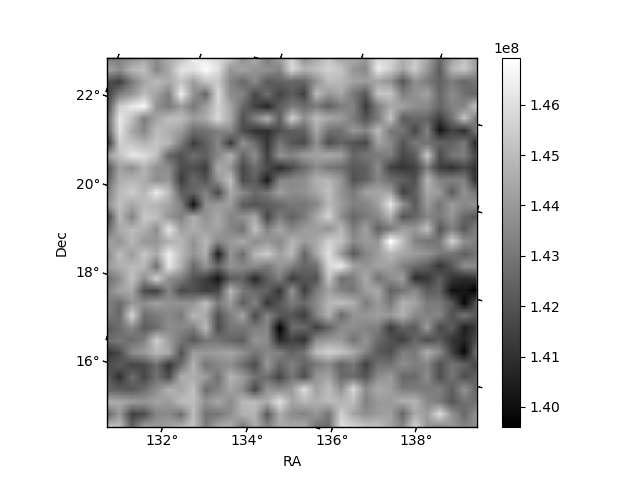
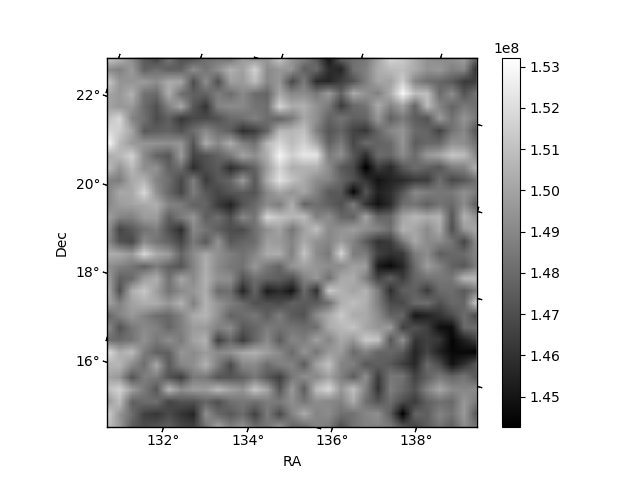
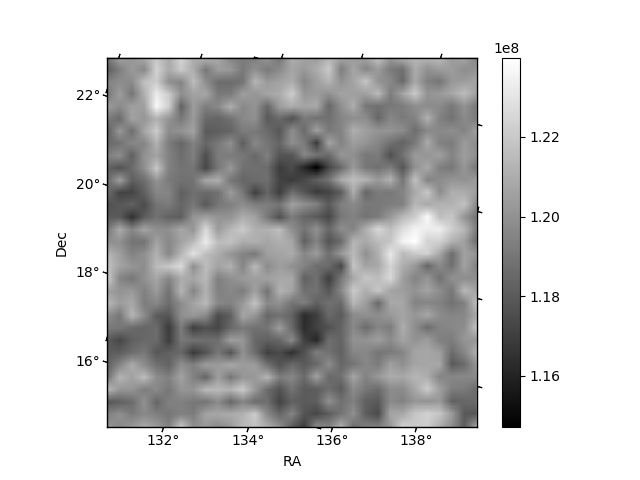
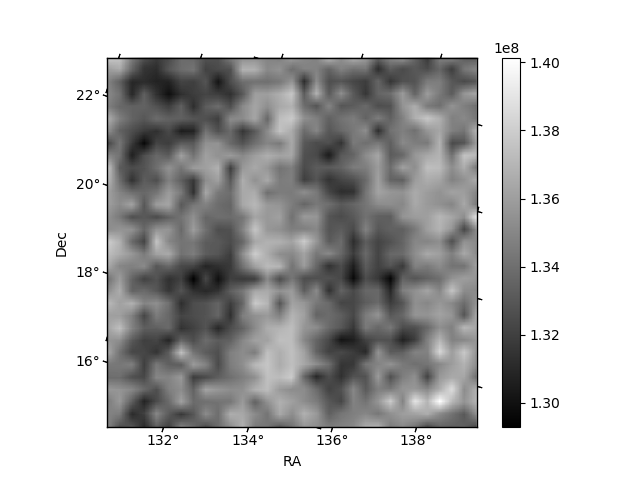
Histogram calculated using DETX and DETY for each event in the final _common_clean file
| Quadrant A | 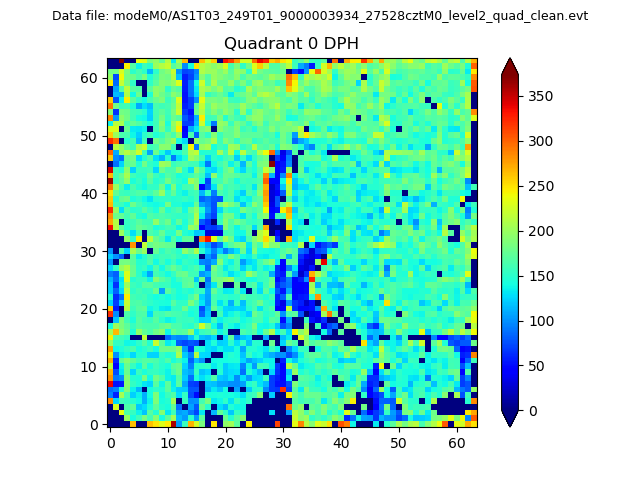 |
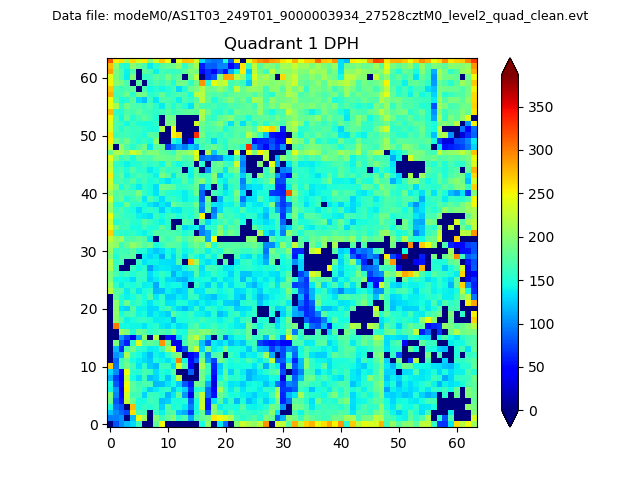 |
Quadrant B |
|---|---|---|---|
| Quadrant D | 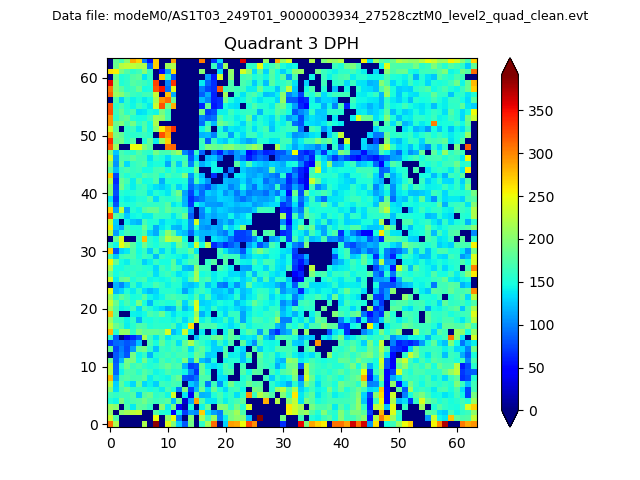 |
 |
Quadrant C |
| Plot type | Count rate plots | Images |
|---|---|---|
| Comparison with Poisson distribution Blue bars denote a histogram of data divided into 1 sec bins. Red curve is a Poisson curve with rate = median count rate of data. |
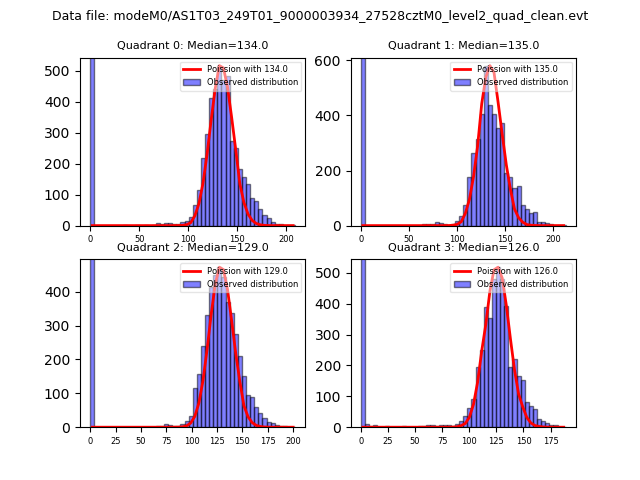 |
 |
| Quadrant-wise count rates Data is divided into 100 sec bins |
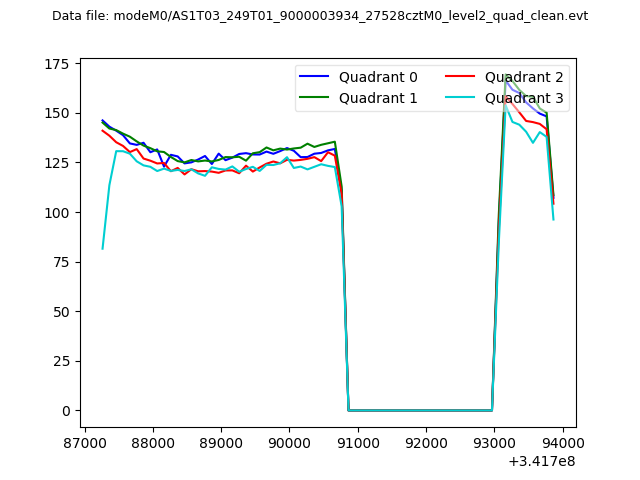 |
|
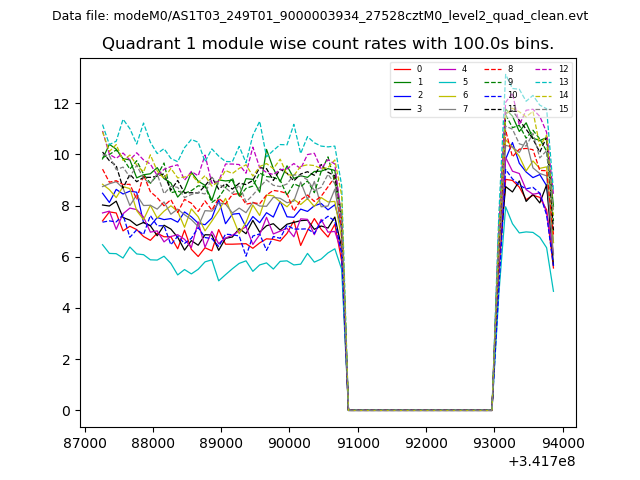
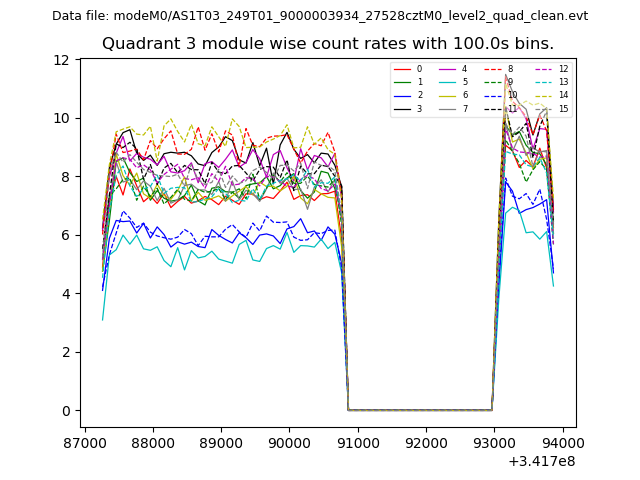
| Module-wise count rates for Quadrant A Data is divided into 100 sec bins |
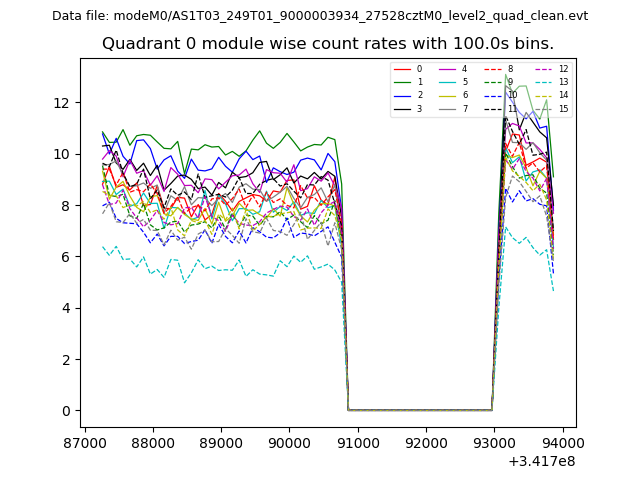 |
 |
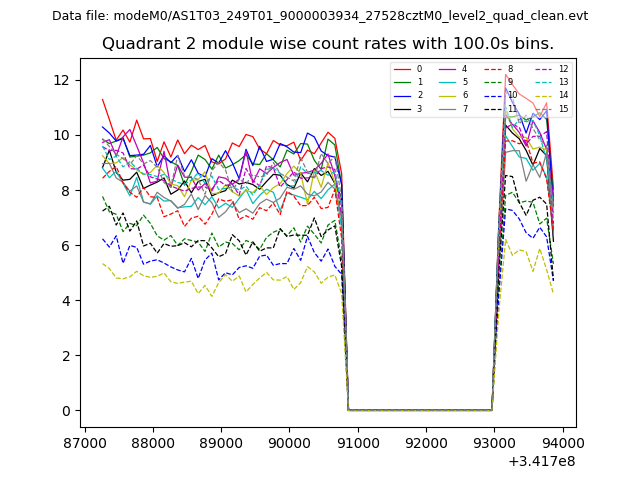
| Module-wise count rates for Quadrant B Data is divided into 100 sec bins |
 |
 |
| Module-wise count rates for Quadrant C Data is divided into 100 sec bins |
 |
 |
| Module-wise count rates for Quadrant D Data is divided into 100 sec bins |
 |
 |
| Parameter | Plot |
|---|---|
| CZT HV Monitor | 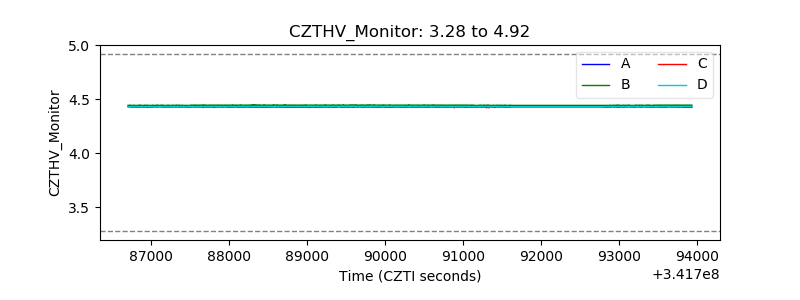 |
| D_VDD | 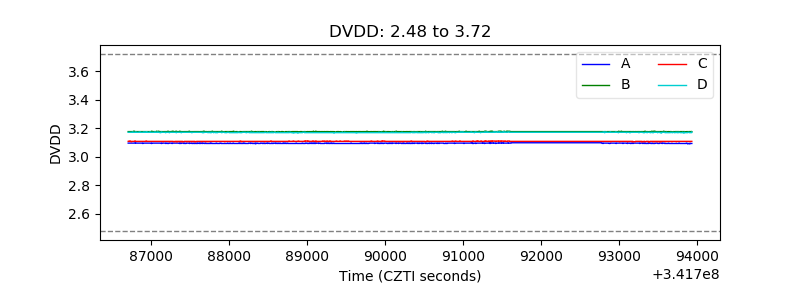 |
| Temperature 1 | 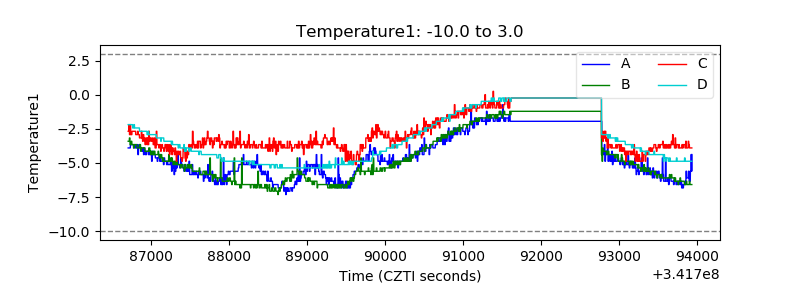 |
| Veto HV Monitor | 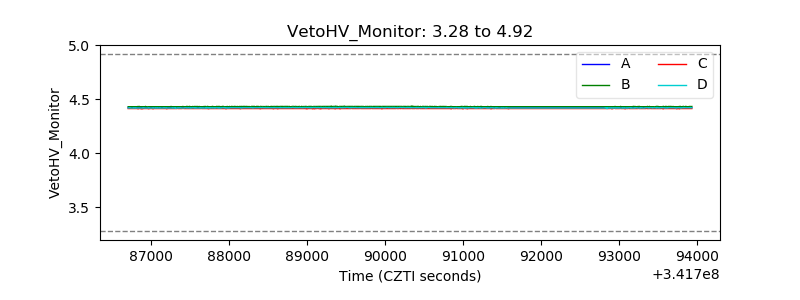 |
| Veto LLD | 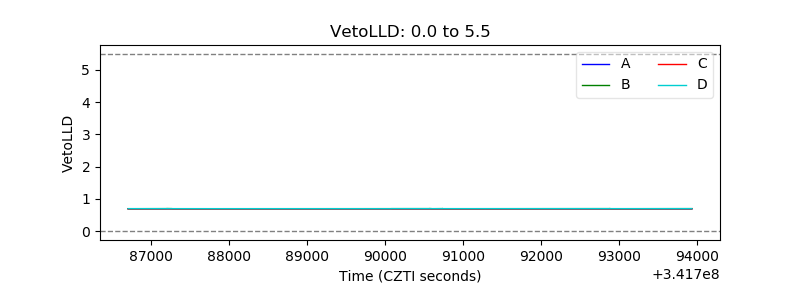 |
| Alpha Counter | 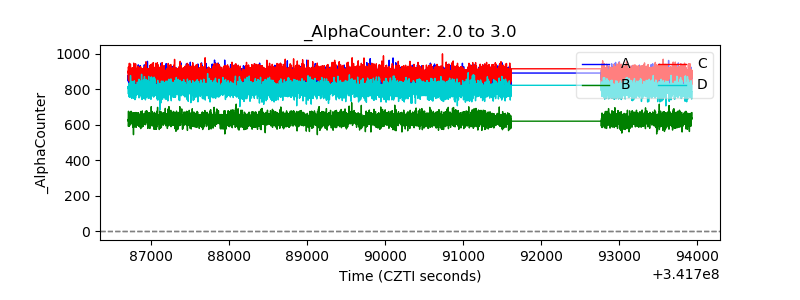 |
| _CPM_Rate | 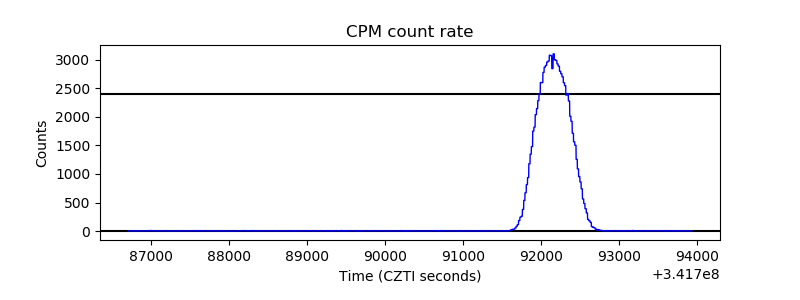 |
| CZT Counter | 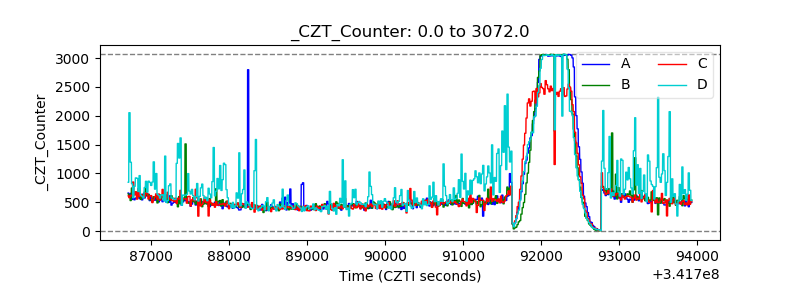 |
| +2.5 Volts monitor |  |
| +5 Volts monitor |  |
| _ROLL_ROT | 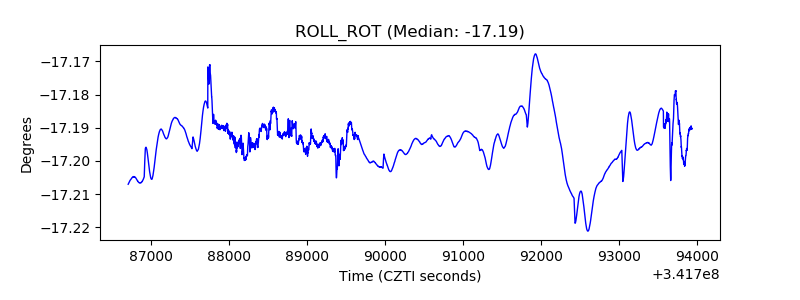 |
| _Roll_DEC | 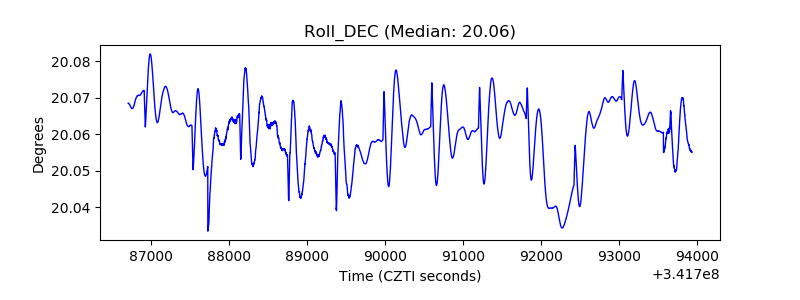 |
| _Roll_RA | 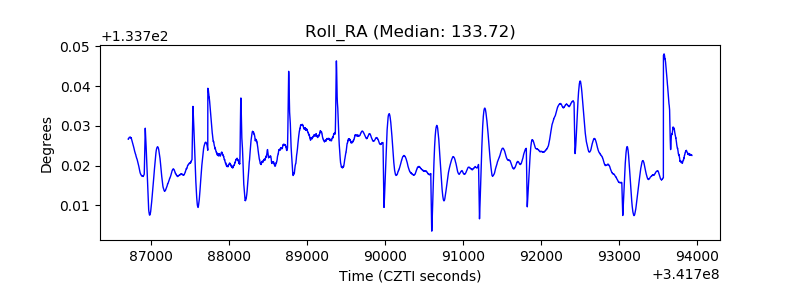 |
| Veto Counter | 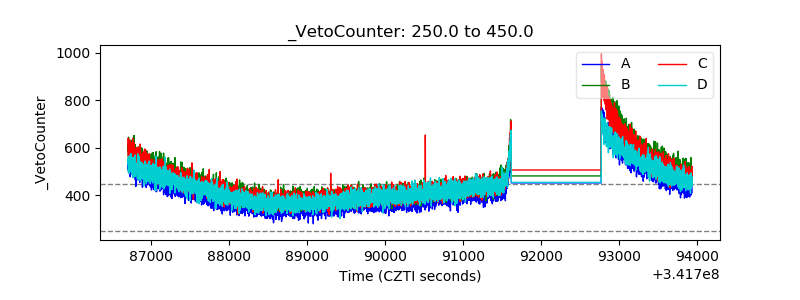 |