| Param | Original file | Final file |
|---|---|---|
| Filename | modeM0/AS1T03_249T01_9000003934_27529cztM0_level2.evt | modeM0/AS1T03_249T01_9000003934_27529cztM0_level2_quad_clean.evt |
| Size (bytes) | 491,544,000 | 105,762,240 |
| Size | 468.8 MB | 100.9 MB |
| Events in quadrant A | 3,152,952 | 712,879 |
| Events in quadrant B | 3,245,322 | 730,495 |
| Events in quadrant C | 3,189,126 | 681,479 |
| Events in quadrant D | 4,878,758 | 645,742 |
| Mode M0 | |||
|---|---|---|---|
| Quadrant | BADHDUFLAG | Total packets | Discarded packets |
| A | 0 | 13353 | 0 |
| B | 0 | 13662 | 0 |
| C | 0 | 13458 | 0 |
| D | 0 | 18668 | 0 |
| Mode M9 | |||
|---|---|---|---|
| Quadrant | BADHDUFLAG | Total packets | Discarded packets |
| A | 0 | 13 | 0 |
| B | 0 | 13 | 0 |
| C | 0 | 13 | 0 |
| D | 0 | 13 | 0 |
| Quadrant | Total seconds | Saturated seconds | Saturation percentage |
|---|---|---|---|
| A | 6201 | 16 | 0.258023% |
| B | 6202 | 32 | 0.515963% |
| C | 6202 | 68 | 1.096421% |
| D | 6202 | 338 | 5.449855% |
Noise dominated data is calculated using 1-second bins in cleaned event files. If a bin has >2000 counts, and if more than 50% of those come from <1% of pixels, then it is considered to be noise-dominated and hence unusable.
| Quadrant | # 1 sec bins | Bins with >0 counts | Bins with >2000 counts | High rate bins dominated by noise | Noise dominated (total time) | Noise dominated (detector-on time) | Marked lightcurve |
|---|---|---|---|---|---|---|---|
| A | 7471 | 6202 | 2 | 2 | 0.03% | 0.03% | 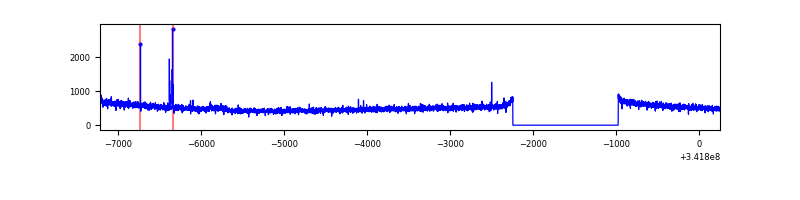 |
| B | 7472 | 6203 | 0 | 0 | 0.00% | 0.00% | 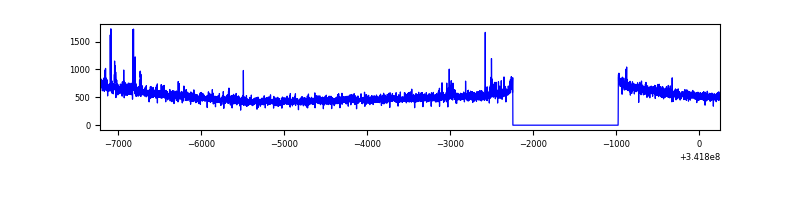 |
| C | 7472 | 6202 | 0 | 0 | 0.00% | 0.00% | 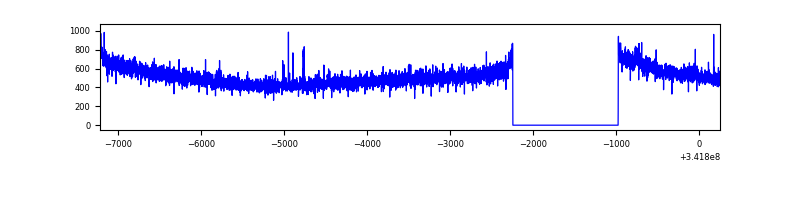 |
| D | 7472 | 6203 | 294 | 294 | 3.93% | 4.74% | 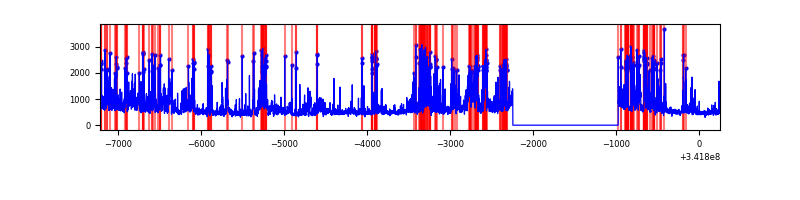 |
Top three noisy pixels from each quadrant. If the there are fewer than three noisy pixels in the level2.evt file, extra rows are filled as -1
| Pixel properties | Quadrant properties | ||||||
|---|---|---|---|---|---|---|---|
| Quadrant | DetID | PixID | Counts | Sigma | Mean | Median | Sigma |
| A | 6 | 16 | 15107 | 88.89 | 811 | 797 | 161.0 |
| A | 15 | 174 | 10345 | 59.31 | 811 | 797 | 161.0 |
| A | 13 | 254 | 9412 | 53.51 | 811 | 797 | 161.0 |
| B | 12 | 111 | 18486 | 114.87 | 815 | 795 | 154.0 |
| B | 0 | 230 | 17125 | 106.03 | 815 | 795 | 154.0 |
| B | 0 | 183 | 17039 | 105.47 | 815 | 795 | 154.0 |
| C | 14 | 238 | 126627 | 692.93 | 777 | 783 | 181.6 |
| C | 2 | 16 | 22670 | 120.51 | 777 | 783 | 181.6 |
| C | 7 | 221 | 9859 | 49.97 | 777 | 783 | 181.6 |
| D | 1 | 52 | 1094753 | 6052.73 | 760 | 741 | 180.7 |
| D | 7 | 80 | 712881 | 3939.98 | 760 | 741 | 180.7 |
| D | 2 | 250 | 98912 | 543.14 | 760 | 741 | 180.7 |
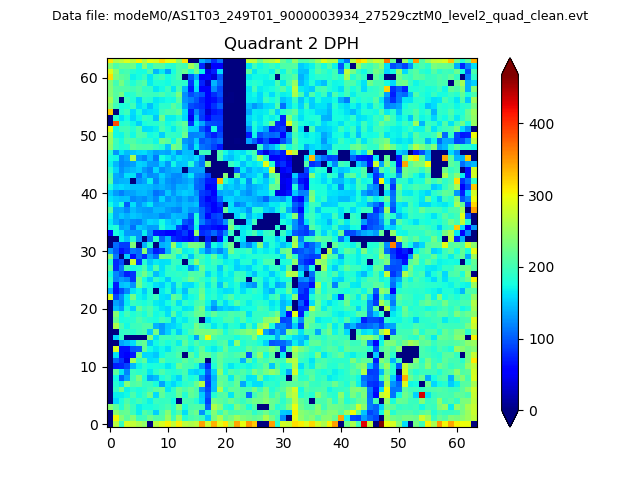
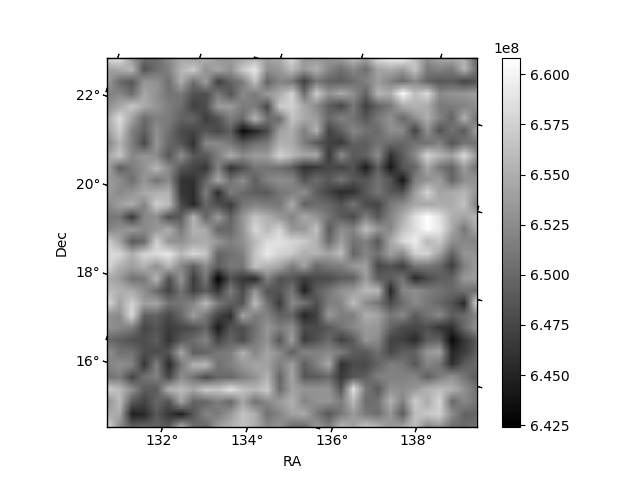
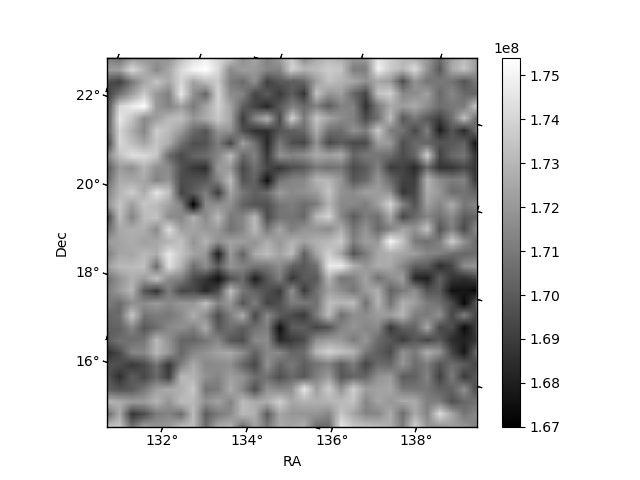
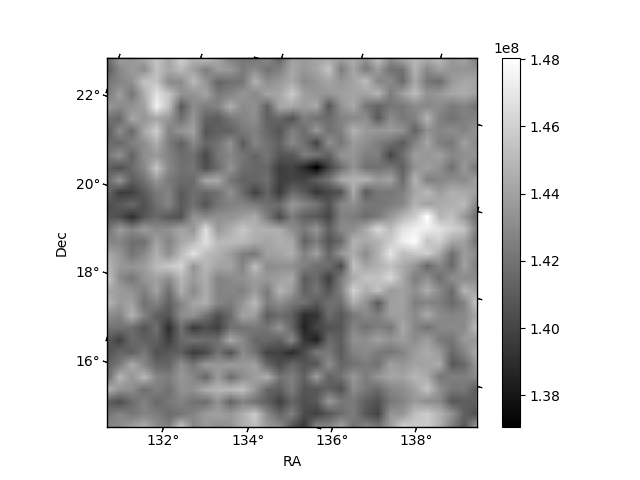
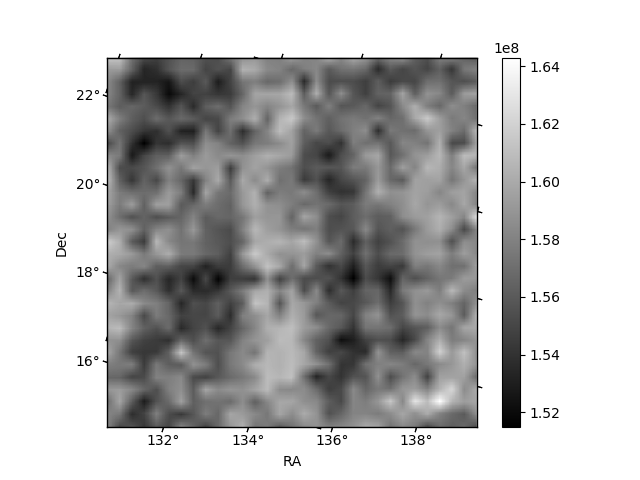
Histogram calculated using DETX and DETY for each event in the final _common_clean file
| Quadrant A | 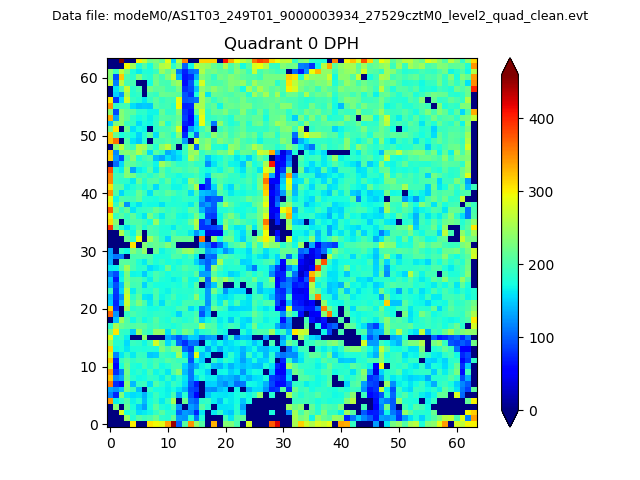 |
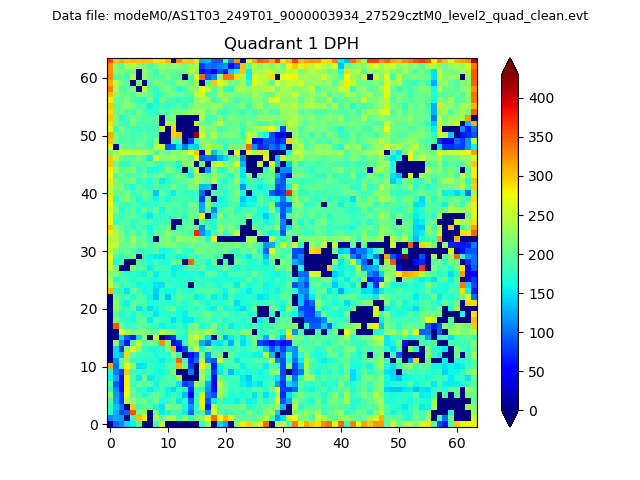 |
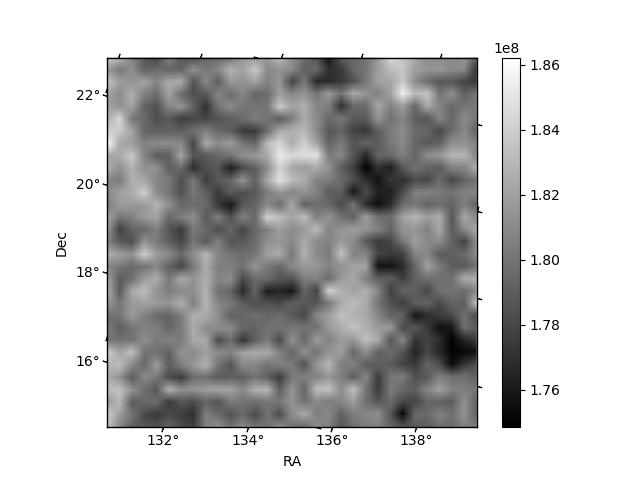
Quadrant B |
|---|---|---|---|
| Quadrant D | 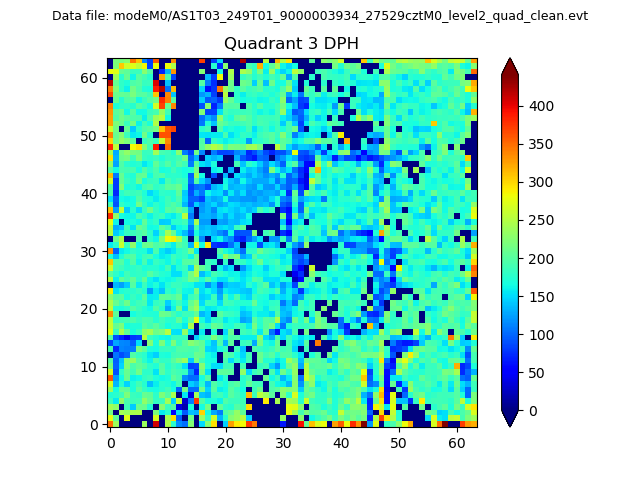 |
 |
Quadrant C |
| Plot type | Count rate plots | Images |
|---|---|---|
| Comparison with Poisson distribution Blue bars denote a histogram of data divided into 1 sec bins. Red curve is a Poisson curve with rate = median count rate of data. |
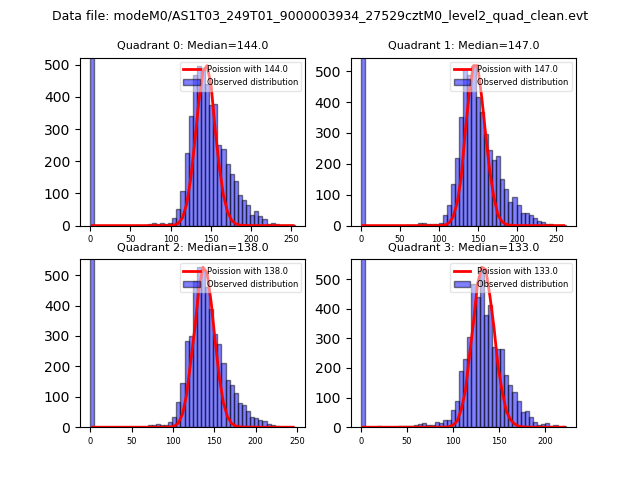 |
 |
| Quadrant-wise count rates Data is divided into 100 sec bins |
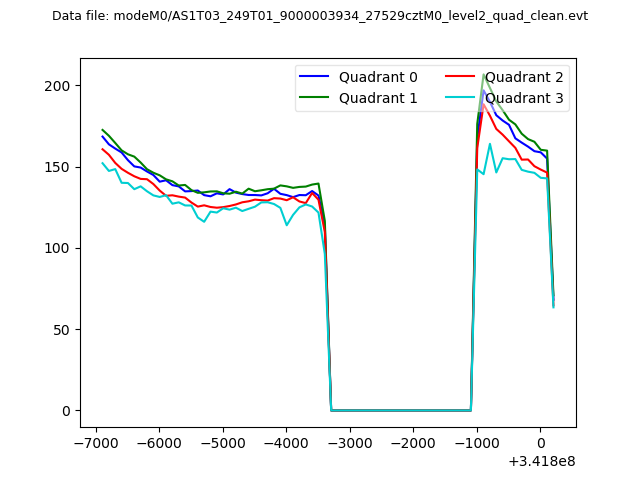 |
|
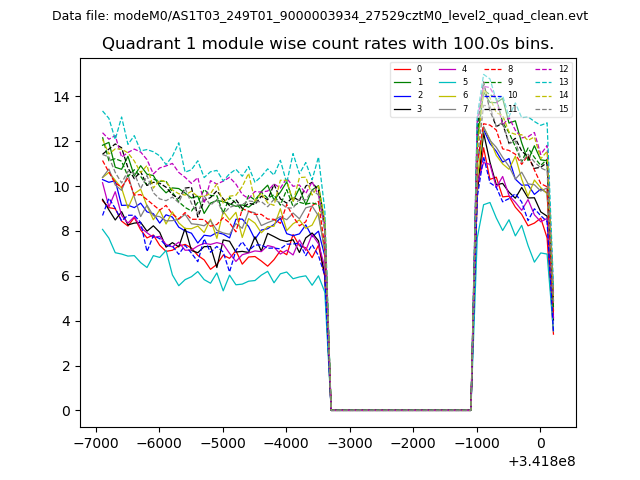
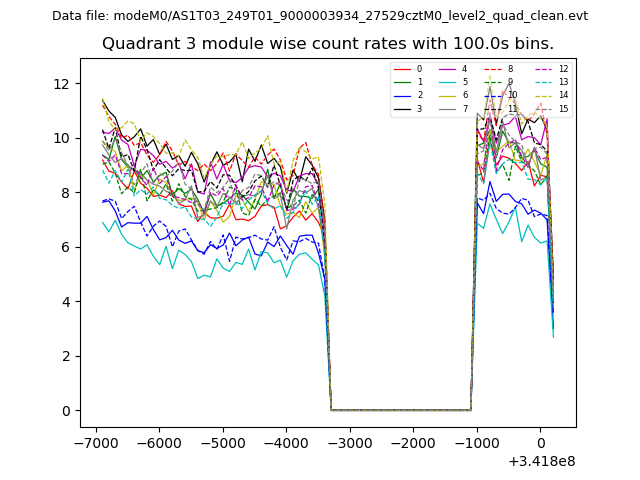
| Module-wise count rates for Quadrant A Data is divided into 100 sec bins |
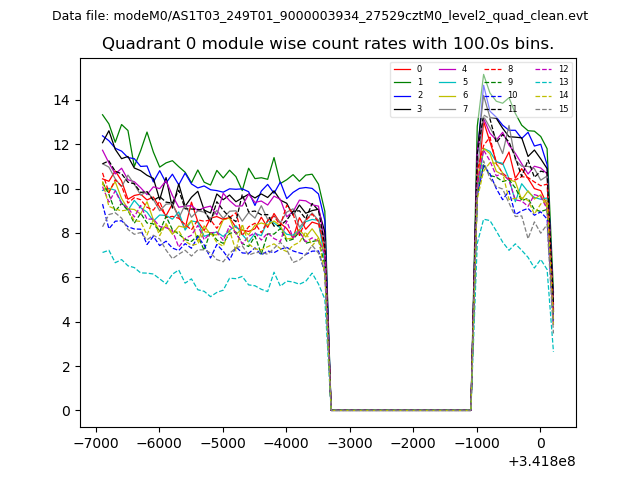 |
 |
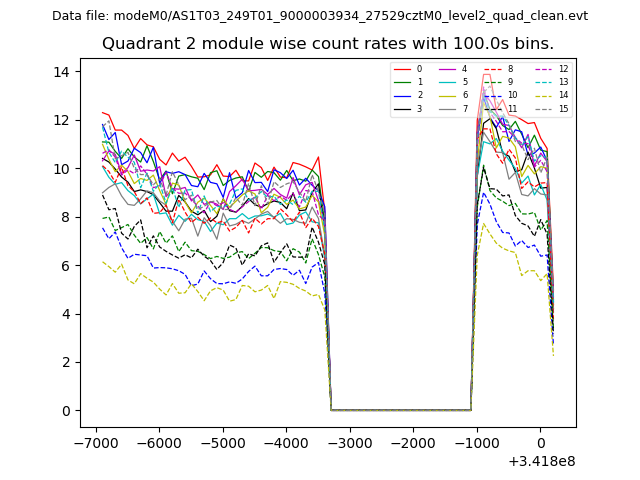
| Module-wise count rates for Quadrant B Data is divided into 100 sec bins |
 |
 |
| Module-wise count rates for Quadrant C Data is divided into 100 sec bins |
 |
 |
| Module-wise count rates for Quadrant D Data is divided into 100 sec bins |
 |
 |
| Parameter | Plot |
|---|---|
| CZT HV Monitor | 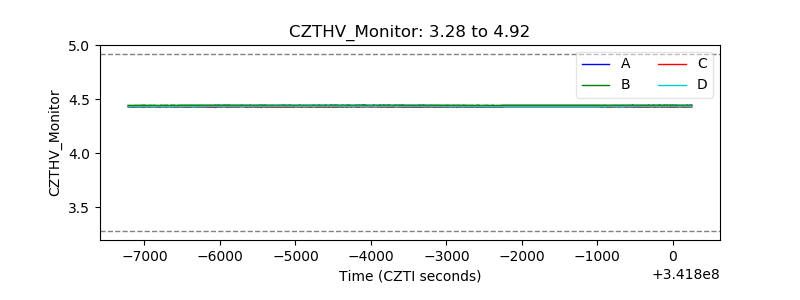 |
| D_VDD | 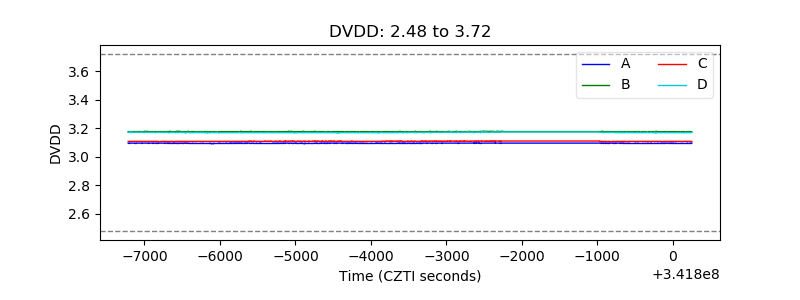 |
| Temperature 1 | 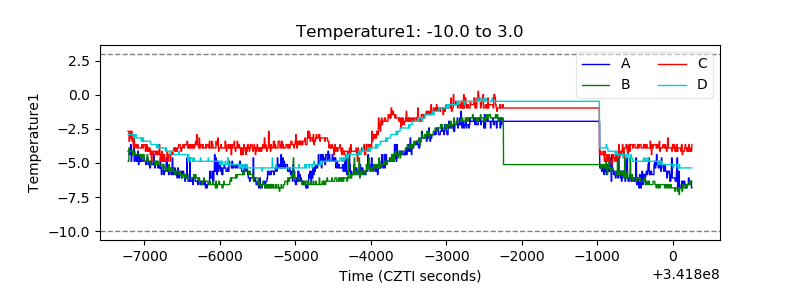 |
| Veto HV Monitor | 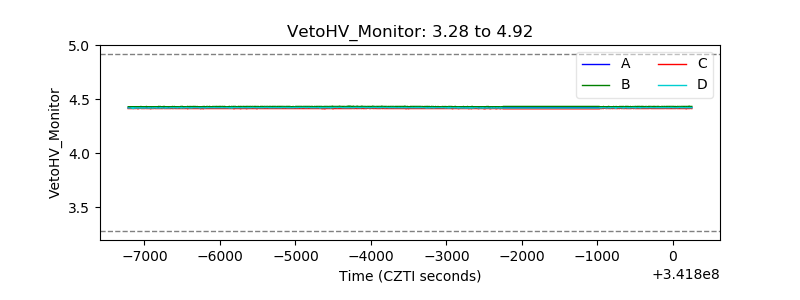 |
| Veto LLD | 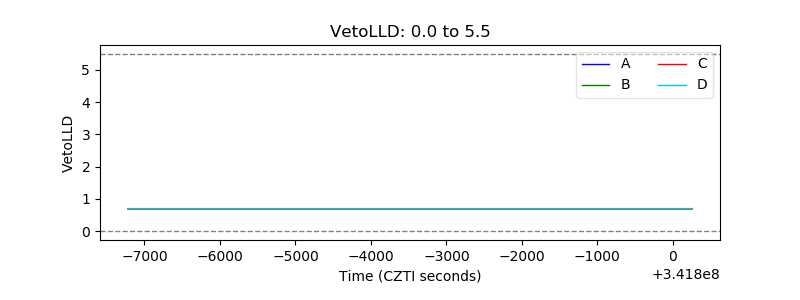 |
| Alpha Counter |  |
| _CPM_Rate | 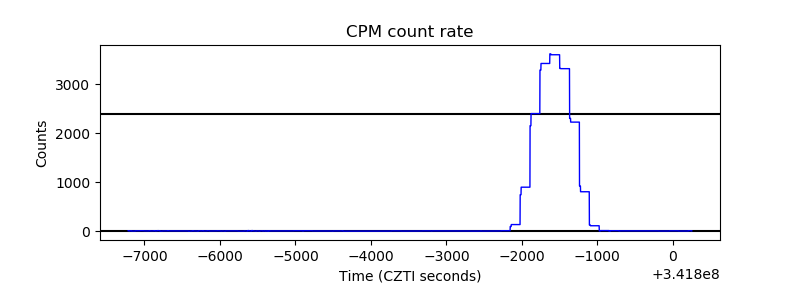 |
| CZT Counter | 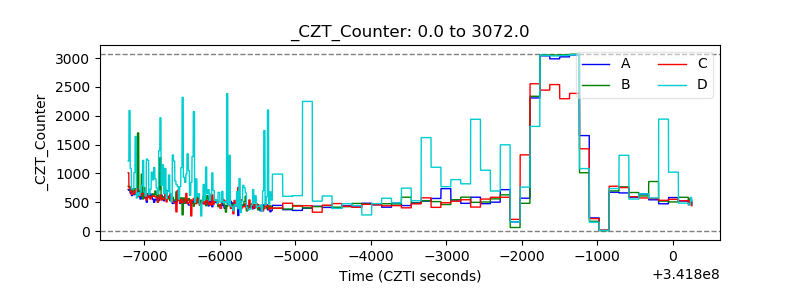 |
| +2.5 Volts monitor |  |
| +5 Volts monitor |  |
| _ROLL_ROT | 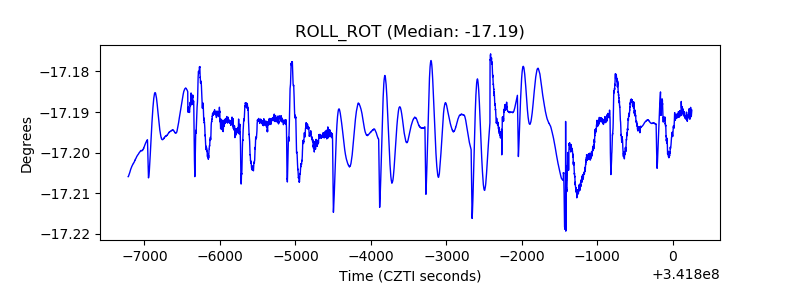 |
| _Roll_DEC | 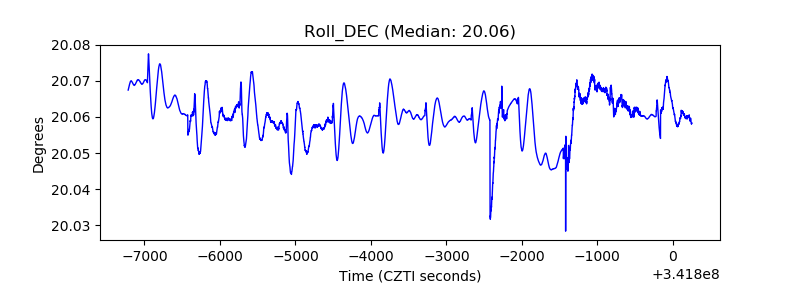 |
| _Roll_RA | 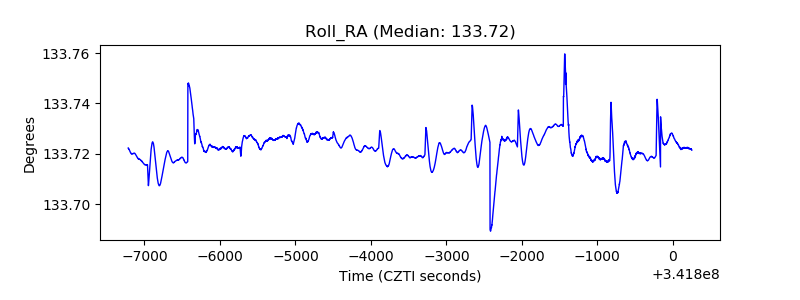 |
| Veto Counter | 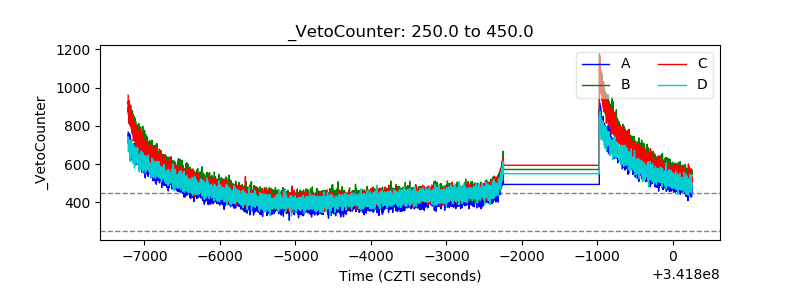 |