| Param | Original file | Final file |
|---|---|---|
| Filename | modeM0/AS1T03_249T01_9000003934_27530cztM0_level2.evt | modeM0/AS1T03_249T01_9000003934_27530cztM0_level2_quad_clean.evt |
| Size (bytes) | 498,818,880 | 119,787,840 |
| Size | 475.7 MB | 114.2 MB |
| Events in quadrant A | 3,430,989 | 815,324 |
| Events in quadrant B | 3,473,524 | 840,671 |
| Events in quadrant C | 3,411,465 | 777,549 |
| Events in quadrant D | 4,347,439 | 738,719 |
| Mode M0 | |||
|---|---|---|---|
| Quadrant | BADHDUFLAG | Total packets | Discarded packets |
| A | 0 | 14247 | 0 |
| B | 0 | 14428 | 0 |
| C | 0 | 14172 | 0 |
| D | 0 | 17220 | 0 |
| Mode M9 | |||
|---|---|---|---|
| Quadrant | BADHDUFLAG | Total packets | Discarded packets |
| A | 0 | 15 | 0 |
| B | 0 | 16 | 0 |
| C | 0 | 16 | 0 |
| D | 0 | 16 | 0 |
| Quadrant | Total seconds | Saturated seconds | Saturation percentage |
|---|---|---|---|
| A | 6531 | 19 | 0.290920% |
| B | 6531 | 28 | 0.428725% |
| C | 6530 | 54 | 0.826953% |
| D | 6530 | 197 | 3.016845% |
Noise dominated data is calculated using 1-second bins in cleaned event files. If a bin has >2000 counts, and if more than 50% of those come from <1% of pixels, then it is considered to be noise-dominated and hence unusable.
| Quadrant | # 1 sec bins | Bins with >0 counts | Bins with >2000 counts | High rate bins dominated by noise | Noise dominated (total time) | Noise dominated (detector-on time) | Marked lightcurve |
|---|---|---|---|---|---|---|---|
| A | 7881 | 6532 | 3 | 3 | 0.04% | 0.05% | 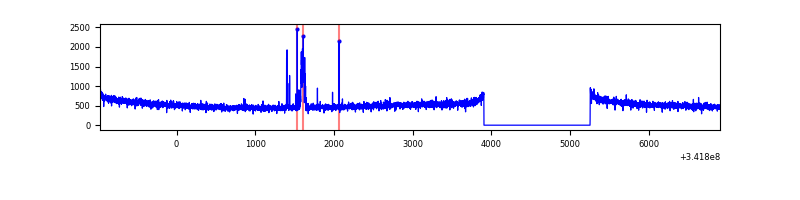 |
| B | 7881 | 6532 | 0 | 0 | 0.00% | 0.00% | 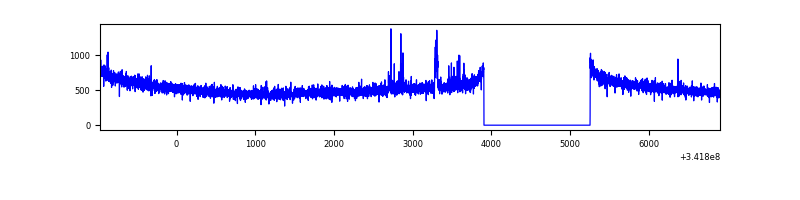 |
| C | 7880 | 6531 | 0 | 0 | 0.00% | 0.00% | 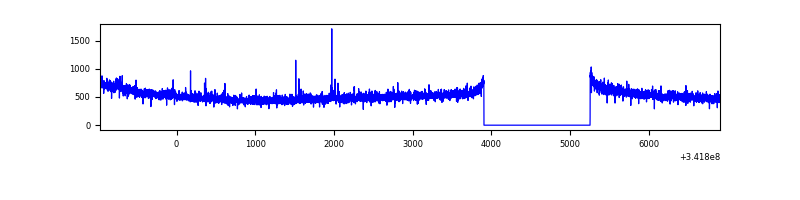 |
| D | 7880 | 6531 | 184 | 184 | 2.34% | 2.82% | 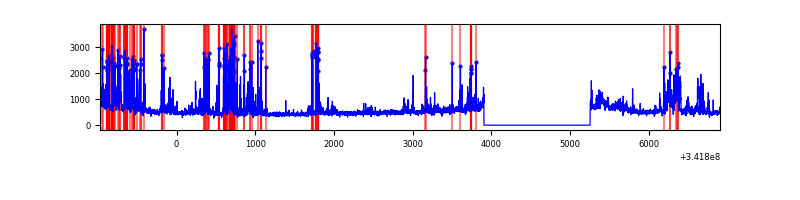 |
Top three noisy pixels from each quadrant. If the there are fewer than three noisy pixels in the level2.evt file, extra rows are filled as -1
| Pixel properties | Quadrant properties | ||||||
|---|---|---|---|---|---|---|---|
| Quadrant | DetID | PixID | Counts | Sigma | Mean | Median | Sigma |
| A | 15 | 174 | 77507 | 444.93 | 869 | 855 | 172.3 |
| A | 13 | 254 | 10637 | 56.78 | 869 | 855 | 172.3 |
| A | 3 | 137 | 7707 | 39.77 | 869 | 855 | 172.3 |
| B | 15 | 32 | 26806 | 158.33 | 875 | 855 | 163.9 |
| B | 12 | 111 | 19631 | 114.55 | 875 | 855 | 163.9 |
| B | 0 | 230 | 17518 | 101.66 | 875 | 855 | 163.9 |
| C | 14 | 238 | 135920 | 695.74 | 832 | 839 | 194.2 |
| C | 2 | 16 | 31120 | 155.96 | 832 | 839 | 194.2 |
| C | 13 | 61 | 5668 | 24.87 | 832 | 839 | 194.2 |
| D | 1 | 52 | 567742 | 2938.83 | 818 | 797 | 192.9 |
| D | 7 | 80 | 416141 | 2152.98 | 818 | 797 | 192.9 |
| D | 2 | 250 | 98768 | 507.84 | 818 | 797 | 192.9 |
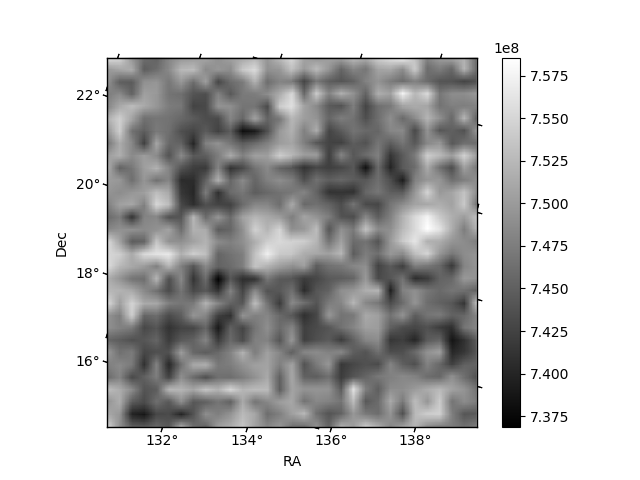
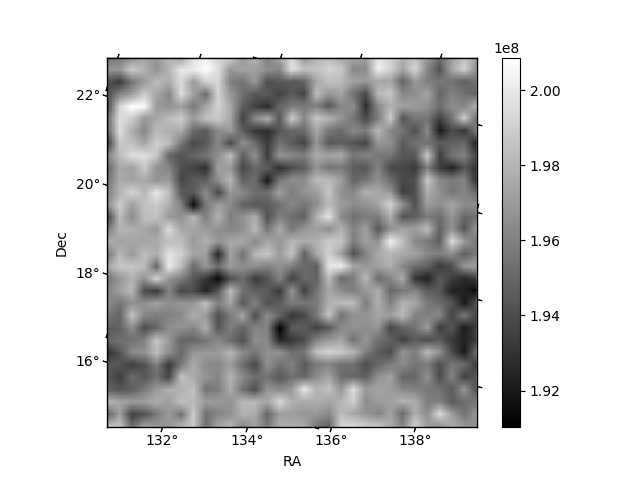
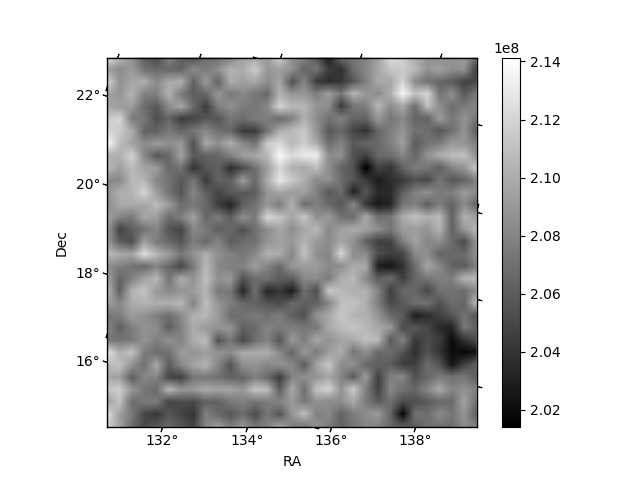
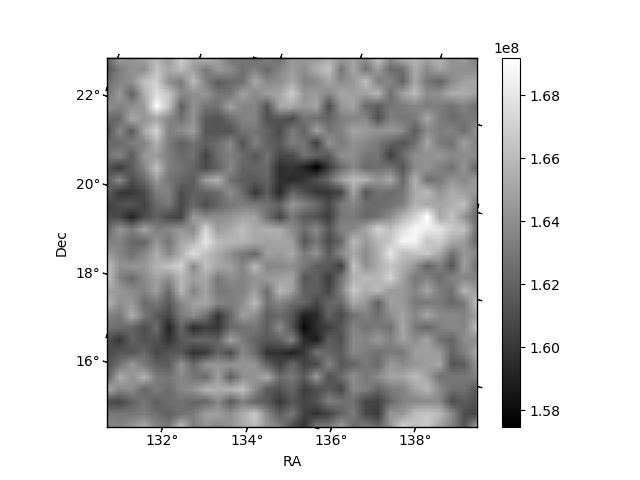
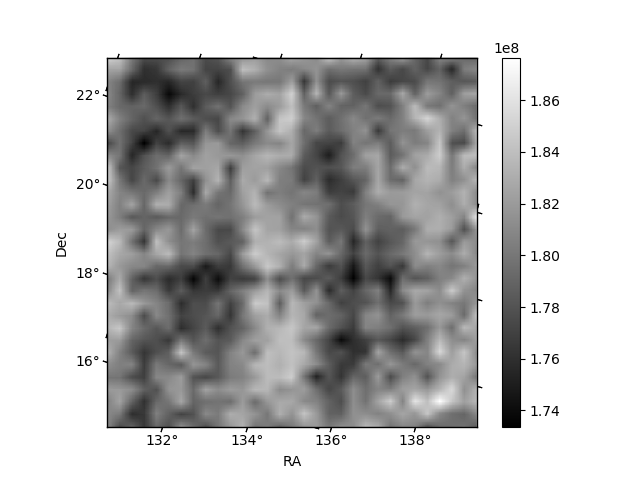
Histogram calculated using DETX and DETY for each event in the final _common_clean file
| Quadrant A | 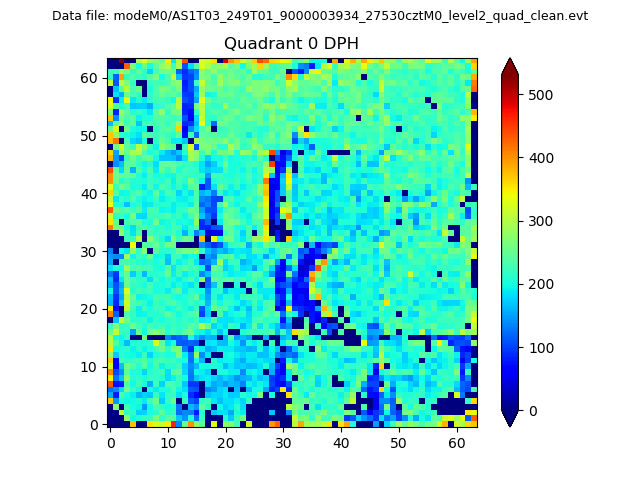 |
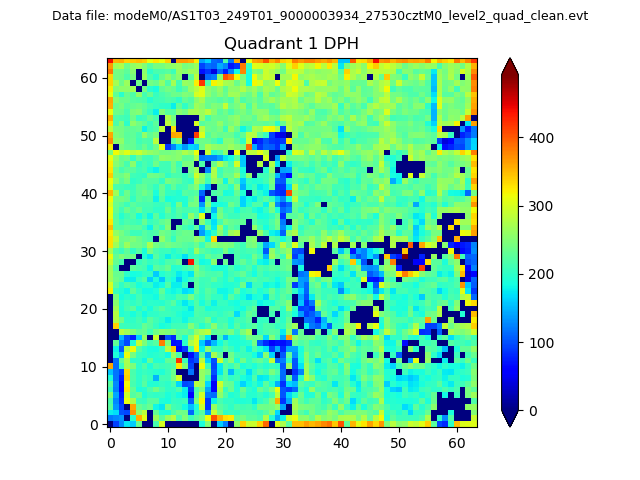 |
Quadrant B |
|---|---|---|---|
| Quadrant D | 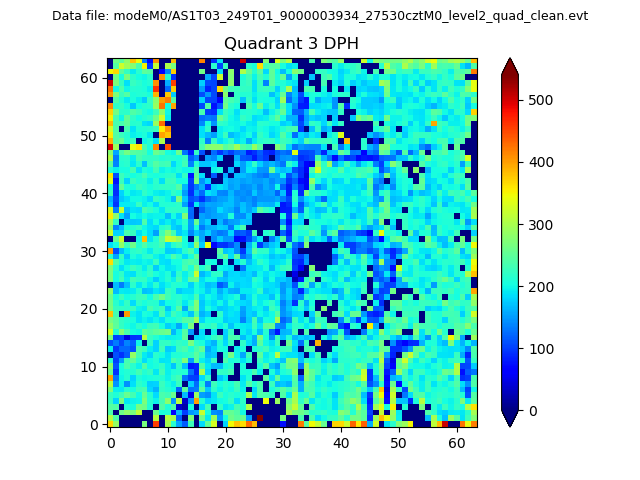 |
 |
Quadrant C |
| Plot type | Count rate plots | Images |
|---|---|---|
| Comparison with Poisson distribution Blue bars denote a histogram of data divided into 1 sec bins. Red curve is a Poisson curve with rate = median count rate of data. |
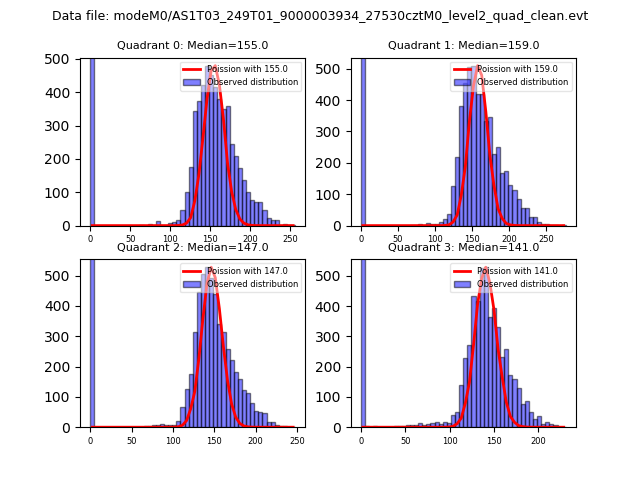 |
 |
| Quadrant-wise count rates Data is divided into 100 sec bins |
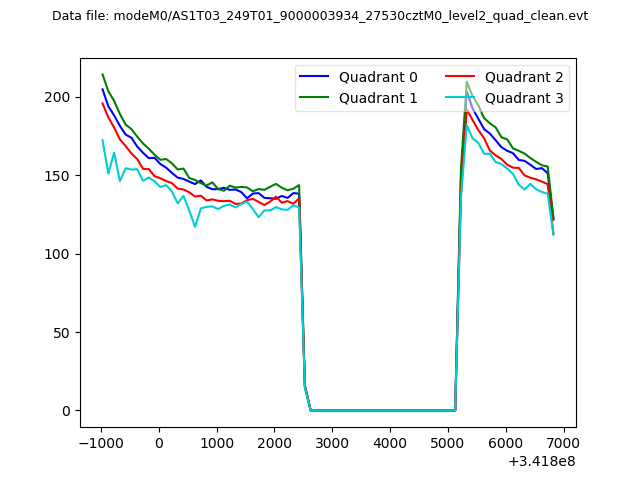 |
|
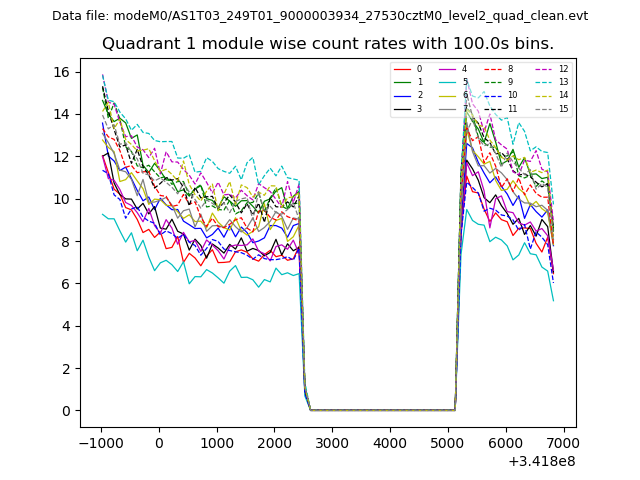
| Module-wise count rates for Quadrant A Data is divided into 100 sec bins |
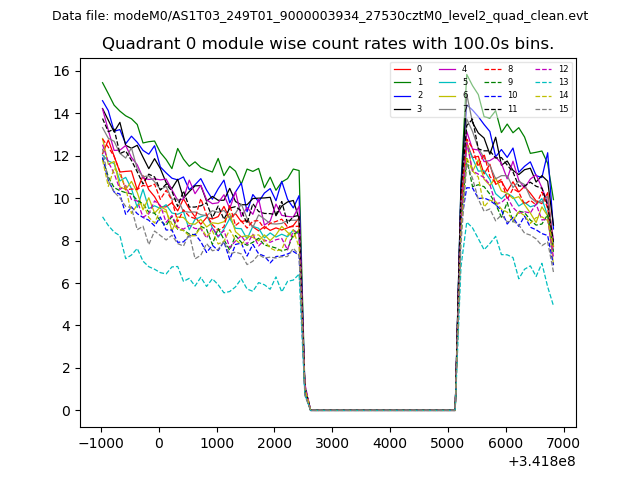 |
 |
| Module-wise count rates for Quadrant B Data is divided into 100 sec bins |
 |
 |
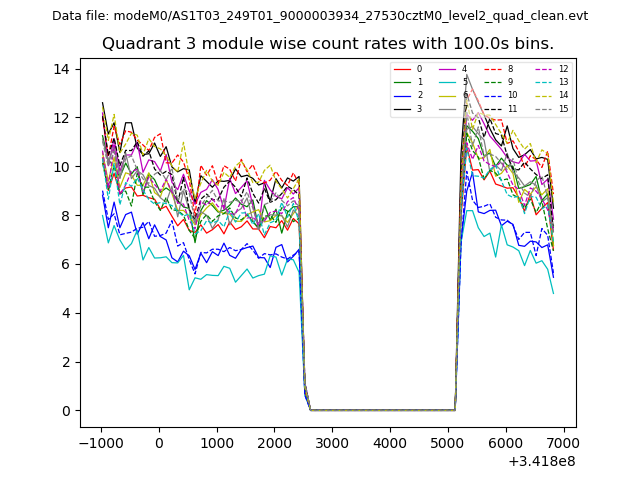
| Module-wise count rates for Quadrant C Data is divided into 100 sec bins |
 |
 |
| Module-wise count rates for Quadrant D Data is divided into 100 sec bins |
 |
 |
| Parameter | Plot |
|---|---|
| CZT HV Monitor | 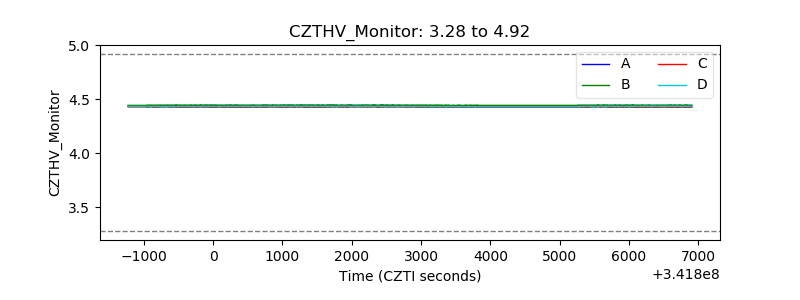 |
| D_VDD | 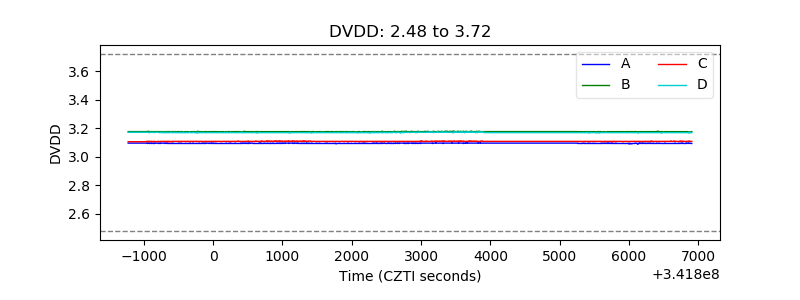 |
| Temperature 1 | 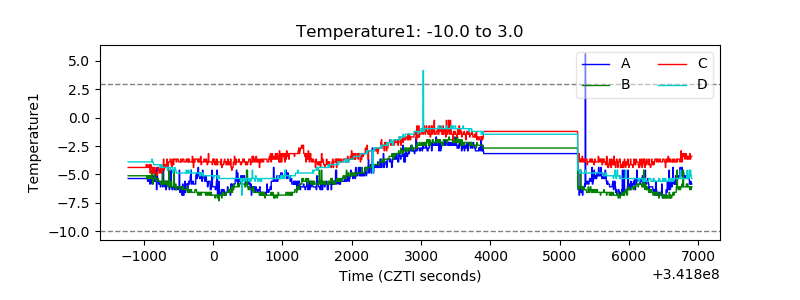 |
| Veto HV Monitor |  |
| Veto LLD | 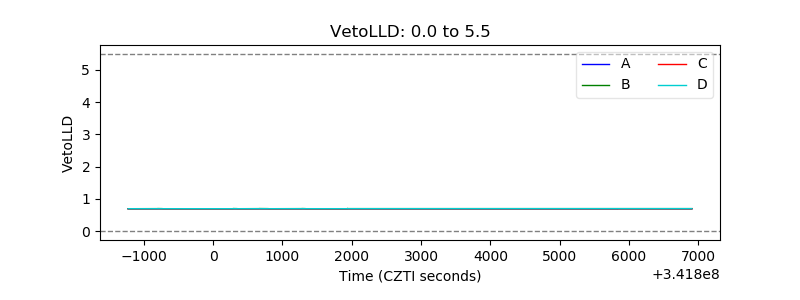 |
| Alpha Counter |  |
| _CPM_Rate | 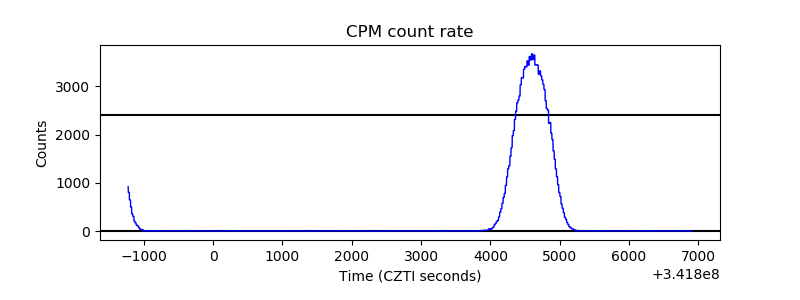 |
| CZT Counter | 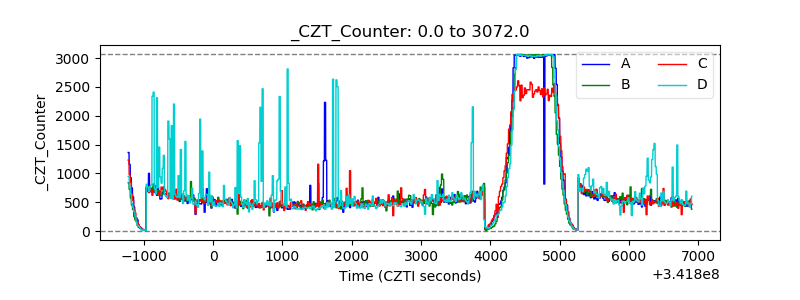 |
| +2.5 Volts monitor |  |
| +5 Volts monitor |  |
| _ROLL_ROT | 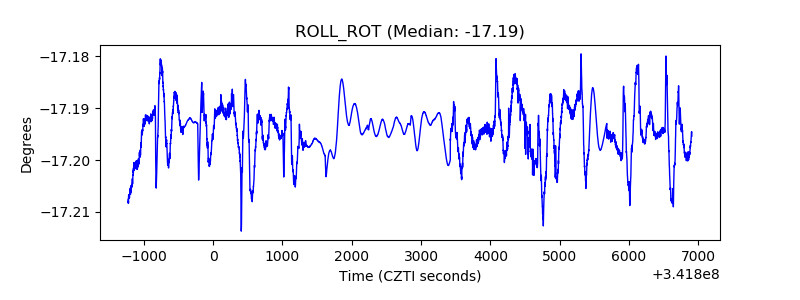 |
| _Roll_DEC | 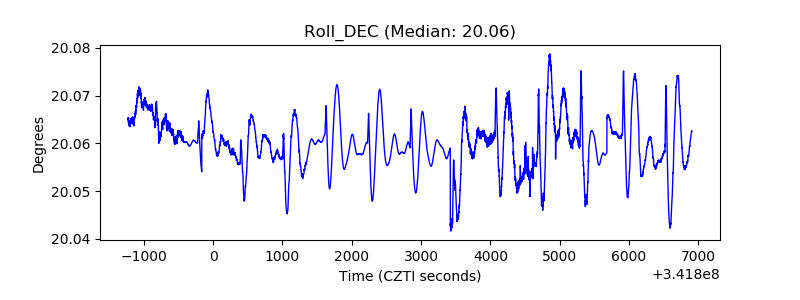 |
| _Roll_RA |  |
| Veto Counter | 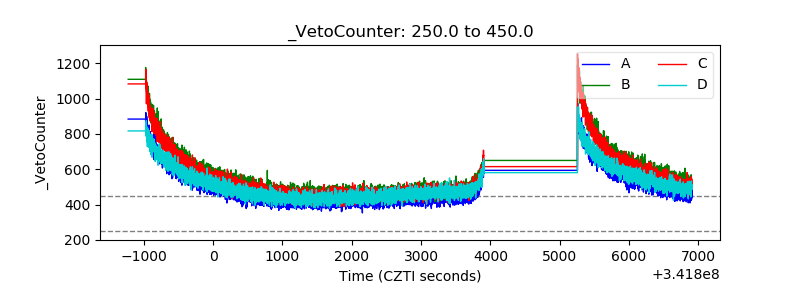 |