| Param | Original file | Final file |
|---|---|---|
| Filename | modeM0/AS1T03_249T01_9000003934_27531cztM0_level2.evt | modeM0/AS1T03_249T01_9000003934_27531cztM0_level2_quad_clean.evt |
| Size (bytes) | 502,266,240 | 112,449,600 |
| Size | 479.0 MB | 107.2 MB |
| Events in quadrant A | 3,371,121 | 758,656 |
| Events in quadrant B | 3,492,160 | 779,306 |
| Events in quadrant C | 3,413,073 | 721,022 |
| Events in quadrant D | 4,494,100 | 693,601 |
| Mode M0 | |||
|---|---|---|---|
| Quadrant | BADHDUFLAG | Total packets | Discarded packets |
| A | 0 | 13867 | 0 |
| B | 0 | 14333 | 0 |
| C | 0 | 14050 | 0 |
| D | 0 | 17761 | 0 |
| Mode M9 | |||
|---|---|---|---|
| Quadrant | BADHDUFLAG | Total packets | Discarded packets |
| A | 0 | 18 | 0 |
| B | 0 | 19 | 0 |
| C | 0 | 19 | 0 |
| D | 0 | 19 | 0 |
| Quadrant | Total seconds | Saturated seconds | Saturation percentage |
|---|---|---|---|
| A | 6499 | 33 | 0.507770% |
| B | 6499 | 52 | 0.800123% |
| C | 6499 | 83 | 1.277120% |
| D | 6499 | 84 | 1.292507% |
Noise dominated data is calculated using 1-second bins in cleaned event files. If a bin has >2000 counts, and if more than 50% of those come from <1% of pixels, then it is considered to be noise-dominated and hence unusable.
| Quadrant | # 1 sec bins | Bins with >0 counts | Bins with >2000 counts | High rate bins dominated by noise | Noise dominated (total time) | Noise dominated (detector-on time) | Marked lightcurve |
|---|---|---|---|---|---|---|---|
| A | 7859 | 6499 | 0 | 0 | 0.00% | 0.00% | 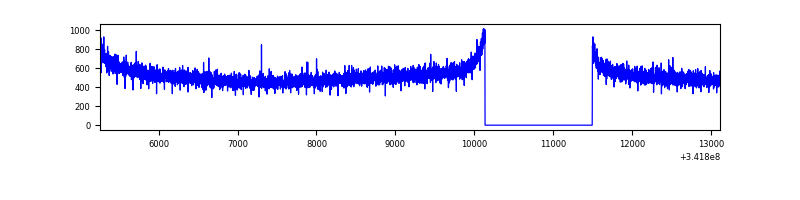 |
| B | 7859 | 6499 | 0 | 0 | 0.00% | 0.00% | 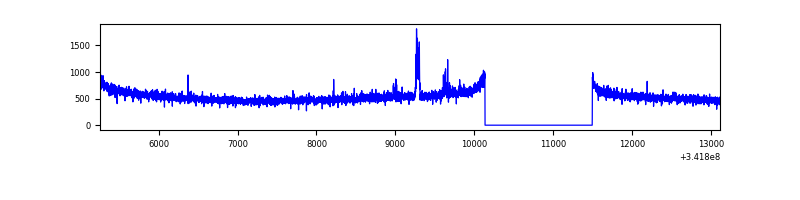 |
| C | 7859 | 6499 | 2 | 2 | 0.03% | 0.03% | 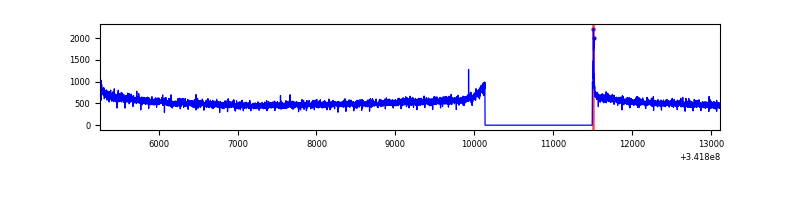 |
| D | 7859 | 6500 | 67 | 67 | 0.85% | 1.03% | 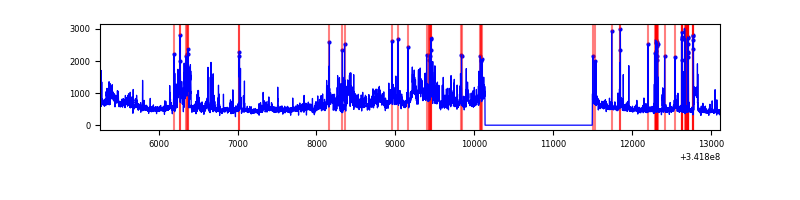 |
Top three noisy pixels from each quadrant. If the there are fewer than three noisy pixels in the level2.evt file, extra rows are filled as -1
| Pixel properties | Quadrant properties | ||||||
|---|---|---|---|---|---|---|---|
| Quadrant | DetID | PixID | Counts | Sigma | Mean | Median | Sigma |
| A | 13 | 254 | 10563 | 56.04 | 875 | 862 | 173.1 |
| A | 3 | 137 | 7630 | 39.1 | 875 | 862 | 173.1 |
| A | 0 | 226 | 7511 | 38.41 | 875 | 862 | 173.1 |
| B | 15 | 32 | 41453 | 250.0 | 874 | 855 | 162.4 |
| B | 12 | 111 | 19363 | 113.97 | 874 | 855 | 162.4 |
| B | 11 | 111 | 17403 | 101.9 | 874 | 855 | 162.4 |
| C | 14 | 238 | 138439 | 708.5 | 834 | 840 | 194.2 |
| C | 2 | 16 | 17050 | 83.47 | 834 | 840 | 194.2 |
| C | 1 | 16 | 8447 | 39.17 | 834 | 840 | 194.2 |
| D | 12 | 227 | 596521 | 3028.55 | 828 | 808 | 196.7 |
| D | 1 | 52 | 429868 | 2181.3 | 828 | 808 | 196.7 |
| D | 7 | 80 | 251486 | 1274.42 | 828 | 808 | 196.7 |
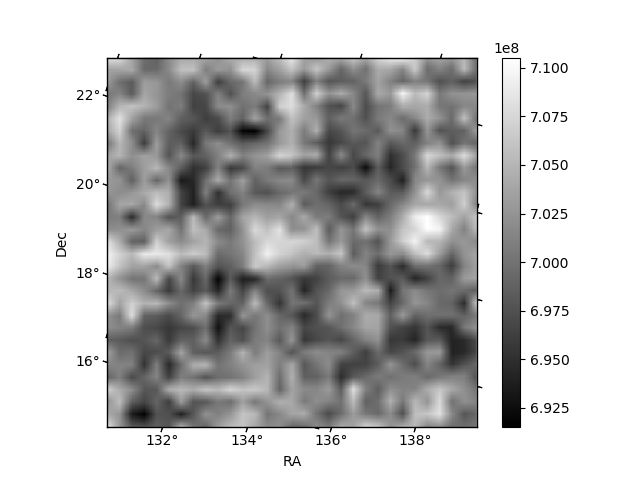
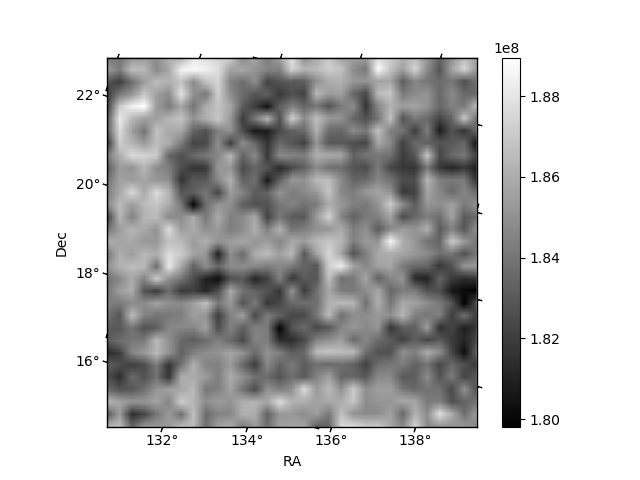
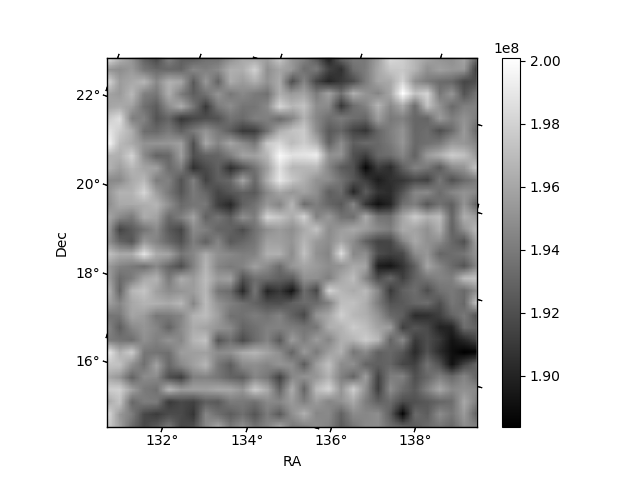
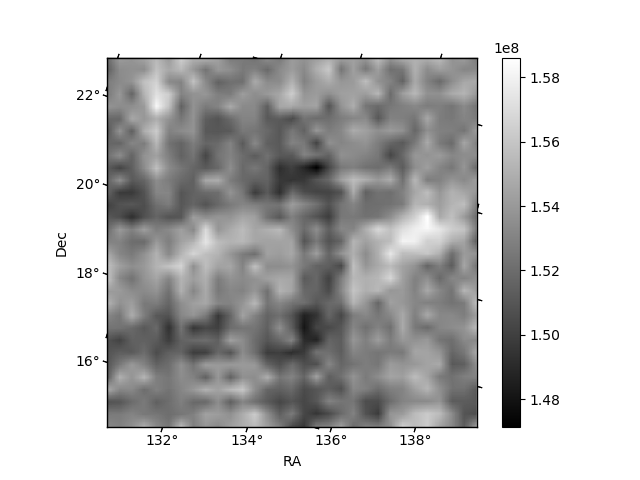
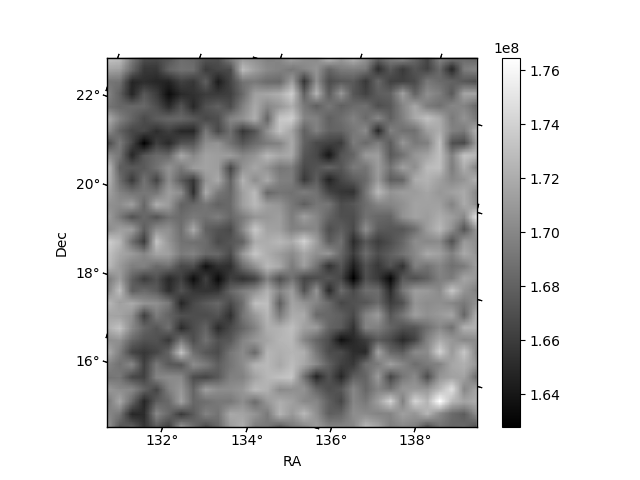
Histogram calculated using DETX and DETY for each event in the final _common_clean file
| Quadrant A | 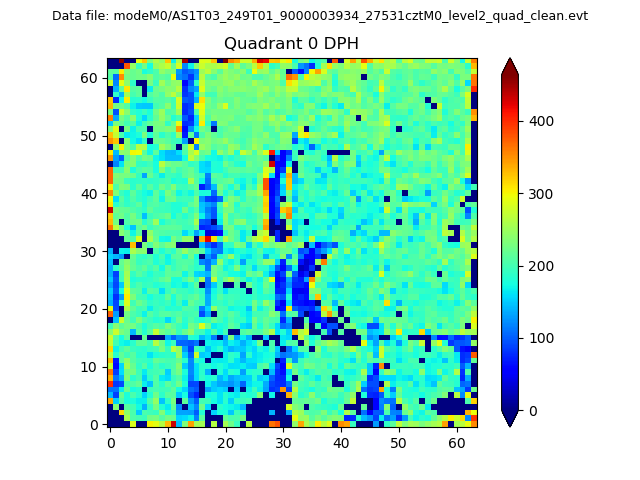 |
 |
Quadrant B |
|---|---|---|---|
| Quadrant D | 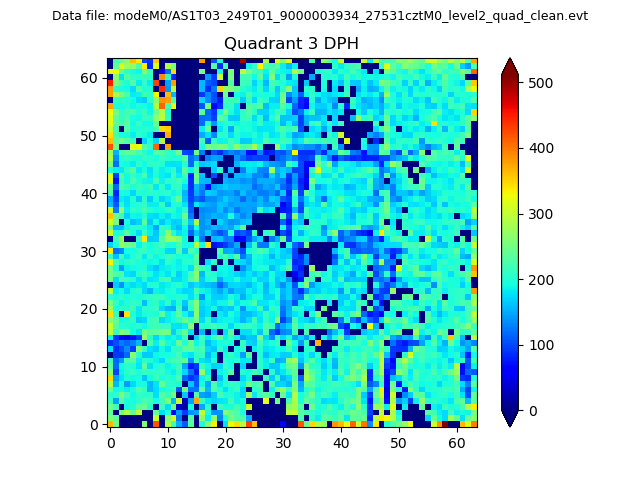 |
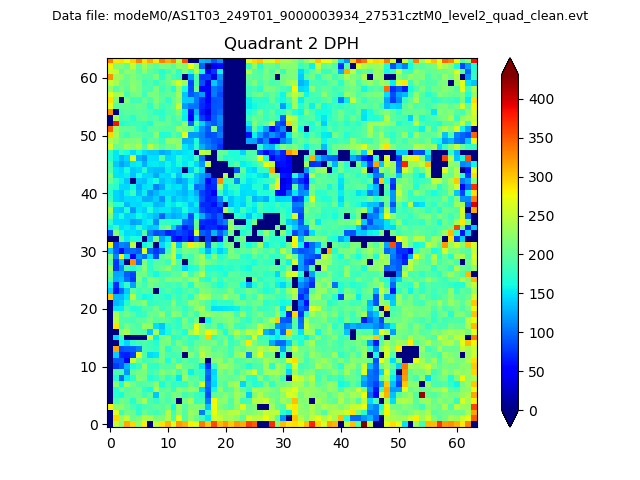 |
Quadrant C |
| Plot type | Count rate plots | Images |
|---|---|---|
| Comparison with Poisson distribution Blue bars denote a histogram of data divided into 1 sec bins. Red curve is a Poisson curve with rate = median count rate of data. |
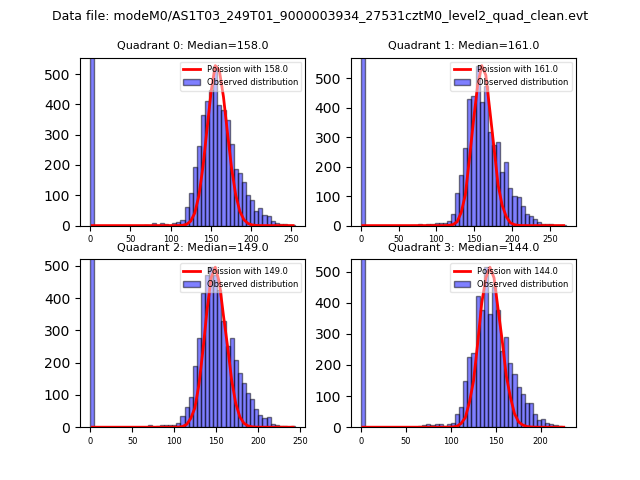 |
 |
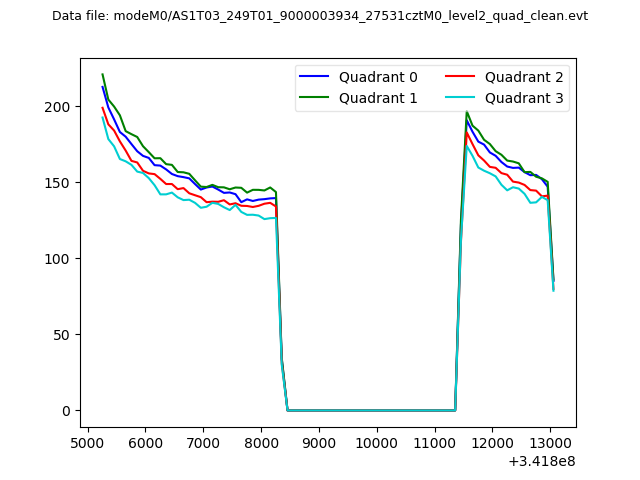
| Quadrant-wise count rates Data is divided into 100 sec bins |
 |
|
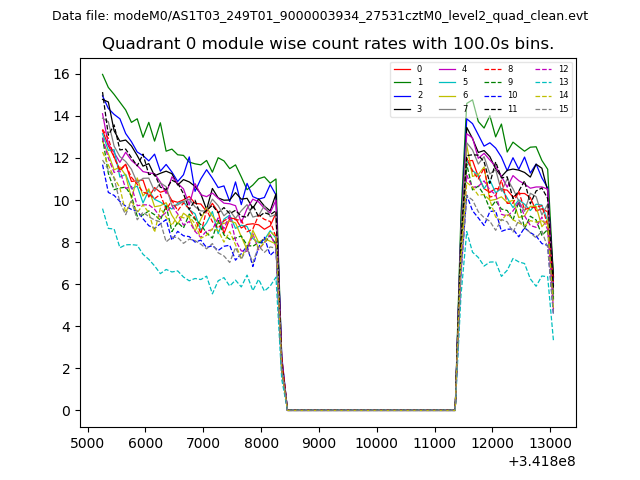
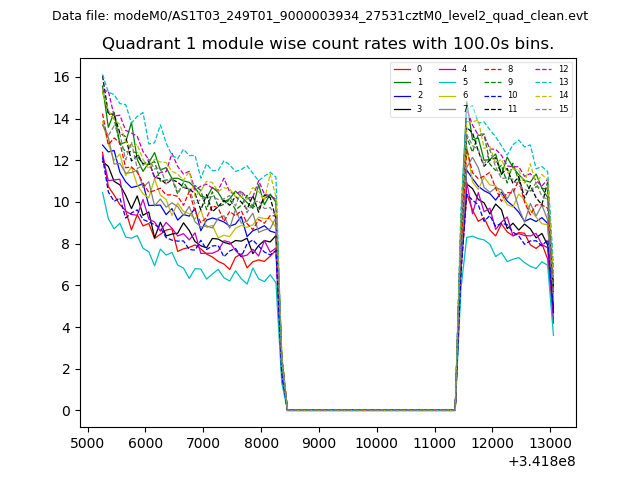
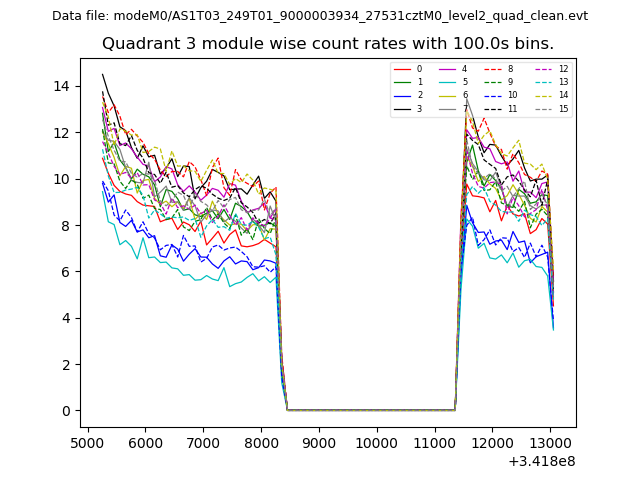
| Module-wise count rates for Quadrant A Data is divided into 100 sec bins |
 |
 |
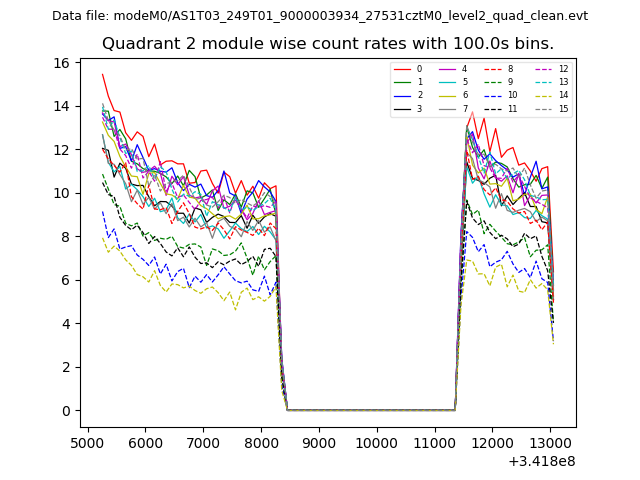
| Module-wise count rates for Quadrant B Data is divided into 100 sec bins |
 |
 |
| Module-wise count rates for Quadrant C Data is divided into 100 sec bins |
 |
 |
| Module-wise count rates for Quadrant D Data is divided into 100 sec bins |
 |
 |
| Parameter | Plot |
|---|---|
| CZT HV Monitor | 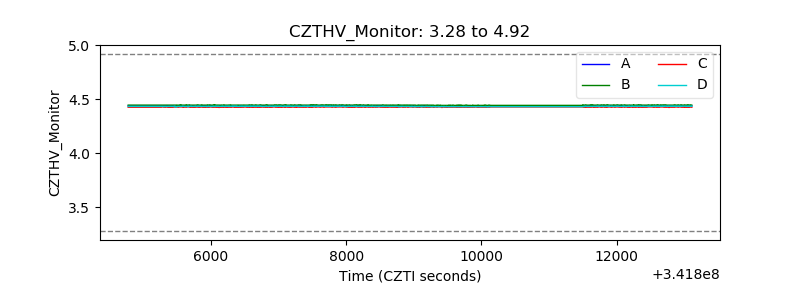 |
| D_VDD | 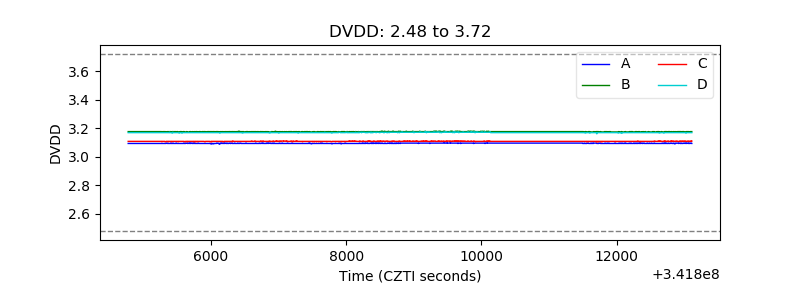 |
| Temperature 1 | 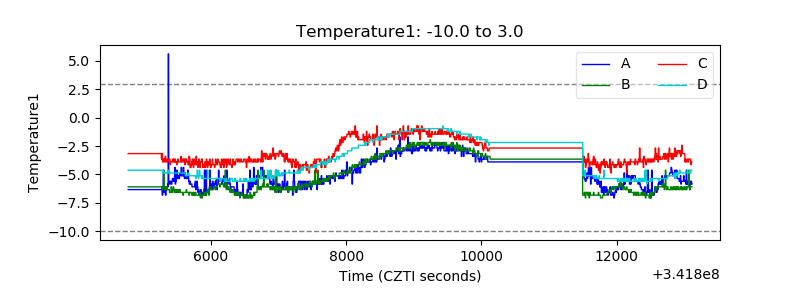 |
| Veto HV Monitor |  |
| Veto LLD |  |
| Alpha Counter | 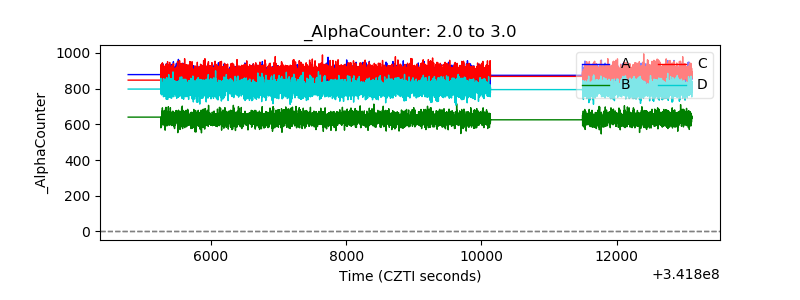 |
| _CPM_Rate | 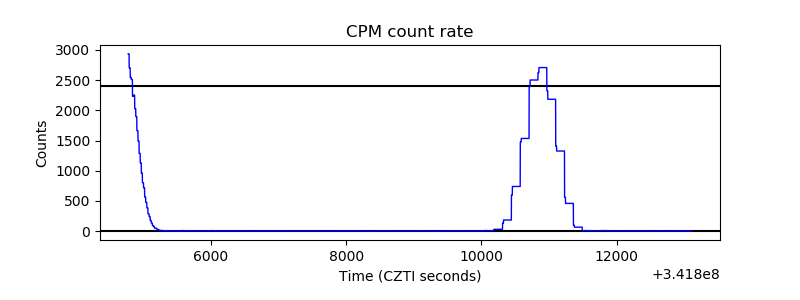 |
| CZT Counter | 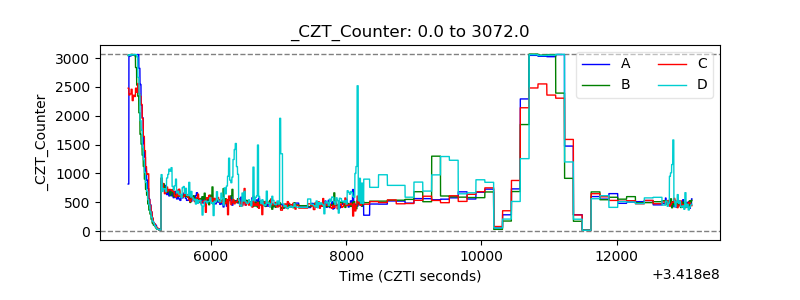 |
| +2.5 Volts monitor |  |
| +5 Volts monitor | 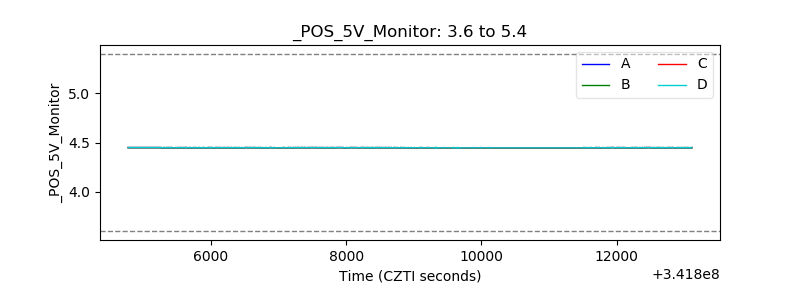 |
| _ROLL_ROT | 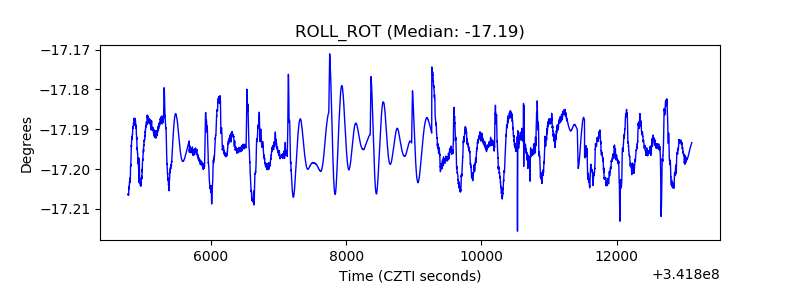 |
| _Roll_DEC | 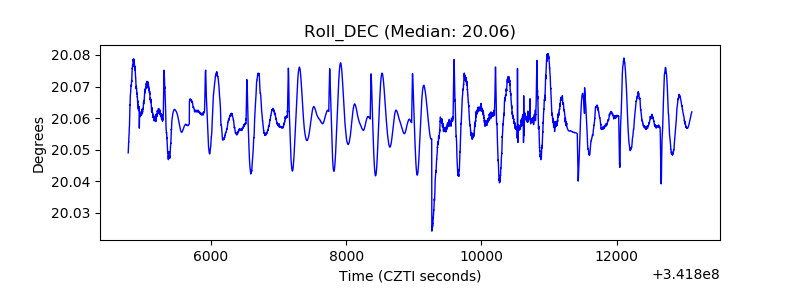 |
| _Roll_RA | 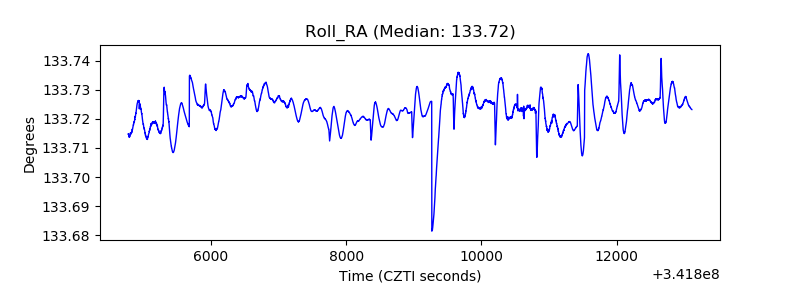 |
| Veto Counter | 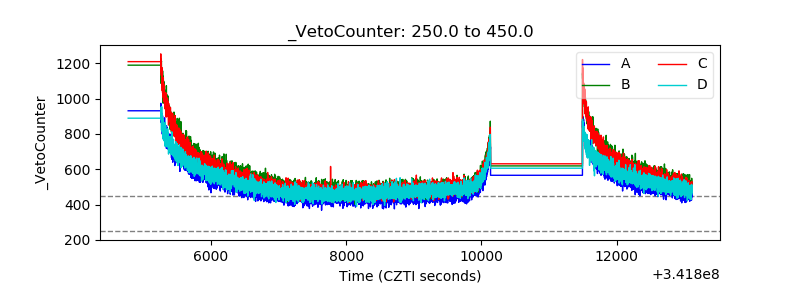 |