| Param | Original file | Final file |
|---|---|---|
| Filename | modeM0/AS1T03_249T01_9000003934_27532cztM0_level2.evt | modeM0/AS1T03_249T01_9000003934_27532cztM0_level2_quad_clean.evt |
| Size (bytes) | 821,185,920 | 151,574,400 |
| Size | 783.1 MB | 144.6 MB |
| Events in quadrant A | 5,350,018 | 996,035 |
| Events in quadrant B | 6,509,525 | 997,688 |
| Events in quadrant C | 5,364,256 | 953,730 |
| Events in quadrant D | 6,936,899 | 917,186 |
| Mode M0 | |||
|---|---|---|---|
| Quadrant | BADHDUFLAG | Total packets | Discarded packets |
| A | 0 | 22055 | 0 |
| B | 0 | 25703 | 0 |
| C | 0 | 22186 | 0 |
| D | 0 | 27675 | 0 |
| Mode M9 | |||
|---|---|---|---|
| Quadrant | BADHDUFLAG | Total packets | Discarded packets |
| A | 0 | 27 | 0 |
| B | 0 | 27 | 0 |
| C | 0 | 27 | 0 |
| D | 0 | 27 | 0 |
| Quadrant | Total seconds | Saturated seconds | Saturation percentage |
|---|---|---|---|
| A | 10490 | 59 | 0.562440% |
| B | 10491 | 424 | 4.041559% |
| C | 10491 | 124 | 1.181965% |
| D | 10491 | 202 | 1.925460% |
Noise dominated data is calculated using 1-second bins in cleaned event files. If a bin has >2000 counts, and if more than 50% of those come from <1% of pixels, then it is considered to be noise-dominated and hence unusable.
| Quadrant | # 1 sec bins | Bins with >0 counts | Bins with >2000 counts | High rate bins dominated by noise | Noise dominated (total time) | Noise dominated (detector-on time) | Marked lightcurve |
|---|---|---|---|---|---|---|---|
| A | 13190 | 10491 | 9 | 9 | 0.07% | 0.09% | 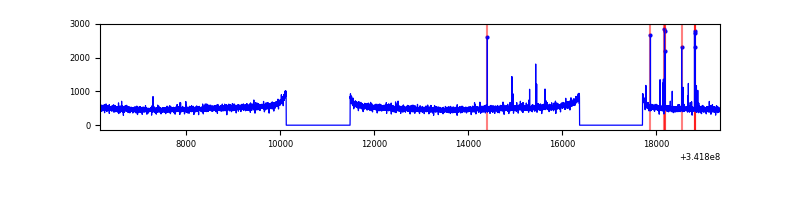 |
| B | 13191 | 10492 | 313 | 313 | 2.37% | 2.98% | 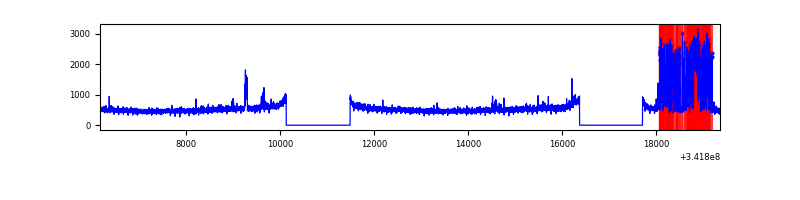 |
| C | 13191 | 10491 | 2 | 2 | 0.02% | 0.02% | 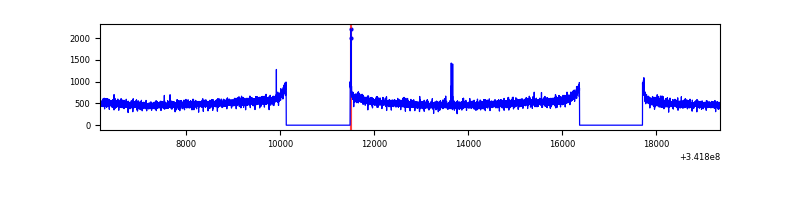 |
| D | 13191 | 10493 | 184 | 184 | 1.39% | 1.75% | 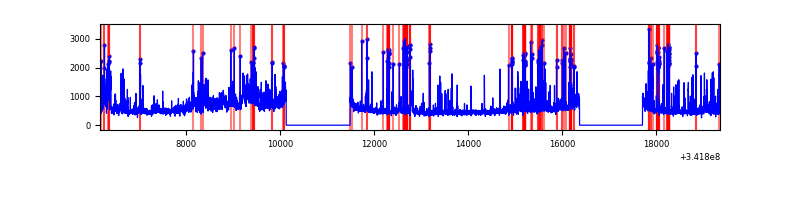 |
Top three noisy pixels from each quadrant. If the there are fewer than three noisy pixels in the level2.evt file, extra rows are filled as -1
| Pixel properties | Quadrant properties | ||||||
|---|---|---|---|---|---|---|---|
| Quadrant | DetID | PixID | Counts | Sigma | Mean | Median | Sigma |
| A | 6 | 16 | 38481 | 136.65 | 1378 | 1357 | 271.7 |
| A | 13 | 254 | 17193 | 58.29 | 1378 | 1357 | 271.7 |
| A | 3 | 137 | 12409 | 40.68 | 1378 | 1357 | 271.7 |
| B | 10 | 245 | 1094849 | 4289.3 | 1357 | 1327 | 254.9 |
| B | 15 | 32 | 42231 | 160.44 | 1357 | 1327 | 254.9 |
| B | 12 | 111 | 30593 | 114.79 | 1357 | 1327 | 254.9 |
| C | 14 | 238 | 216293 | 706.76 | 1311 | 1320 | 304.2 |
| C | 2 | 16 | 23578 | 73.18 | 1311 | 1320 | 304.2 |
| C | 1 | 16 | 19130 | 58.55 | 1311 | 1320 | 304.2 |
| D | 1 | 52 | 1063775 | 3434.83 | 1311 | 1279 | 309.3 |
| D | 12 | 227 | 517767 | 1669.7 | 1311 | 1279 | 309.3 |
| D | 7 | 80 | 258660 | 832.06 | 1311 | 1279 | 309.3 |
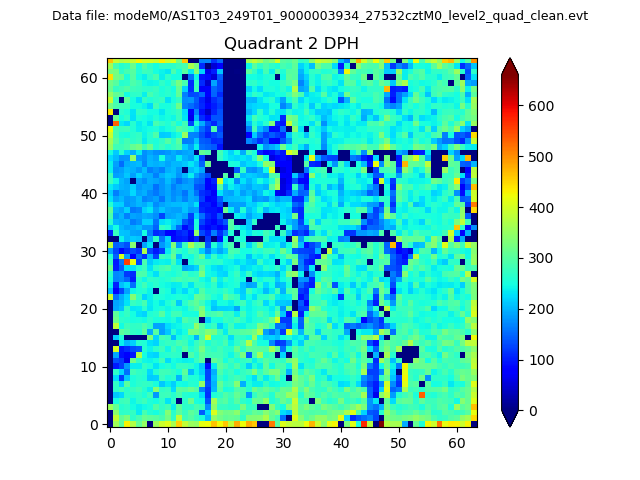
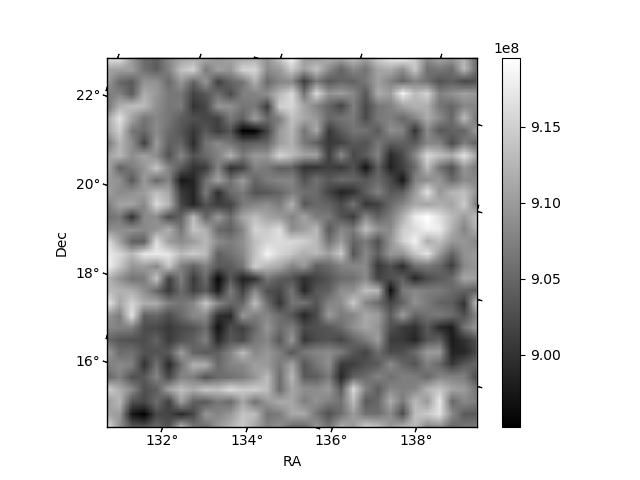
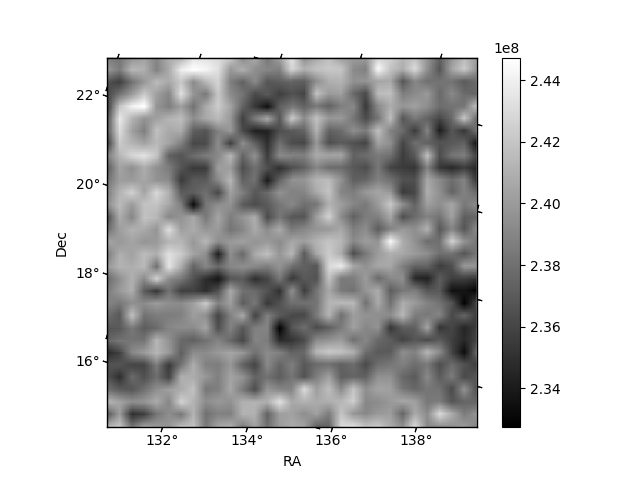
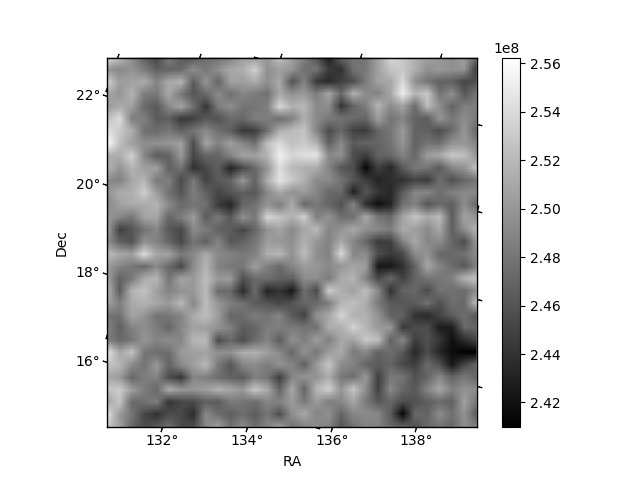
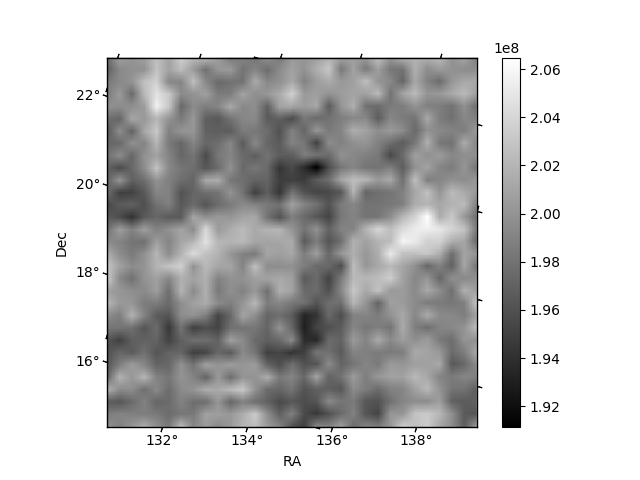
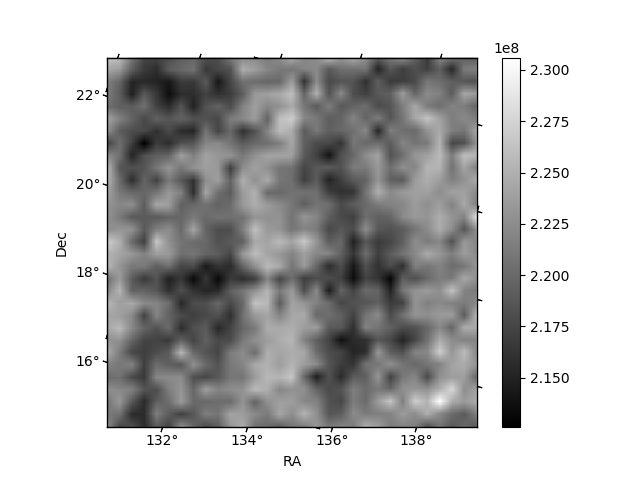
Histogram calculated using DETX and DETY for each event in the final _common_clean file
| Quadrant A | 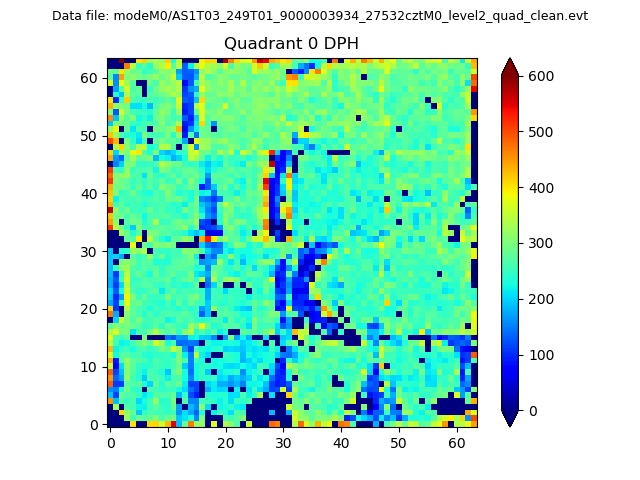 |
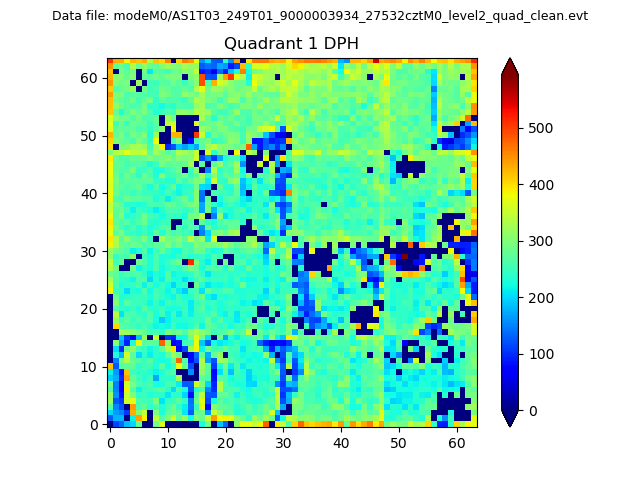 |
Quadrant B |
|---|---|---|---|
| Quadrant D | 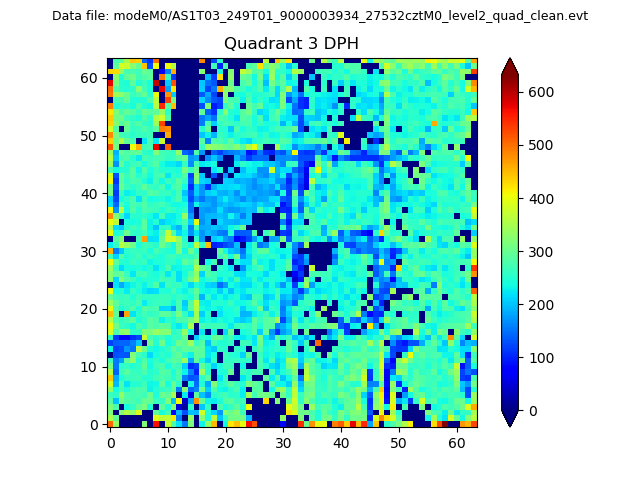 |
 |
Quadrant C |
| Plot type | Count rate plots | Images |
|---|---|---|
| Comparison with Poisson distribution Blue bars denote a histogram of data divided into 1 sec bins. Red curve is a Poisson curve with rate = median count rate of data. |
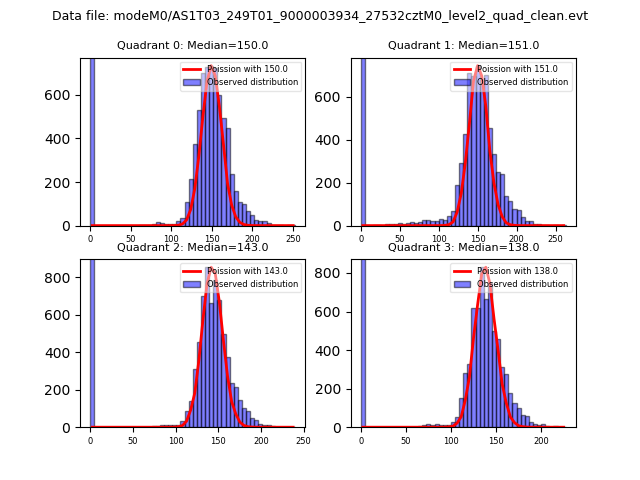 |
 |
| Quadrant-wise count rates Data is divided into 100 sec bins |
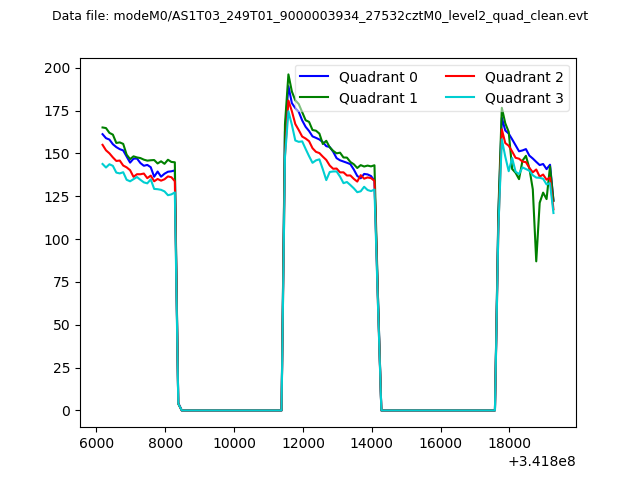 |
|
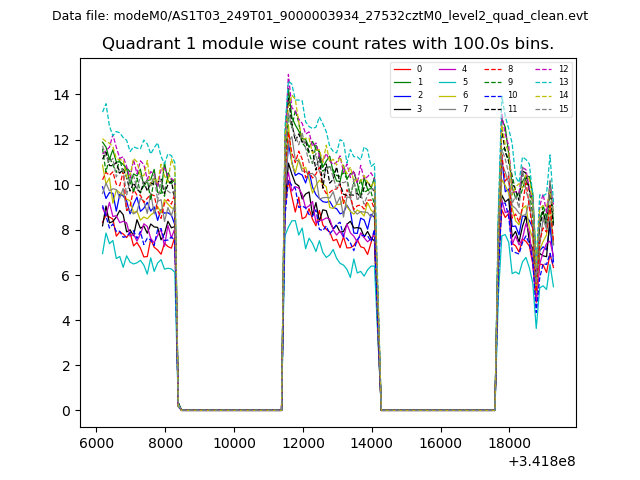
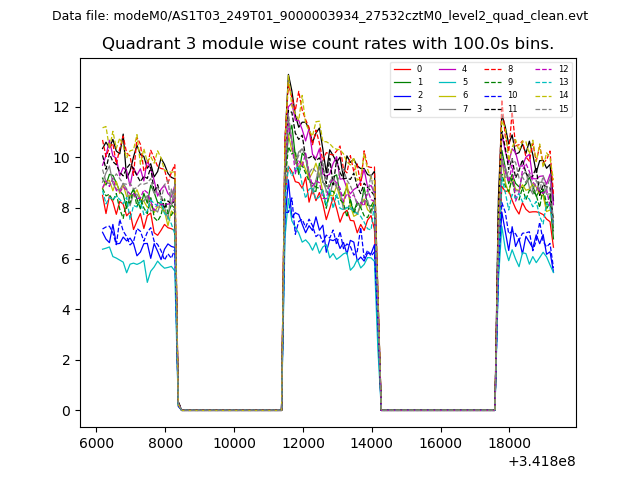
| Module-wise count rates for Quadrant A Data is divided into 100 sec bins |
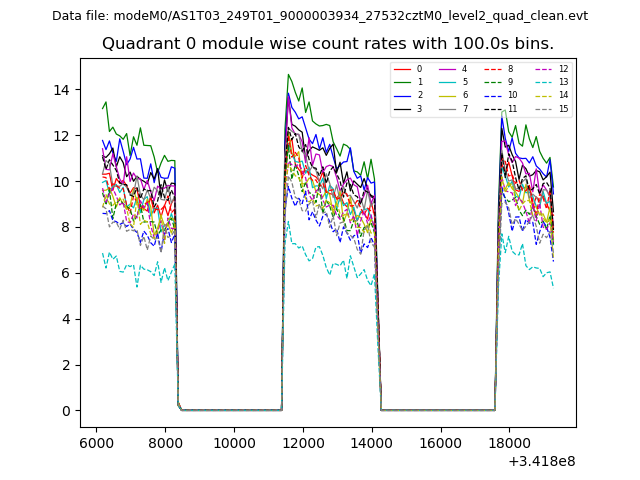 |
 |
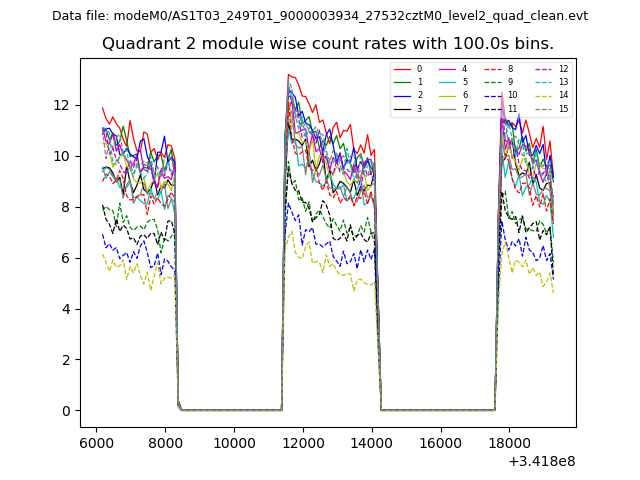
| Module-wise count rates for Quadrant B Data is divided into 100 sec bins |
 |
 |
| Module-wise count rates for Quadrant C Data is divided into 100 sec bins |
 |
 |
| Module-wise count rates for Quadrant D Data is divided into 100 sec bins |
 |
 |
| Parameter | Plot |
|---|---|
| CZT HV Monitor | 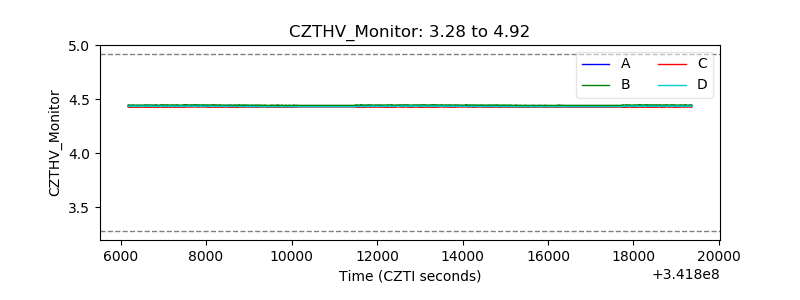 |
| D_VDD | 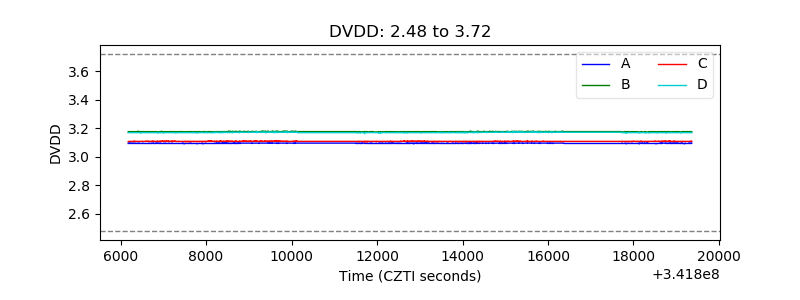 |
| Temperature 1 | 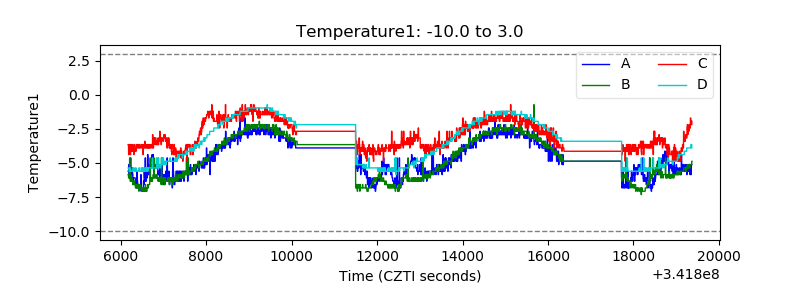 |
| Veto HV Monitor | 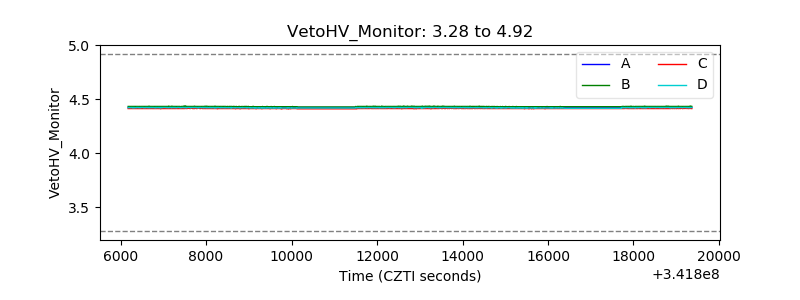 |
| Veto LLD | 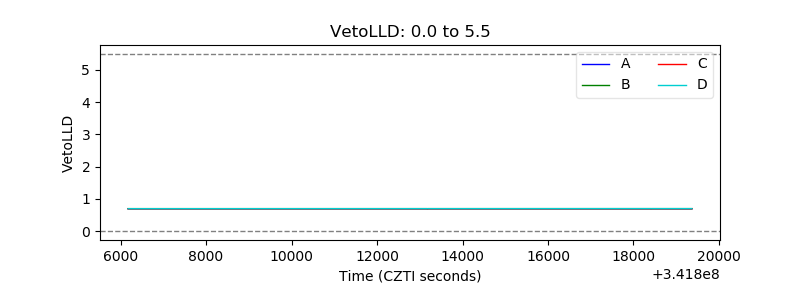 |
| Alpha Counter | 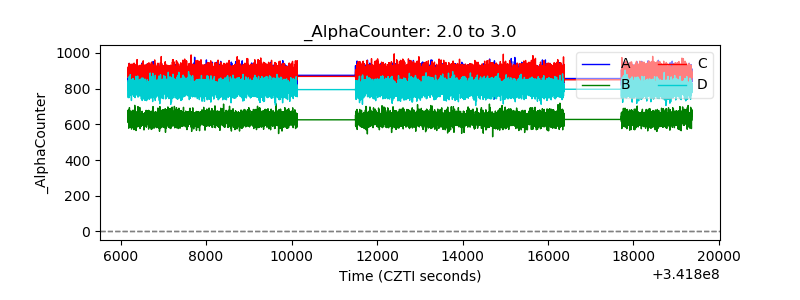 |
| _CPM_Rate | 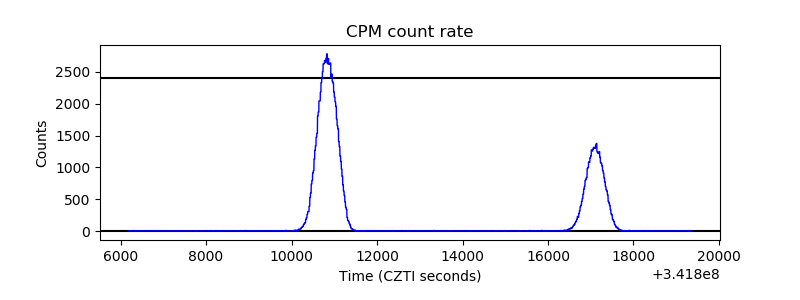 |
| CZT Counter | 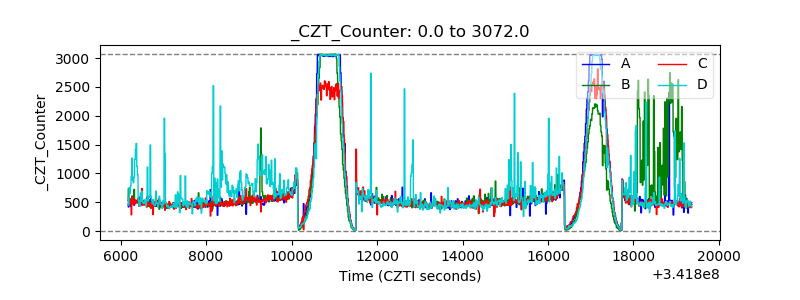 |
| +2.5 Volts monitor |  |
| +5 Volts monitor |  |
| _ROLL_ROT | 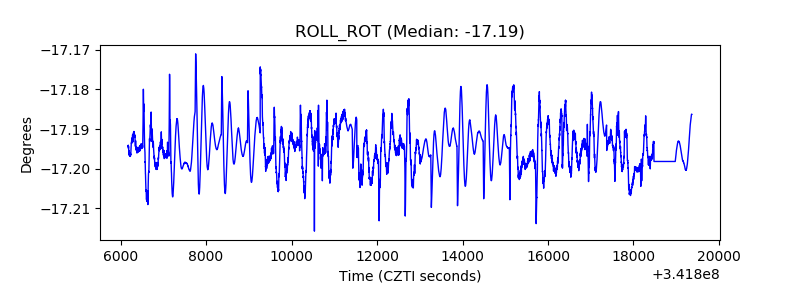 |
| _Roll_DEC | 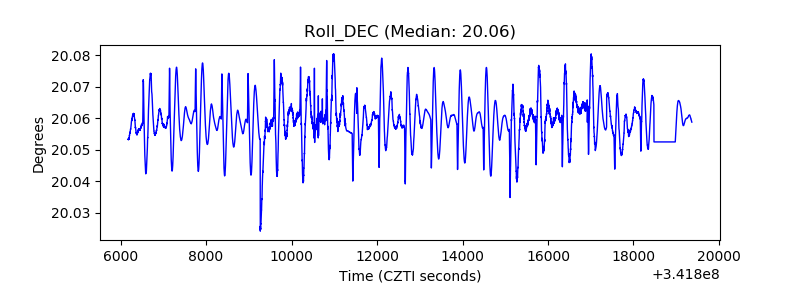 |
| _Roll_RA | 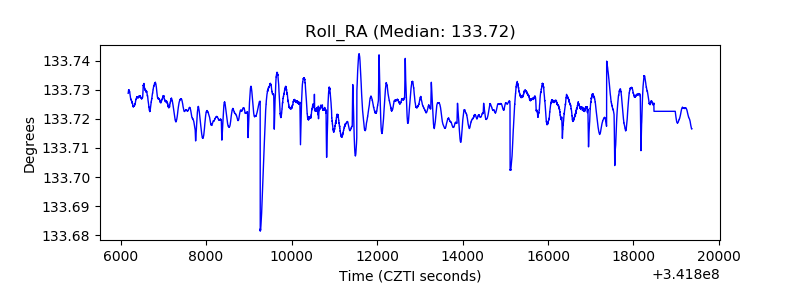 |
| Veto Counter | 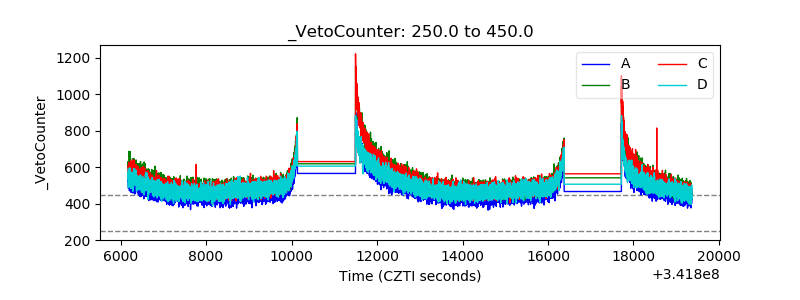 |