| Param | Original file | Final file |
|---|---|---|
| Filename | modeM0/AS1T03_249T01_9000003934_27533cztM0_level2.evt | modeM0/AS1T03_249T01_9000003934_27533cztM0_level2_quad_clean.evt |
| Size (bytes) | 562,245,120 | 96,750,720 |
| Size | 536.2 MB | 92.3 MB |
| Events in quadrant A | 3,444,309 | 637,484 |
| Events in quadrant B | 5,006,357 | 622,764 |
| Events in quadrant C | 3,361,860 | 613,010 |
| Events in quadrant D | 4,763,333 | 591,907 |
| Mode M0 | |||
|---|---|---|---|
| Quadrant | BADHDUFLAG | Total packets | Discarded packets |
| A | 0 | 14207 | 0 |
| B | 0 | 19196 | 0 |
| C | 0 | 14027 | 0 |
| D | 0 | 18523 | 0 |
| Mode M9 | |||
|---|---|---|---|
| Quadrant | BADHDUFLAG | Total packets | Discarded packets |
| A | 0 | 12 | 0 |
| B | 0 | 13 | 0 |
| C | 0 | 13 | 0 |
| D | 0 | 13 | 0 |
| Quadrant | Total seconds | Saturated seconds | Saturation percentage |
|---|---|---|---|
| A | 6662 | 93 | 1.395977% |
| B | 6662 | 522 | 7.835485% |
| C | 6662 | 109 | 1.636145% |
| D | 6662 | 383 | 5.749024% |
Noise dominated data is calculated using 1-second bins in cleaned event files. If a bin has >2000 counts, and if more than 50% of those come from <1% of pixels, then it is considered to be noise-dominated and hence unusable.
| Quadrant | # 1 sec bins | Bins with >0 counts | Bins with >2000 counts | High rate bins dominated by noise | Noise dominated (total time) | Noise dominated (detector-on time) | Marked lightcurve |
|---|---|---|---|---|---|---|---|
| A | 7727 | 6662 | 24 | 24 | 0.31% | 0.36% | 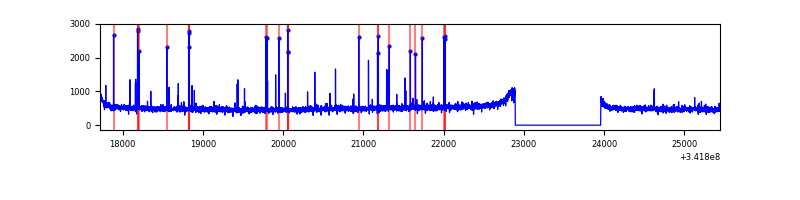 |
| B | 7727 | 6662 | 383 | 383 | 4.96% | 5.75% | 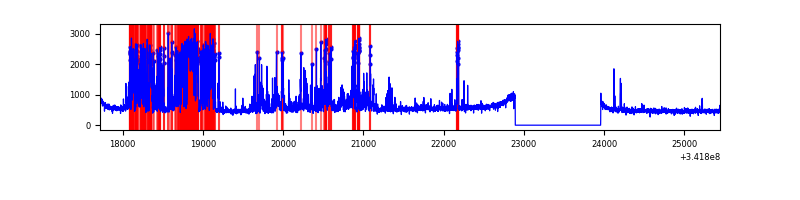 |
| C | 7727 | 6662 | 0 | 0 | 0.00% | 0.00% | 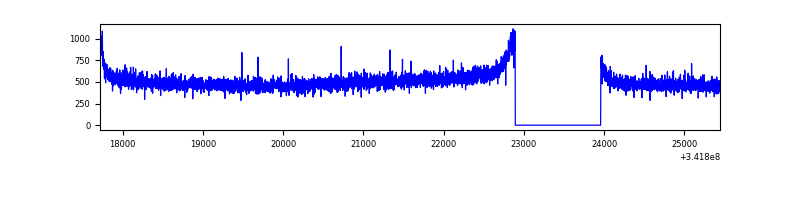 |
| D | 7727 | 6662 | 352 | 352 | 4.56% | 5.28% | 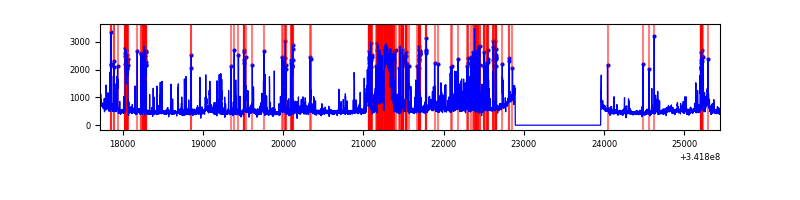 |
Top three noisy pixels from each quadrant. If the there are fewer than three noisy pixels in the level2.evt file, extra rows are filled as -1
| Pixel properties | Quadrant properties | ||||||
|---|---|---|---|---|---|---|---|
| Quadrant | DetID | PixID | Counts | Sigma | Mean | Median | Sigma |
| A | 6 | 16 | 87266 | 498.41 | 866 | 849 | 173.4 |
| A | 13 | 254 | 11138 | 59.34 | 866 | 849 | 173.4 |
| A | 0 | 13 | 10055 | 53.1 | 866 | 849 | 173.4 |
| B | 10 | 245 | 1669273 | 10357.98 | 841 | 820 | 161.1 |
| B | 12 | 111 | 19821 | 117.96 | 841 | 820 | 161.1 |
| B | 0 | 230 | 19201 | 114.11 | 841 | 820 | 161.1 |
| C | 14 | 238 | 134290 | 690.57 | 824 | 831 | 193.3 |
| C | 1 | 16 | 12372 | 59.72 | 824 | 831 | 193.3 |
| C | 13 | 61 | 5707 | 25.23 | 824 | 831 | 193.3 |
| D | 1 | 52 | 1502267 | 7707.03 | 813 | 793 | 194.8 |
| D | 11 | 176 | 77562 | 394.05 | 813 | 793 | 194.8 |
| D | 2 | 250 | 57003 | 288.52 | 813 | 793 | 194.8 |
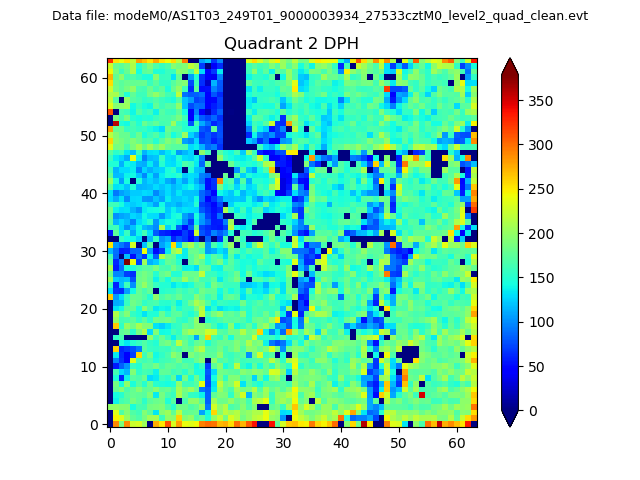
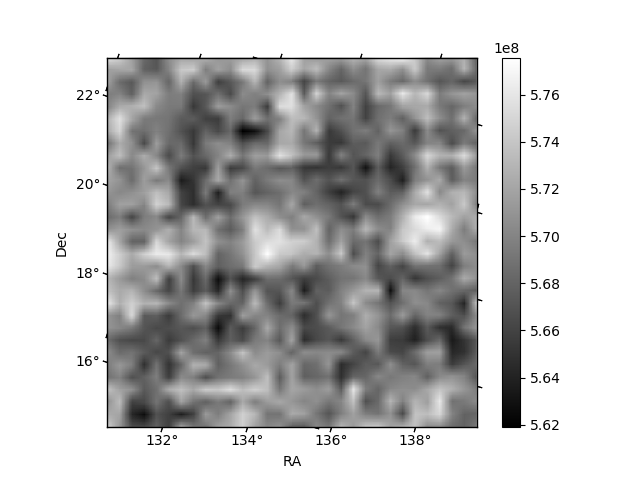
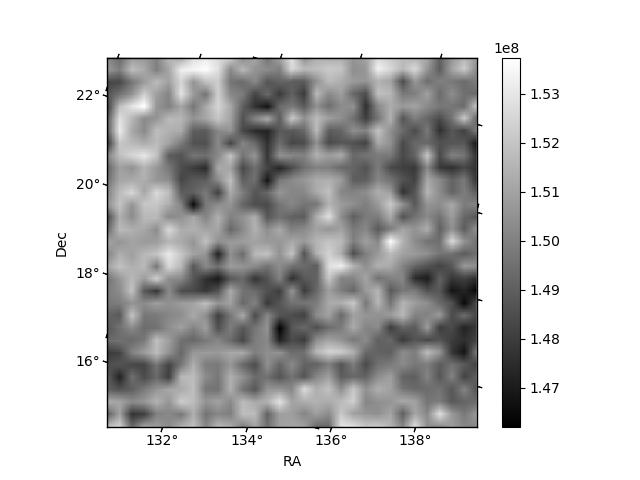
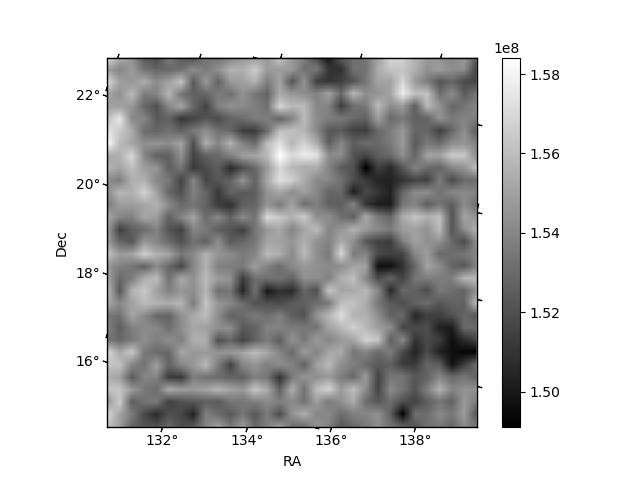
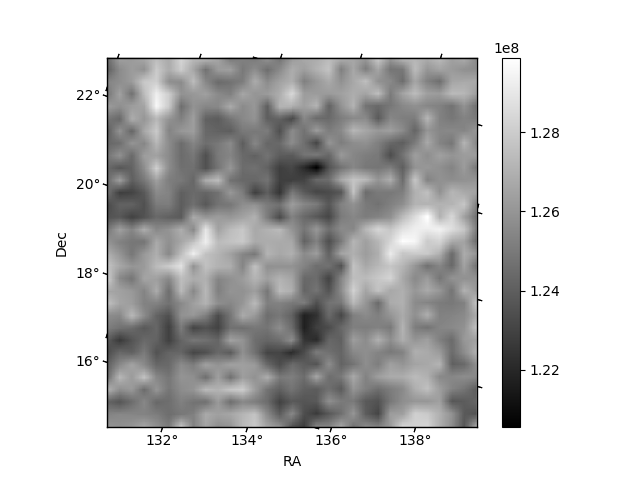
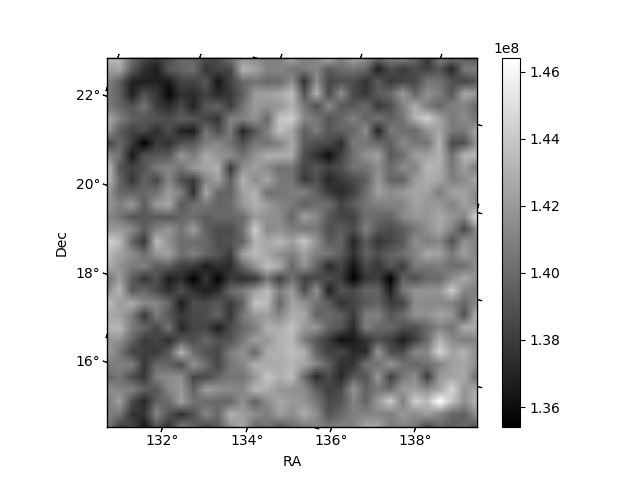
Histogram calculated using DETX and DETY for each event in the final _common_clean file
| Quadrant A | 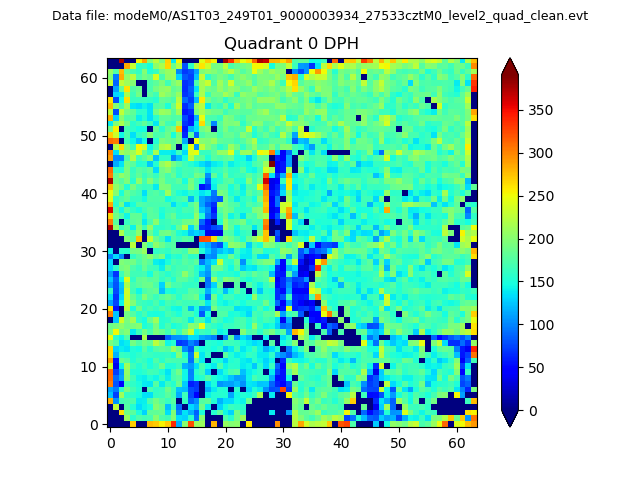 |
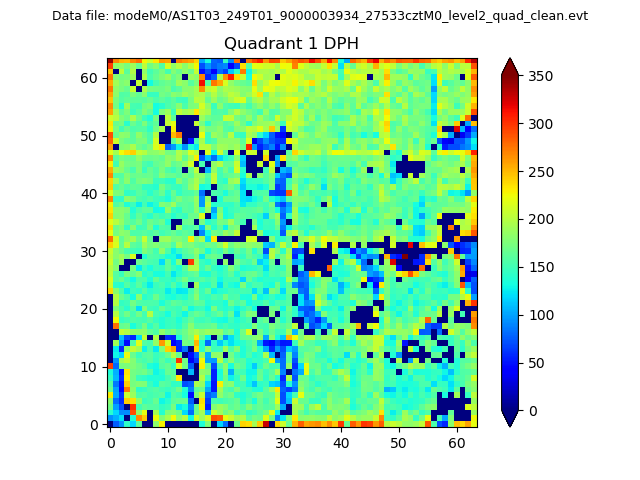 |
Quadrant B |
|---|---|---|---|
| Quadrant D | 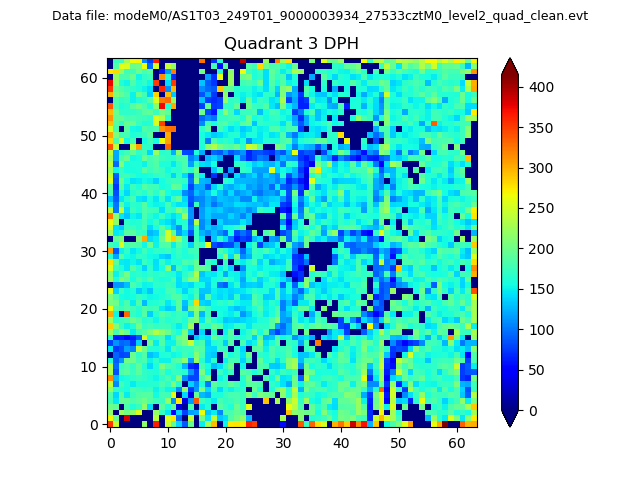 |
 |
Quadrant C |
| Plot type | Count rate plots | Images |
|---|---|---|
| Comparison with Poisson distribution Blue bars denote a histogram of data divided into 1 sec bins. Red curve is a Poisson curve with rate = median count rate of data. |
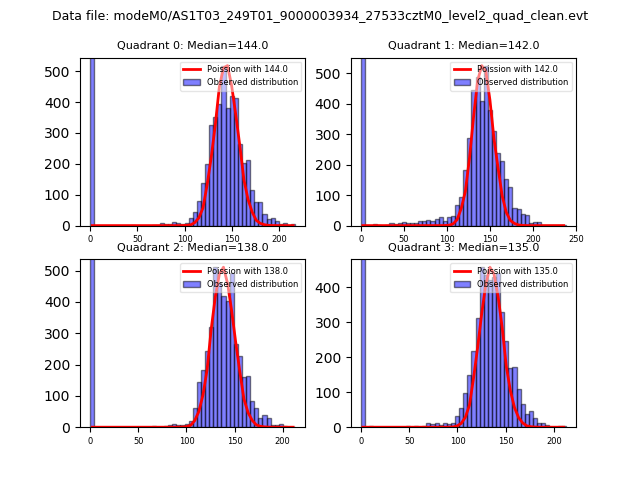 |
 |
| Quadrant-wise count rates Data is divided into 100 sec bins |
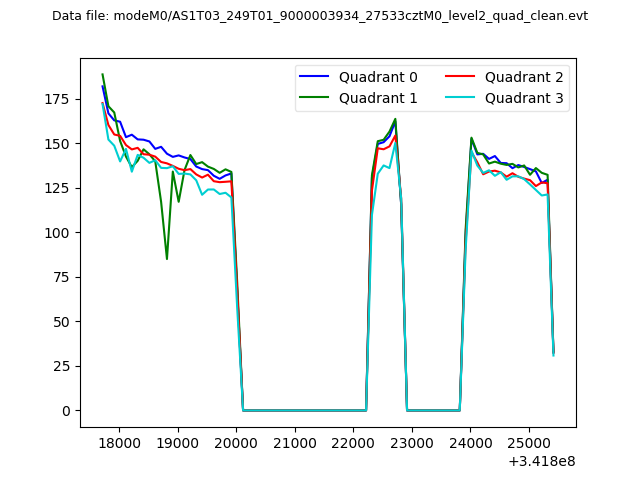 |
|
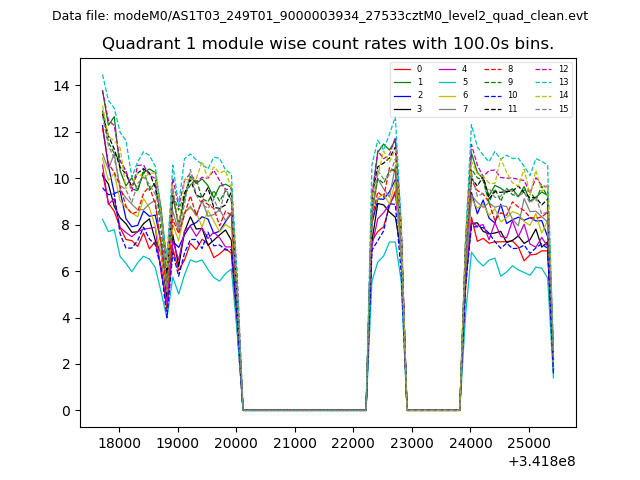
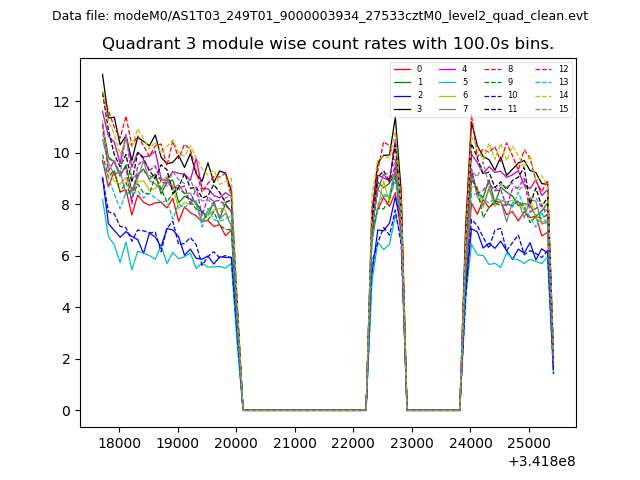
| Module-wise count rates for Quadrant A Data is divided into 100 sec bins |
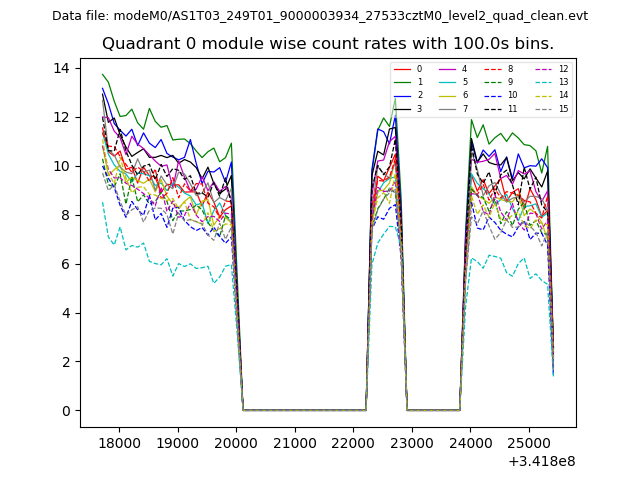 |
 |
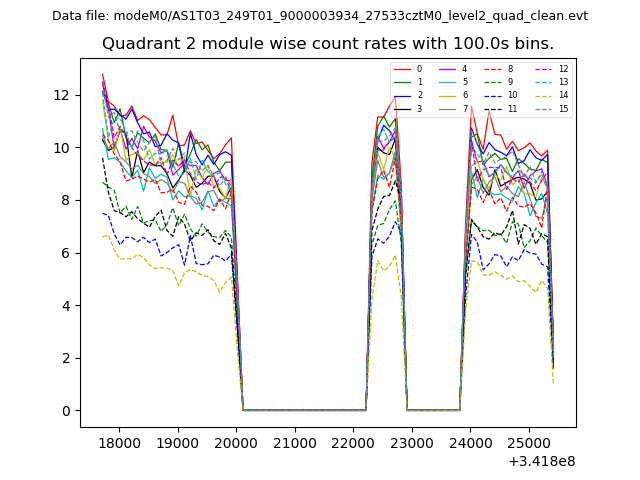
| Module-wise count rates for Quadrant B Data is divided into 100 sec bins |
 |
 |
| Module-wise count rates for Quadrant C Data is divided into 100 sec bins |
 |
 |
| Module-wise count rates for Quadrant D Data is divided into 100 sec bins |
 |
 |
| Parameter | Plot |
|---|---|
| CZT HV Monitor | 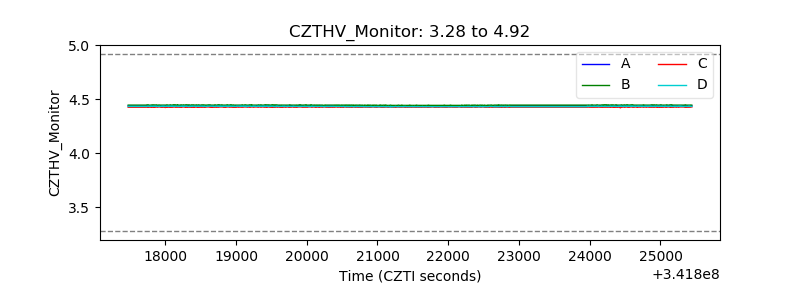 |
| D_VDD | 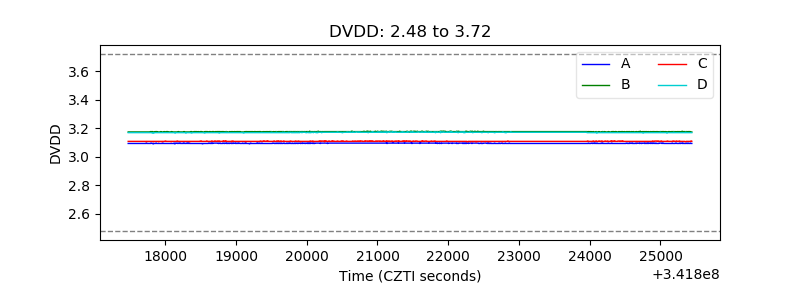 |
| Temperature 1 | 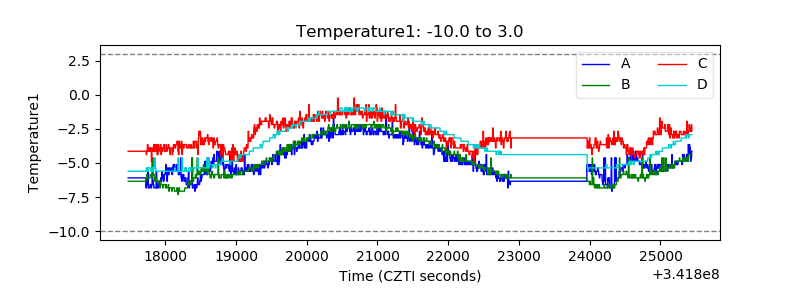 |
| Veto HV Monitor | 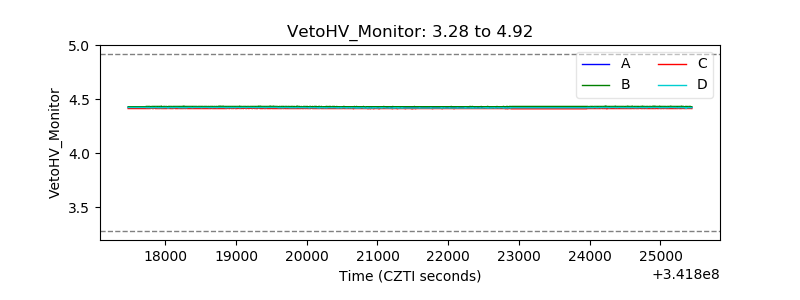 |
| Veto LLD | 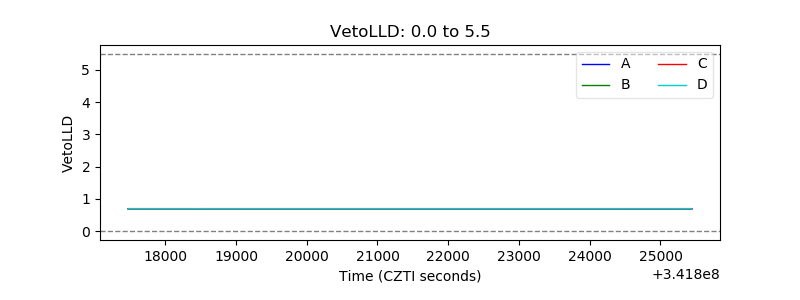 |
| Alpha Counter | 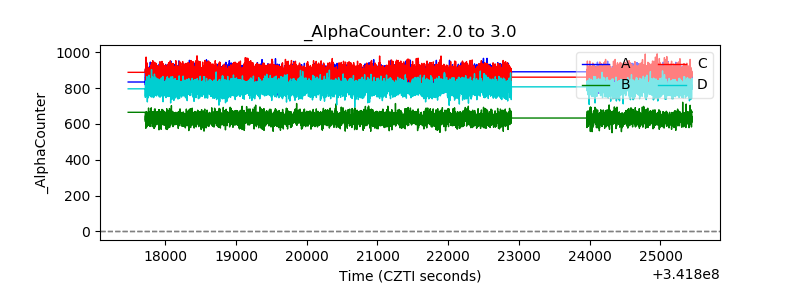 |
| _CPM_Rate | 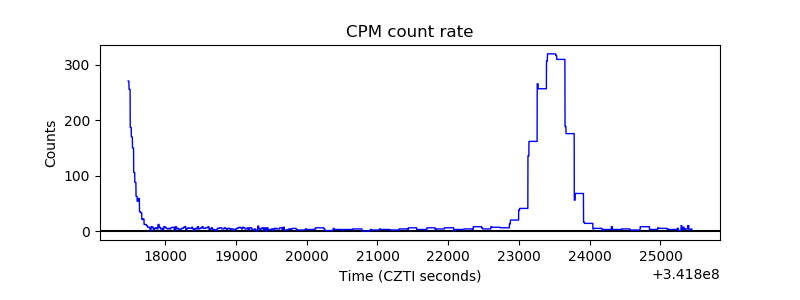 |
| CZT Counter | 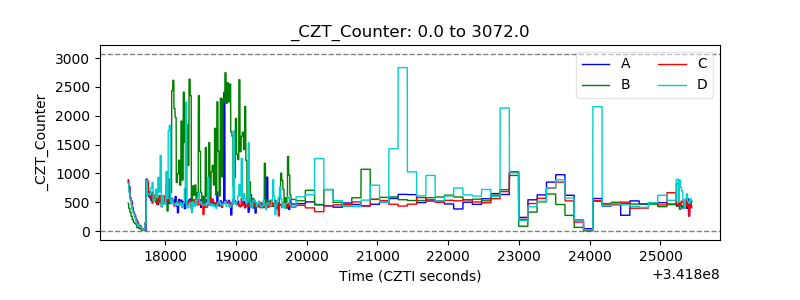 |
| +2.5 Volts monitor |  |
| +5 Volts monitor |  |
| _ROLL_ROT | 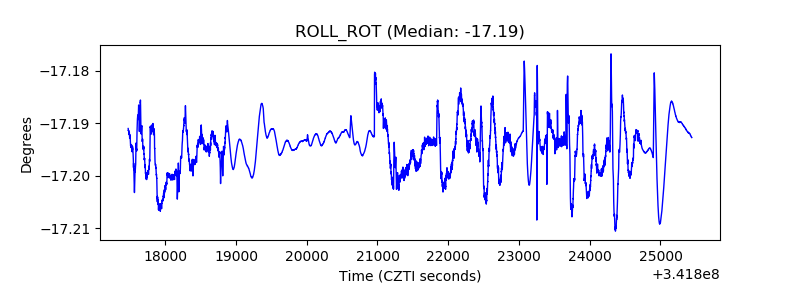 |
| _Roll_DEC | 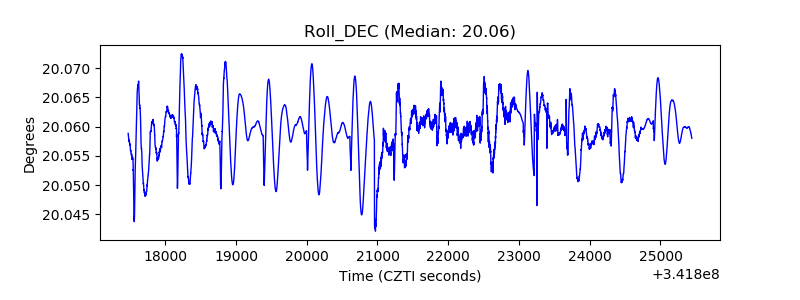 |
| _Roll_RA | 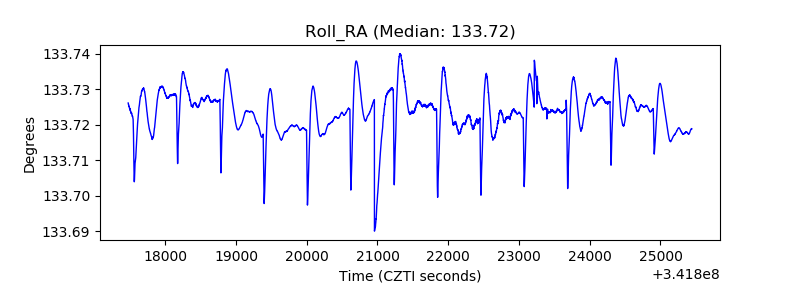 |
| Veto Counter | 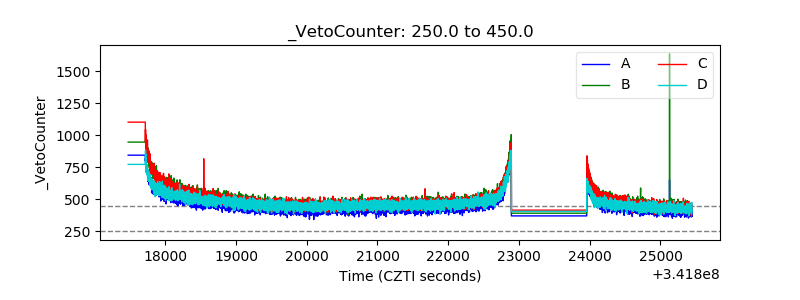 |