| Param | Original file | Final file |
|---|---|---|
| Filename | modeM0/AS1T03_249T01_9000003934_27534cztM0_level2.evt | modeM0/AS1T03_249T01_9000003934_27534cztM0_level2_quad_clean.evt |
| Size (bytes) | 331,922,880 | 34,269,120 |
| Size | 316.5 MB | 32.7 MB |
| Events in quadrant A | 1,809,421 | 198,589 |
| Events in quadrant B | 2,006,610 | 201,515 |
| Events in quadrant C | 1,796,755 | 192,164 |
| Events in quadrant D | 4,183,014 | 179,168 |
| Mode M0 | |||
|---|---|---|---|
| Quadrant | BADHDUFLAG | Total packets | Discarded packets |
| A | 0 | 7593 | 0 |
| B | 0 | 8267 | 0 |
| C | 0 | 7623 | 0 |
| D | 0 | 14981 | 0 |
| Quadrant | Total seconds | Saturated seconds | Saturation percentage |
|---|---|---|---|
| A | 3760 | 0 | 0.000000% |
| B | 3761 | 33 | 0.877426% |
| C | 3761 | 22 | 0.584951% |
| D | 3761 | 964 | 25.631481% |
Noise dominated data is calculated using 1-second bins in cleaned event files. If a bin has >2000 counts, and if more than 50% of those come from <1% of pixels, then it is considered to be noise-dominated and hence unusable.
| Quadrant | # 1 sec bins | Bins with >0 counts | Bins with >2000 counts | High rate bins dominated by noise | Noise dominated (total time) | Noise dominated (detector-on time) | Marked lightcurve |
|---|---|---|---|---|---|---|---|
| A | 3760 | 3760 | 0 | 0 | 0.00% | 0.00% |  |
| B | 3761 | 3761 | 17 | 17 | 0.45% | 0.45% |  |
| C | 3761 | 3761 | 2 | 2 | 0.05% | 0.05% |  |
| D | 3760 | 3760 | 782 | 782 | 20.80% | 20.80% |  |
Top three noisy pixels from each quadrant. If the there are fewer than three noisy pixels in the level2.evt file, extra rows are filled as -1
| Pixel properties | Quadrant properties | ||||||
|---|---|---|---|---|---|---|---|
| Quadrant | DetID | PixID | Counts | Sigma | Mean | Median | Sigma |
| A | 0 | 13 | 35855 | 377.57 | 458 | 448 | 93.8 |
| A | 13 | 254 | 5409 | 52.9 | 458 | 448 | 93.8 |
| A | 6 | 16 | 4872 | 47.18 | 458 | 448 | 93.8 |
| B | 10 | 245 | 142238 | 1625.65 | 451 | 440 | 87.2 |
| B | 3 | 64 | 38307 | 434.12 | 451 | 440 | 87.2 |
| B | 0 | 230 | 28505 | 321.75 | 451 | 440 | 87.2 |
| C | 14 | 238 | 70944 | 679.42 | 437 | 441 | 103.8 |
| C | 7 | 221 | 20963 | 197.77 | 437 | 441 | 103.8 |
| C | 13 | 61 | 3016 | 24.81 | 437 | 441 | 103.8 |
| D | 1 | 52 | 1520218 | 16353.59 | 383 | 373 | 92.9 |
| D | 7 | 80 | 1035903 | 11142.34 | 383 | 373 | 92.9 |
| D | 2 | 250 | 82740 | 886.27 | 383 | 373 | 92.9 |
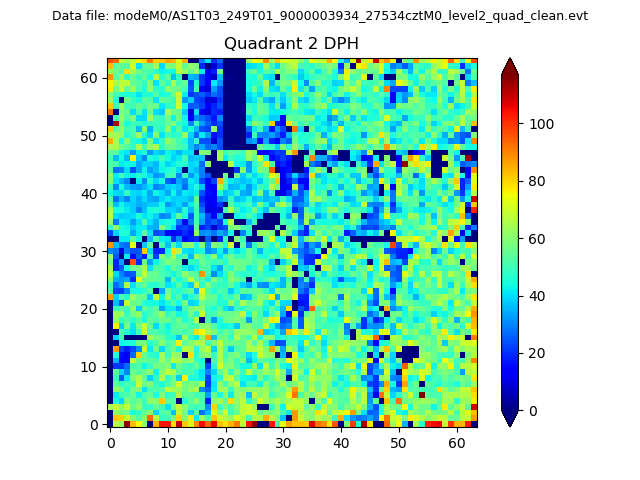
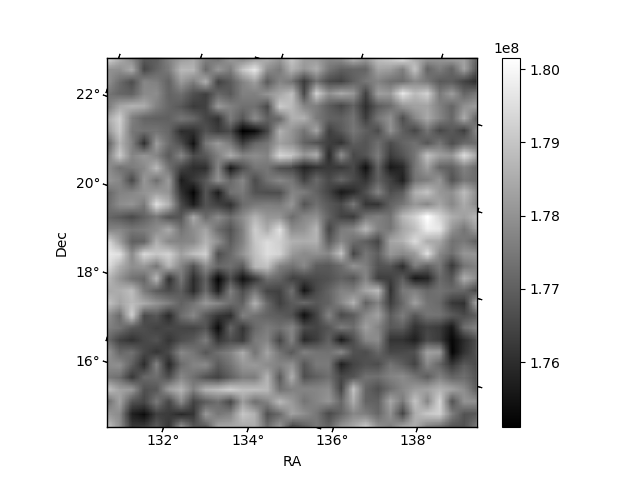
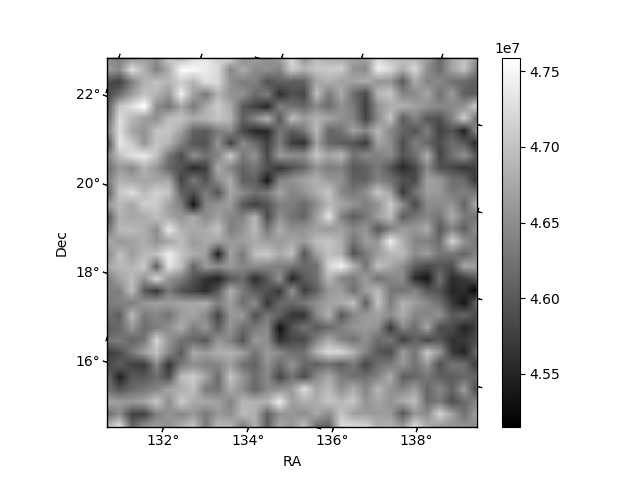
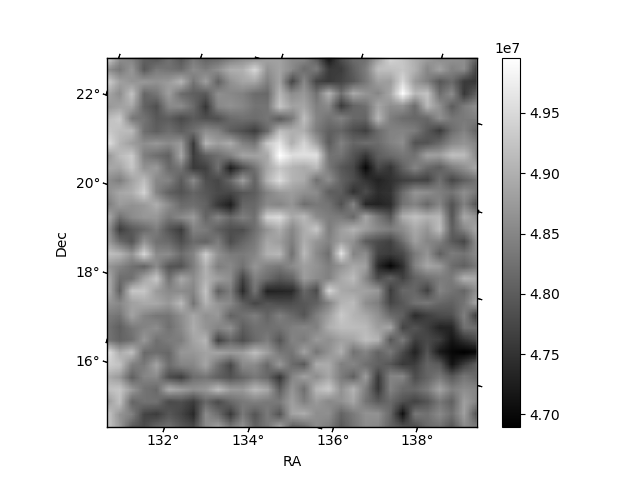
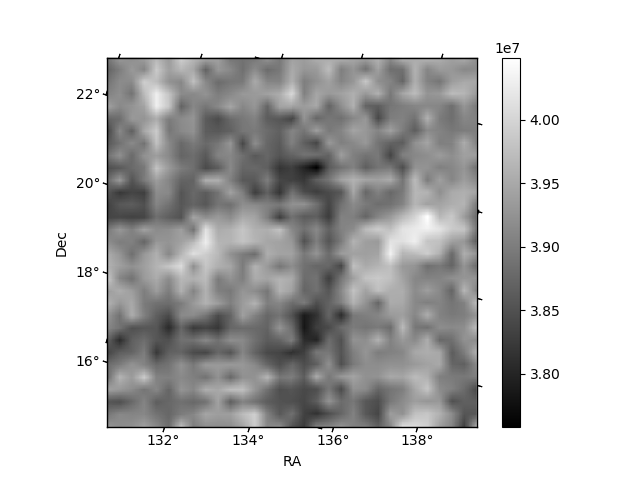
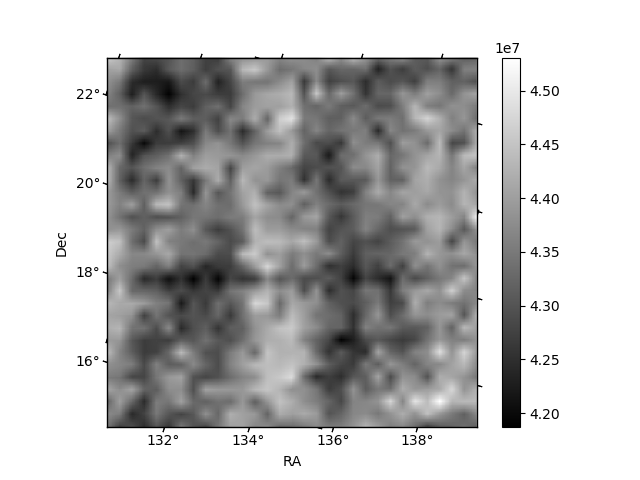
Histogram calculated using DETX and DETY for each event in the final _common_clean file
| Quadrant A | 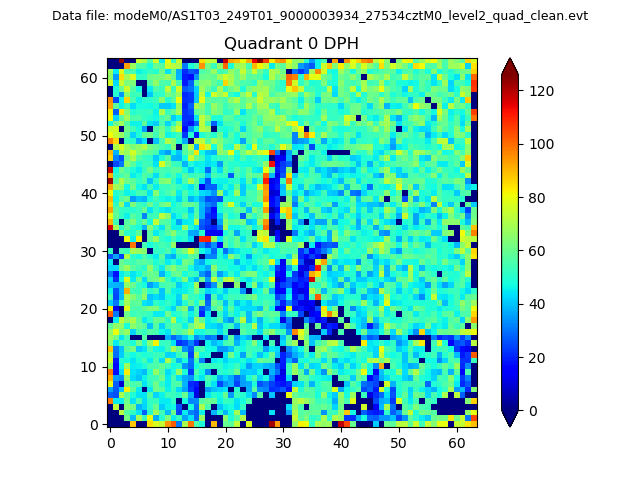 |
 |
Quadrant B |
|---|---|---|---|
| Quadrant D | 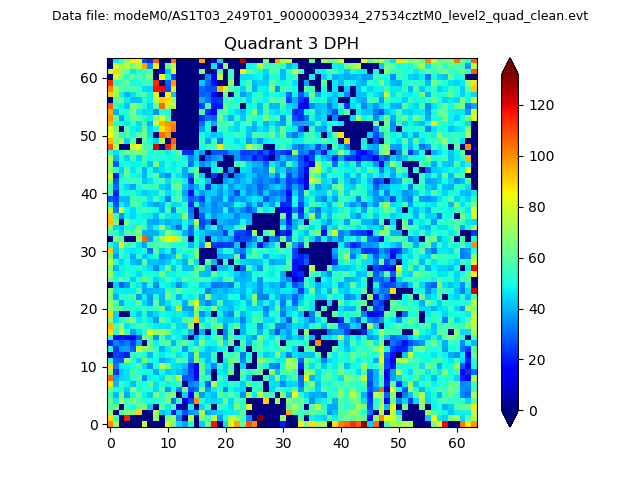 |
 |
Quadrant C |
| Plot type | Count rate plots | Images |
|---|---|---|
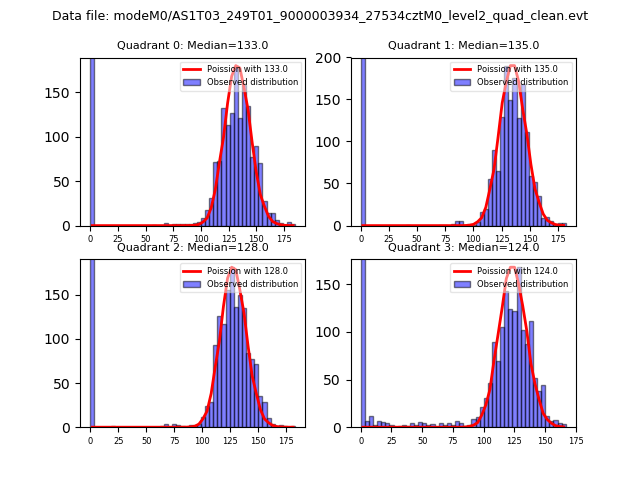
| Comparison with Poisson distribution Blue bars denote a histogram of data divided into 1 sec bins. Red curve is a Poisson curve with rate = median count rate of data. |
 |
 |
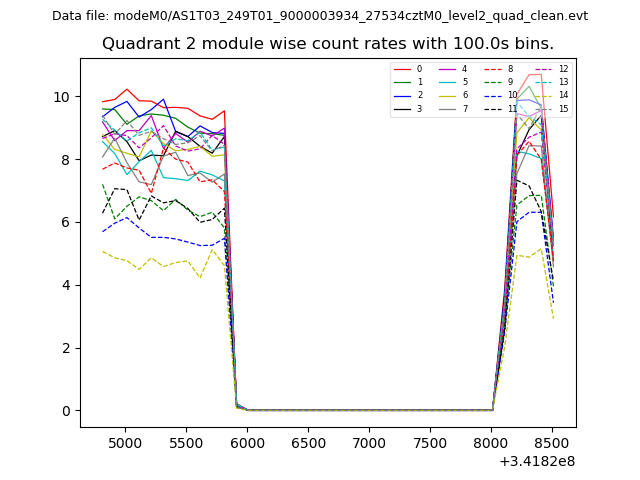
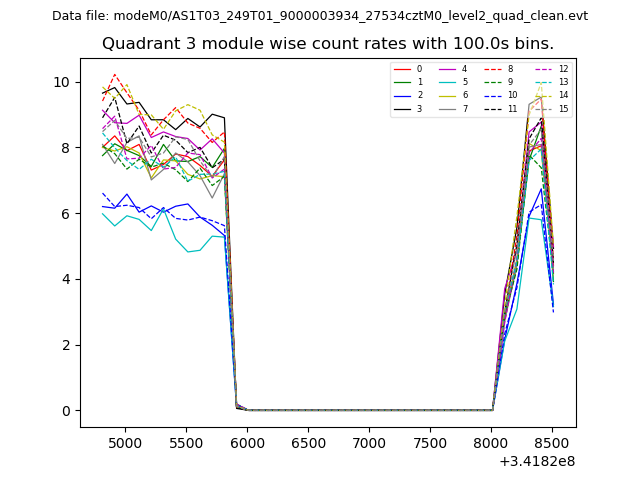
| Quadrant-wise count rates Data is divided into 100 sec bins |
 |
|
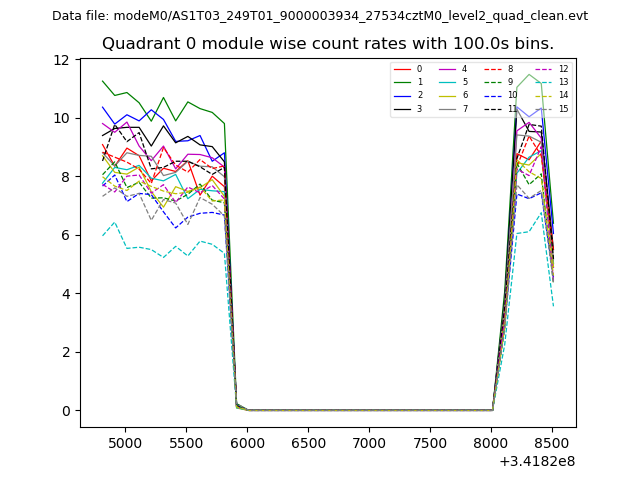
| Module-wise count rates for Quadrant A Data is divided into 100 sec bins |
 |
 |
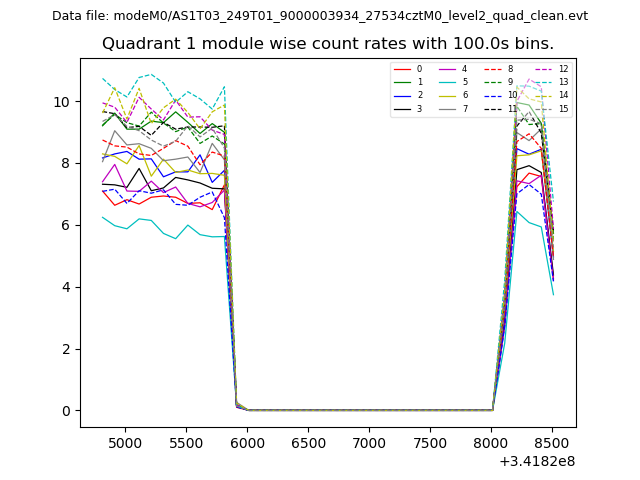
| Module-wise count rates for Quadrant B Data is divided into 100 sec bins |
 |
 |
| Module-wise count rates for Quadrant C Data is divided into 100 sec bins |
 |
 |
| Module-wise count rates for Quadrant D Data is divided into 100 sec bins |
 |
 |
| Parameter | Plot |
|---|---|
| CZT HV Monitor | 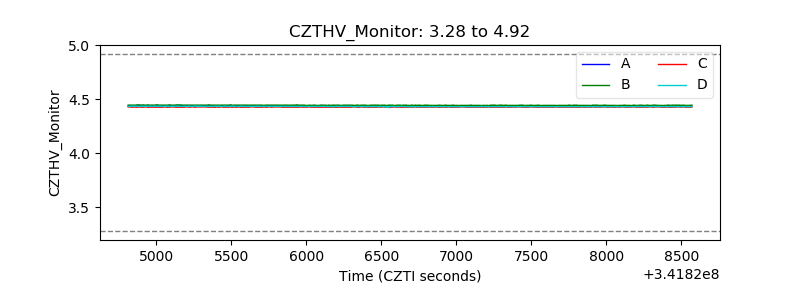 |
| D_VDD | 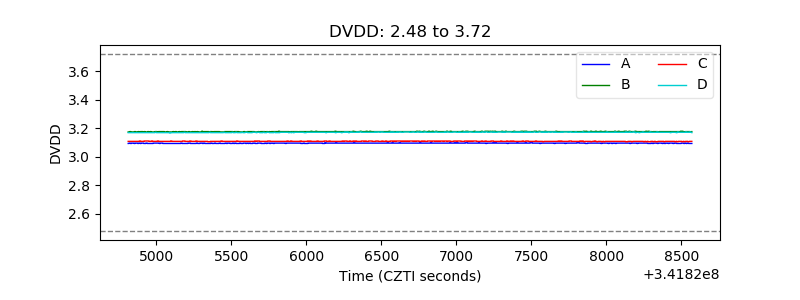 |
| Temperature 1 | 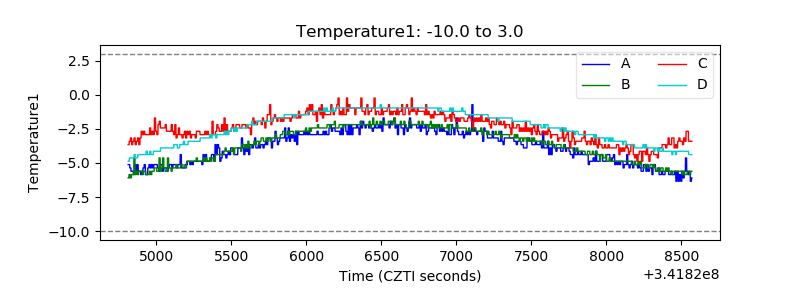 |
| Veto HV Monitor | 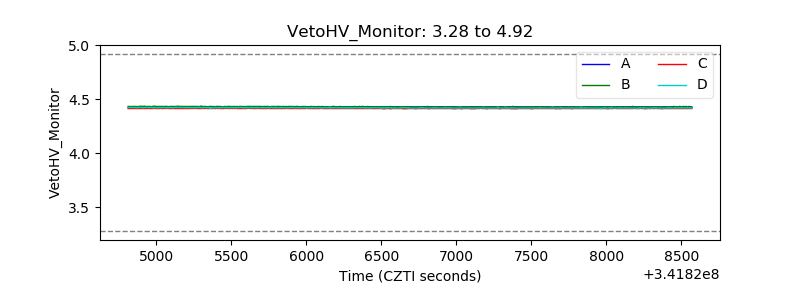 |
| Veto LLD | 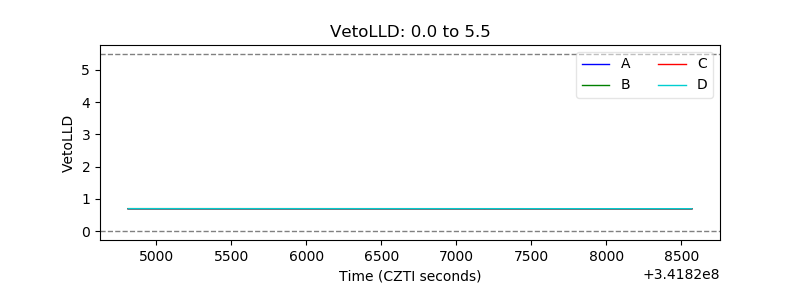 |
| Alpha Counter | 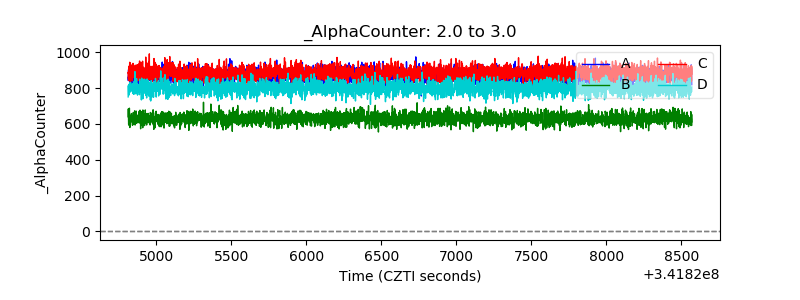 |
| _CPM_Rate | 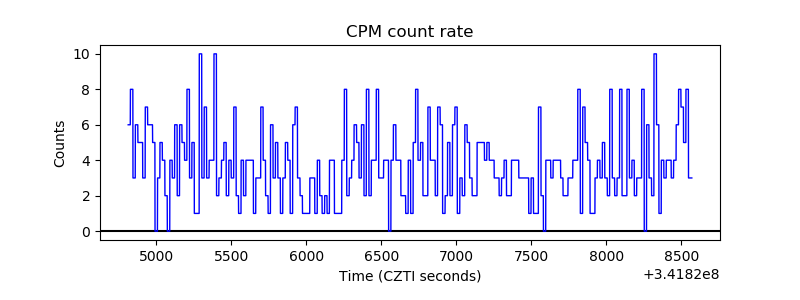 |
| CZT Counter | 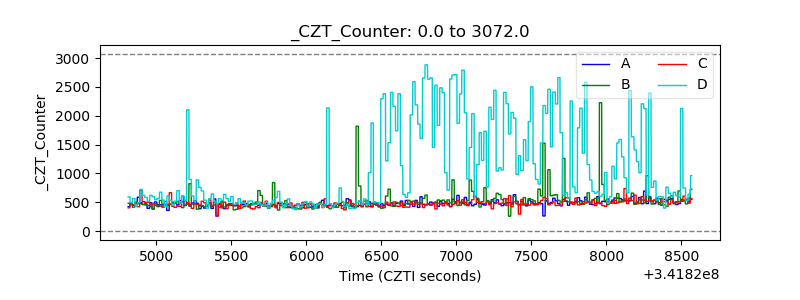 |
| +2.5 Volts monitor | 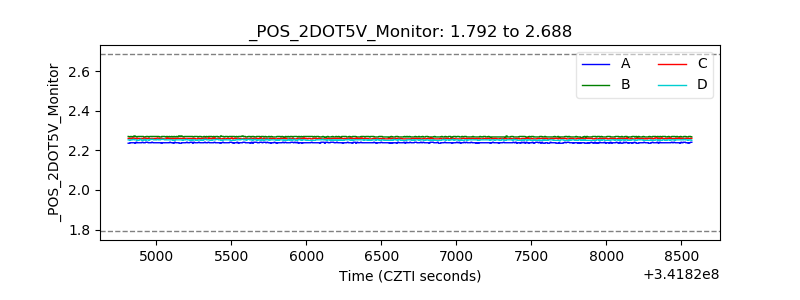 |
| +5 Volts monitor |  |
| _ROLL_ROT | 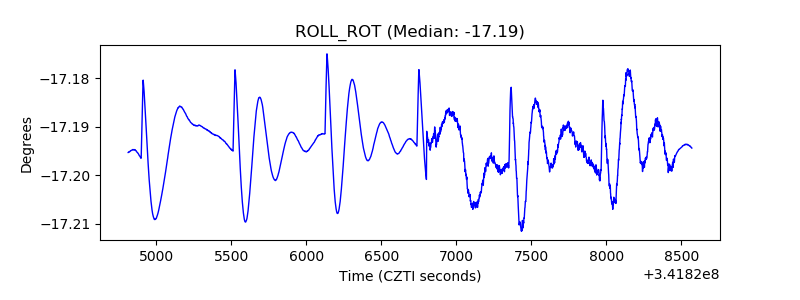 |
| _Roll_DEC |  |
| _Roll_RA | 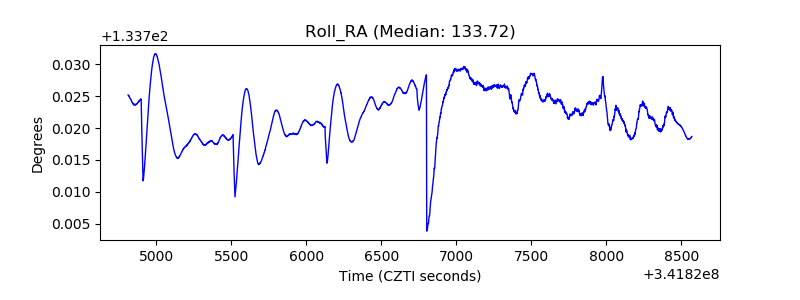 |
| Veto Counter | 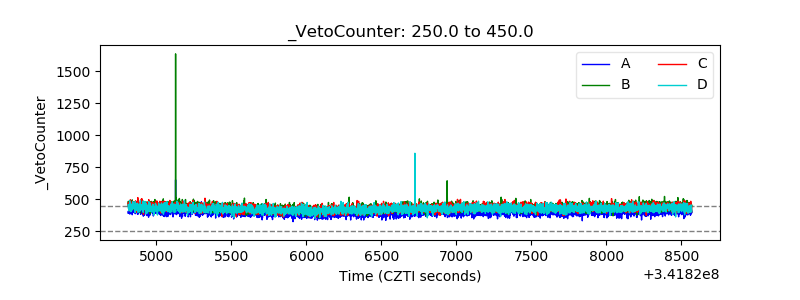 |