| Param | Original file | Final file |
|---|---|---|
| Filename | modeM0/AS1A09_038T15_9000003936cztM0_level2.fits | modeM0/AS1A09_038T15_9000003936cztM0_level2_quad_clean.evt |
| Size (bytes) | 53,496,000 | 40,838,400 |
| Size | 51.0 MB | 38.9 MB |
| Events in quadrant A | 328,884 | 227,819 |
| Events in quadrant B | 314,800 | 227,302 |
| Events in quadrant C | 317,584 | 212,966 |
| Events in quadrant D | 259,718 | 168,494 |
| Mode SS | |||
|---|---|---|---|
| Quadrant | BADHDUFLAG | Total packets | Discarded packets |
| A | 0 | 114 | 0 |
| B | 0 | 114 | 0 |
| C | 0 | 114 | 0 |
| D | 0 | 114 | 0 |
| Mode M0 | |||
|---|---|---|---|
| Quadrant | BADHDUFLAG | Total packets | Discarded packets |
| A | 0 | 11679 | 0 |
| B | 0 | 12243 | 0 |
| C | 0 | 12265 | 0 |
| D | 0 | 19496 | 0 |
| Mode M9 | |||
|---|---|---|---|
| Quadrant | BADHDUFLAG | Total packets | Discarded packets |
| A | 0 | 4 | 0 |
| B | 0 | 4 | 0 |
| C | 0 | 4 | 0 |
| D | 0 | 4 | 0 |
| Quadrant | Total seconds | Saturated seconds | Saturation percentage |
|---|---|---|---|
| A | 5708 | 29 | 0.508059% |
| B | 5708 | 72 | 1.261388% |
| C | 5708 | 114 | 1.997197% |
| D | 5708 | 753 | 13.192011% |
Noise dominated data is calculated using 1-second bins in cleaned event files. If a bin has >2000 counts, and if more than 50% of those come from <1% of pixels, then it is considered to be noise-dominated and hence unusable.
| Quadrant | # 1 sec bins | Bins with >0 counts | Bins with >2000 counts | High rate bins dominated by noise | Noise dominated (total time) | Noise dominated (detector-on time) | Marked lightcurve |
|---|---|---|---|---|---|---|---|
| A | 5707 | 5707 | 0 | 0 | 0.00% | 0.00% |  |
| B | 5707 | 5707 | 0 | 0 | 0.00% | 0.00% |  |
| C | 5707 | 5707 | 0 | 0 | 0.00% | 0.00% |  |
| D | 5706 | 5685 | 0 | 0 | 0.00% | 0.00% |  |
Top three noisy pixels from each quadrant. If the there are fewer than three noisy pixels in the level2.evt file, extra rows are filled as -1
| Pixel properties | Quadrant properties | ||||||
|---|---|---|---|---|---|---|---|
| Quadrant | DetID | PixID | Counts | Sigma | Mean | Median | Sigma |
| A | 7 | 110 | 287 | 8.85 | 85 | 81 | 23.3 |
| A | 0 | 29 | 265 | 7.91 | 85 | 81 | 23.3 |
| A | 9 | 19 | 235 | 6.62 | 85 | 81 | 23.3 |
| B | 2 | 9 | 260 | 9.81 | 83 | 79 | 18.4 |
| B | 3 | 17 | 218 | 7.54 | 83 | 79 | 18.4 |
| B | 3 | 80 | 209 | 7.05 | 83 | 79 | 18.4 |
| C | 7 | 111 | 234 | 6.81 | 83 | 78 | 22.9 |
| C | 3 | 234 | 231 | 6.68 | 83 | 78 | 22.9 |
| C | 3 | 126 | 223 | 6.33 | 83 | 78 | 22.9 |
| D | 6 | 231 | 206 | 6.47 | 74 | 67 | 21.5 |
| D | 3 | 159 | 198 | 6.1 | 74 | 67 | 21.5 |
| D | 4 | 160 | 194 | 5.91 | 74 | 67 | 21.5 |
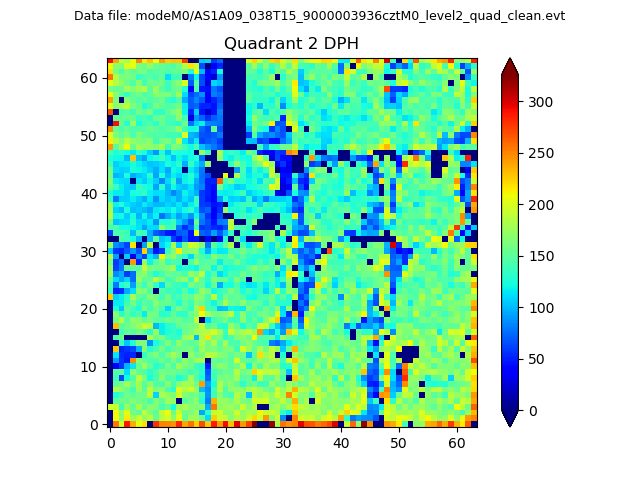
Histogram calculated using DETX and DETY for each event in the final _common_clean file
| Quadrant A |  |
 |
Quadrant B |
|---|---|---|---|
| Quadrant D |  |
 |
Quadrant C |
| Plot type | Count rate plots | Images |
|---|---|---|
| Comparison with Poisson distribution Blue bars denote a histogram of data divided into 1 sec bins. Red curve is a Poisson curve with rate = median count rate of data. |
 |
 |
| Quadrant-wise count rates Data is divided into 100 sec bins |
 |
|
| Module-wise count rates for Quadrant A Data is divided into 100 sec bins |
 |
 |
| Module-wise count rates for Quadrant B Data is divided into 100 sec bins |
 |
 |
| Module-wise count rates for Quadrant C Data is divided into 100 sec bins |
 |
 |
| Module-wise count rates for Quadrant D Data is divided into 100 sec bins |
 |
 |
| Parameter | Plot |
|---|---|
| CZT HV Monitor |  |
| D_VDD | 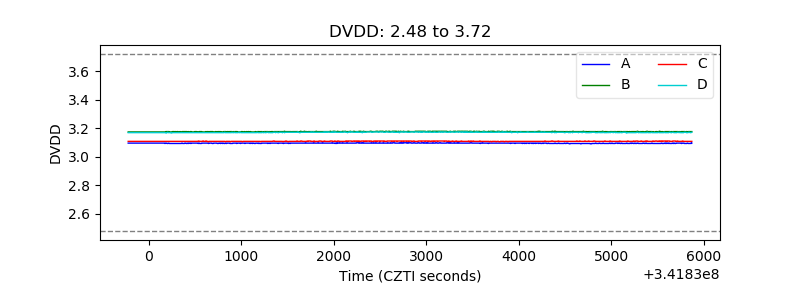 |
| Temperature 1 |  |
| Veto HV Monitor |  |
| Veto LLD |  |
| Alpha Counter |  |
| _CPM_Rate |  |
| CZT Counter |  |
| +2.5 Volts monitor |  |
| +5 Volts monitor |  |
| _ROLL_ROT |  |
| _Roll_DEC |  |
| _Roll_RA |  |
| Veto Counter |  |