| Param | Original file | Final file |
|---|---|---|
| Filename | modeM0/AS1A09_038T15_9000003936_27534cztM0_level2.evt | modeM0/AS1A09_038T15_9000003936_27534cztM0_level2_quad_clean.evt |
| Size (bytes) | 118,146,240 | 9,144,000 |
| Size | 112.7 MB | 8.7 MB |
| Events in quadrant A | 736,826 | 42,507 |
| Events in quadrant B | 777,665 | 44,437 |
| Events in quadrant C | 788,480 | 42,403 |
| Events in quadrant D | 1,170,848 | 35,995 |
| Mode M0 | |||
|---|---|---|---|
| Quadrant | BADHDUFLAG | Total packets | Discarded packets |
| A | 0 | 3089 | 0 |
| B | 0 | 3215 | 0 |
| C | 0 | 3224 | 0 |
| D | 0 | 4457 | 0 |
| Mode M9 | |||
|---|---|---|---|
| Quadrant | BADHDUFLAG | Total packets | Discarded packets |
| A | 0 | 4 | 0 |
| B | 0 | 4 | 0 |
| C | 0 | 4 | 0 |
| D | 0 | 4 | 0 |
| Quadrant | Total seconds | Saturated seconds | Saturation percentage |
|---|---|---|---|
| A | 1492 | 21 | 1.407507% |
| B | 1492 | 35 | 2.345845% |
| C | 1492 | 38 | 2.546917% |
| D | 1492 | 197 | 13.203753% |
Noise dominated data is calculated using 1-second bins in cleaned event files. If a bin has >2000 counts, and if more than 50% of those come from <1% of pixels, then it is considered to be noise-dominated and hence unusable.
| Quadrant | # 1 sec bins | Bins with >0 counts | Bins with >2000 counts | High rate bins dominated by noise | Noise dominated (total time) | Noise dominated (detector-on time) | Marked lightcurve |
|---|---|---|---|---|---|---|---|
| A | 1492 | 1492 | 0 | 0 | 0.00% | 0.00% | 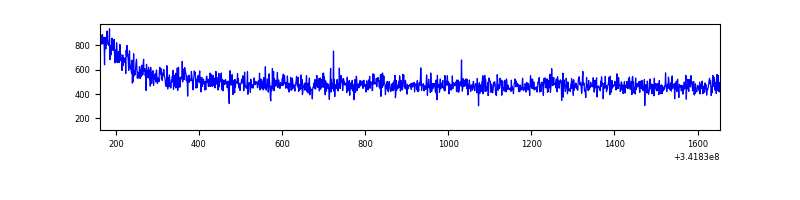 |
| B | 1492 | 1492 | 2 | 2 | 0.13% | 0.13% | 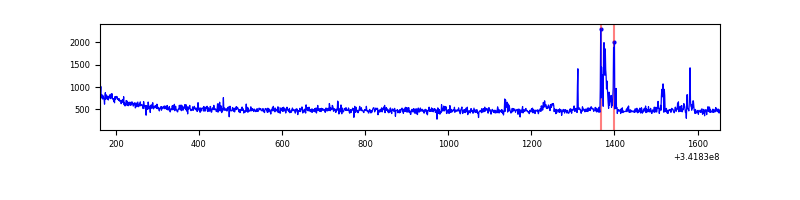 |
| C | 1492 | 1492 | 0 | 0 | 0.00% | 0.00% | 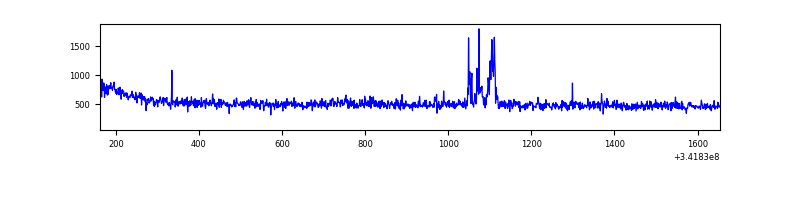 |
| D | 1492 | 1492 | 102 | 102 | 6.84% | 6.84% | 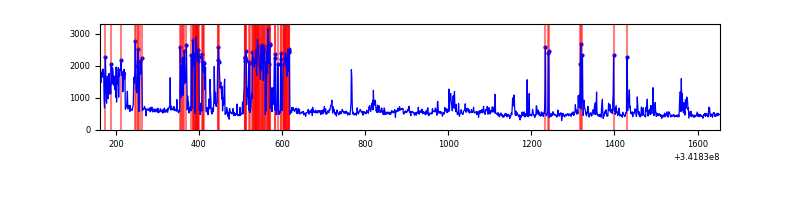 |
Top three noisy pixels from each quadrant. If the there are fewer than three noisy pixels in the level2.evt file, extra rows are filled as -1
| Pixel properties | Quadrant properties | ||||||
|---|---|---|---|---|---|---|---|
| Quadrant | DetID | PixID | Counts | Sigma | Mean | Median | Sigma |
| A | 0 | 13 | 12618 | 315.81 | 187 | 182 | 39.4 |
| A | 13 | 254 | 2190 | 50.99 | 187 | 182 | 39.4 |
| A | 3 | 137 | 1845 | 42.23 | 187 | 182 | 39.4 |
| B | 10 | 245 | 40574 | 1078.76 | 187 | 181 | 37.4 |
| B | 12 | 111 | 4446 | 113.9 | 187 | 181 | 37.4 |
| B | 11 | 111 | 4194 | 107.17 | 187 | 181 | 37.4 |
| C | 2 | 16 | 31814 | 696.34 | 186 | 185 | 45.4 |
| C | 14 | 238 | 30010 | 656.62 | 186 | 185 | 45.4 |
| C | 7 | 221 | 1876 | 37.23 | 186 | 185 | 45.4 |
| D | 1 | 52 | 489833 | 11416.38 | 171 | 166 | 42.9 |
| D | 11 | 176 | 26078 | 604.13 | 171 | 166 | 42.9 |
| D | 2 | 234 | 4402 | 98.76 | 171 | 166 | 42.9 |
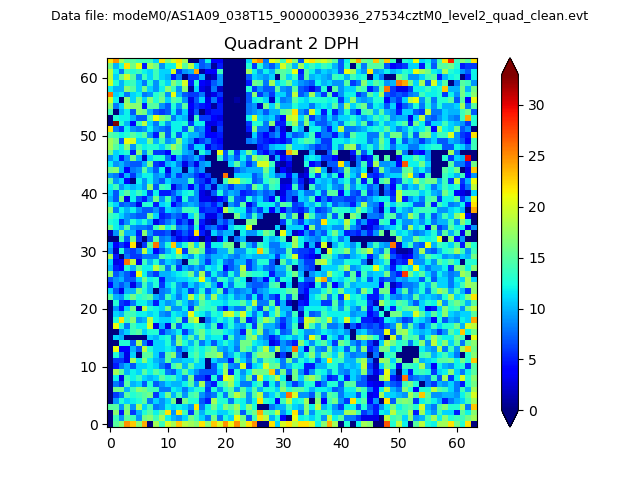
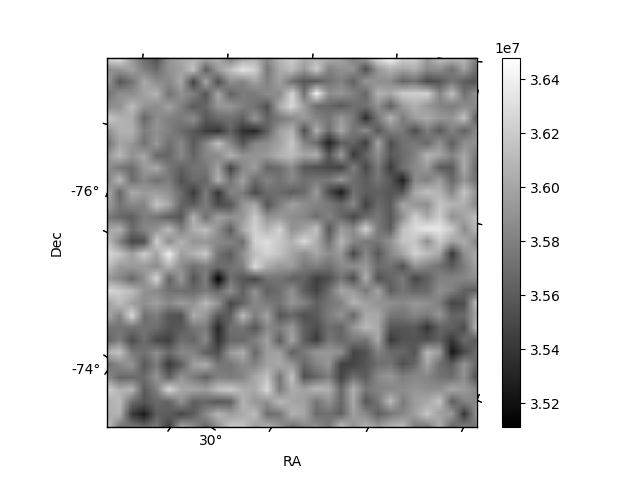
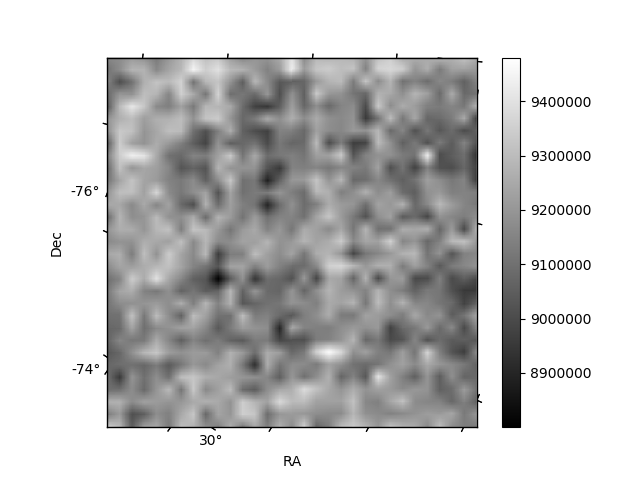
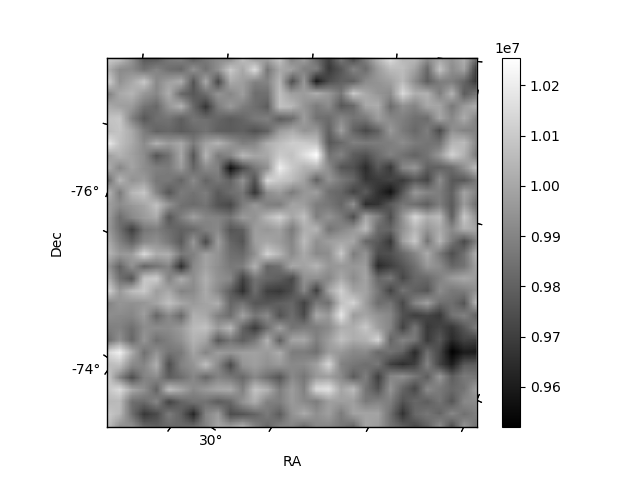
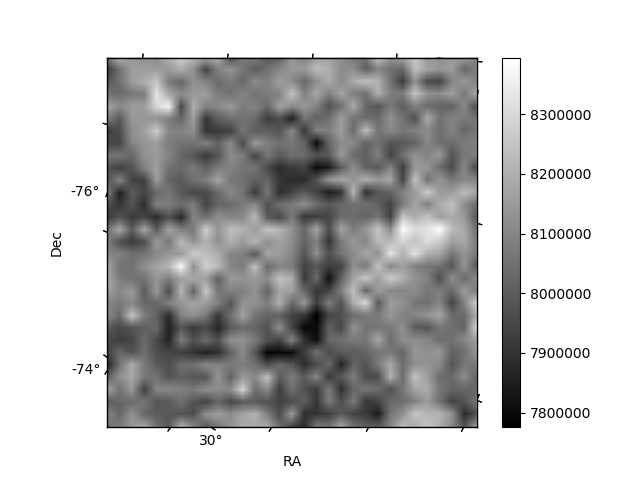
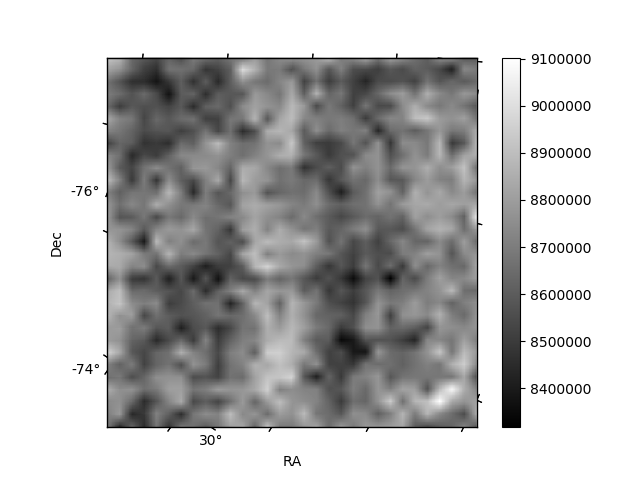
Histogram calculated using DETX and DETY for each event in the final _common_clean file
| Quadrant A | 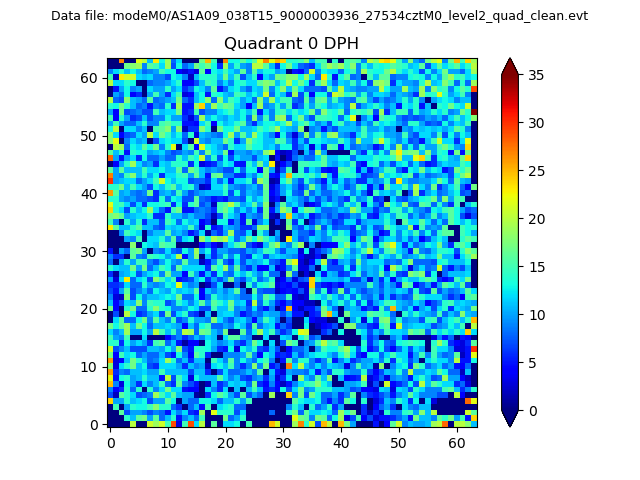 |
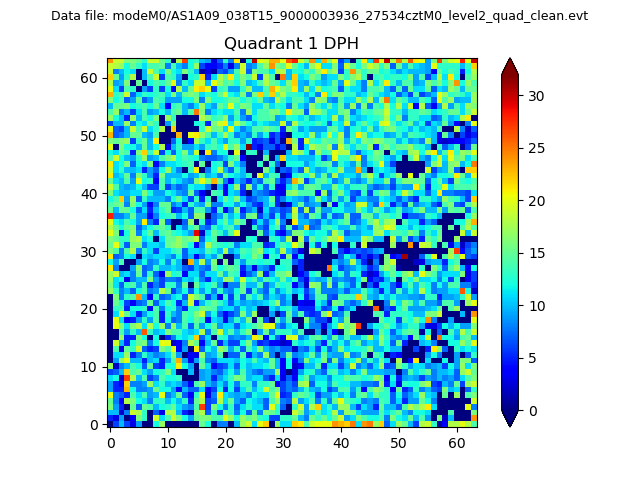 |
Quadrant B |
|---|---|---|---|
| Quadrant D | 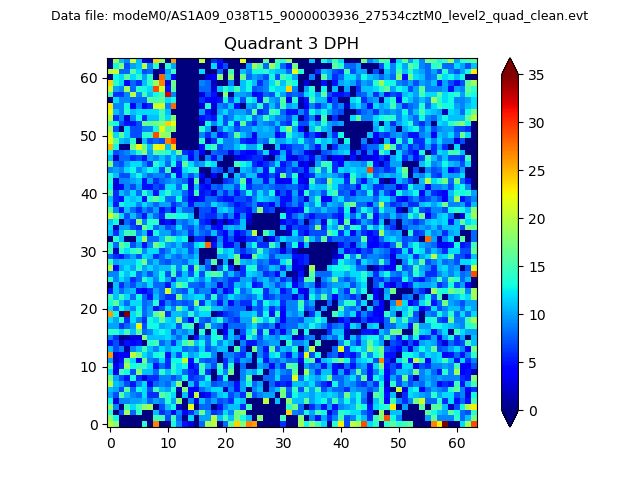 |
 |
Quadrant C |
| Plot type | Count rate plots | Images |
|---|---|---|
| Comparison with Poisson distribution Blue bars denote a histogram of data divided into 1 sec bins. Red curve is a Poisson curve with rate = median count rate of data. |
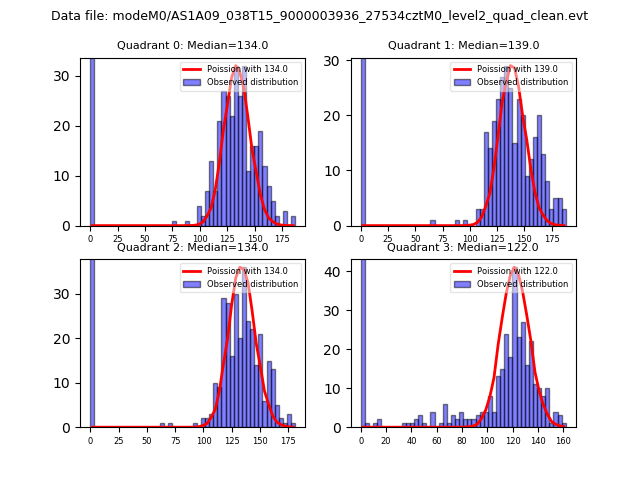 |
 |
| Quadrant-wise count rates Data is divided into 100 sec bins |
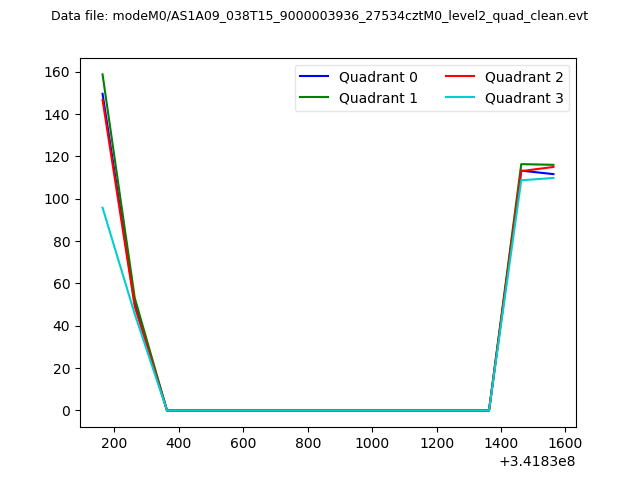 |
|
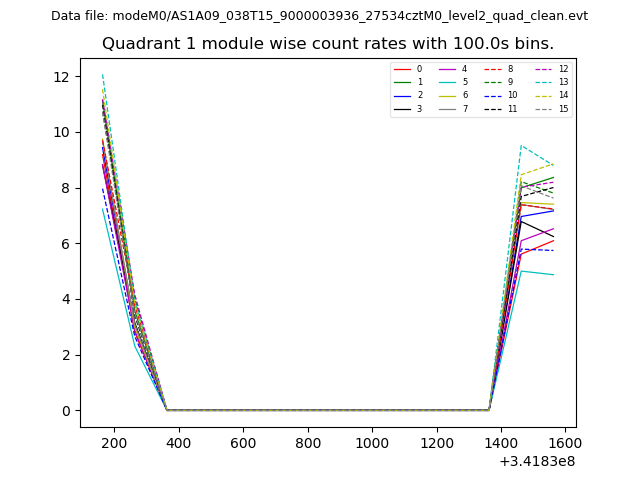
| Module-wise count rates for Quadrant A Data is divided into 100 sec bins |
 |
 |
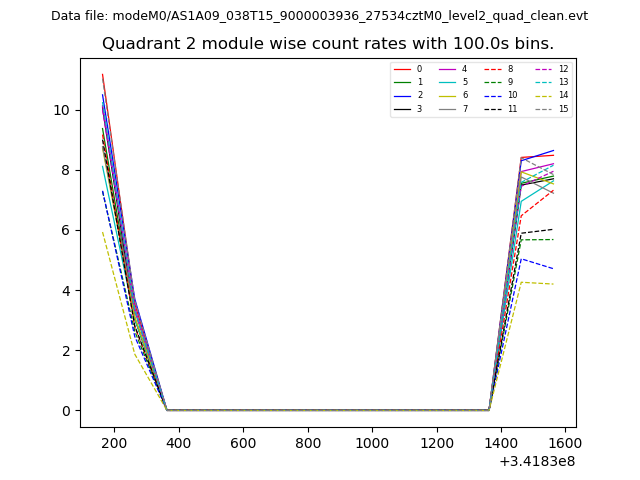
| Module-wise count rates for Quadrant B Data is divided into 100 sec bins |
 |
 |
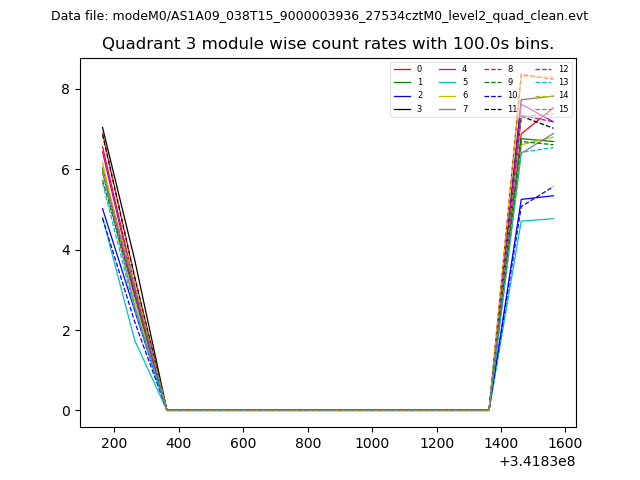
| Module-wise count rates for Quadrant C Data is divided into 100 sec bins |
 |
 |
| Module-wise count rates for Quadrant D Data is divided into 100 sec bins |
 |
 |
| Parameter | Plot |
|---|---|
| CZT HV Monitor | 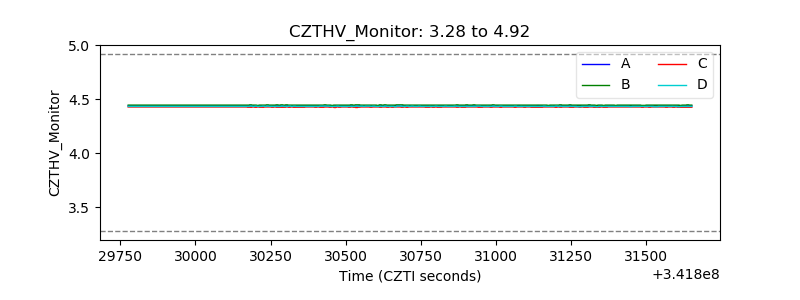 |
| D_VDD | 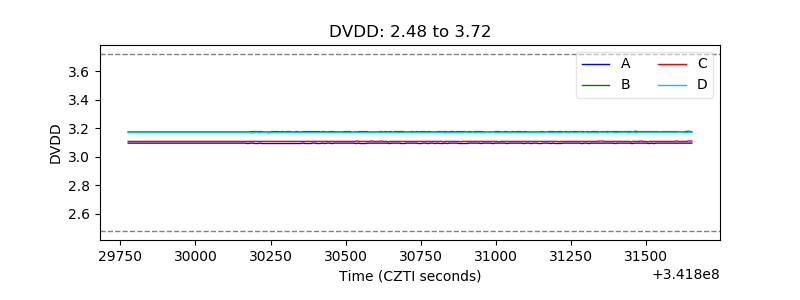 |
| Temperature 1 | 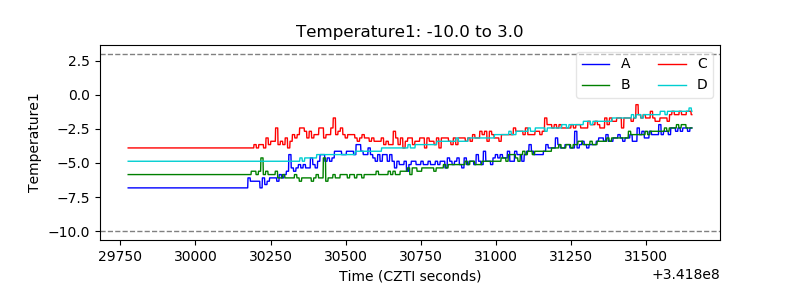 |
| Veto HV Monitor | 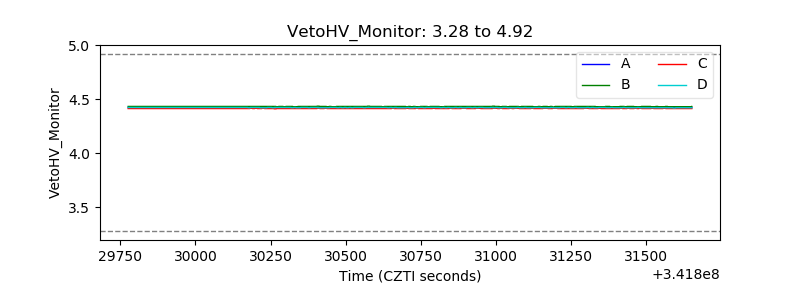 |
| Veto LLD | 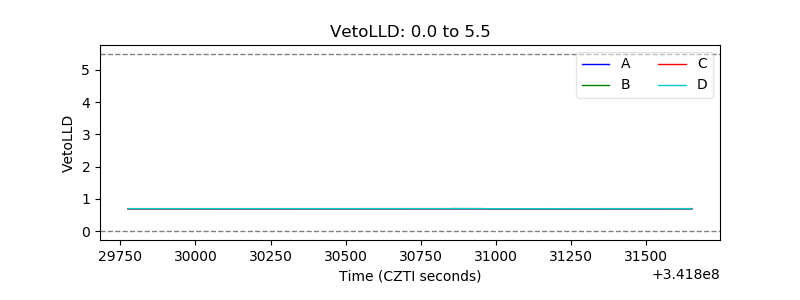 |
| Alpha Counter | 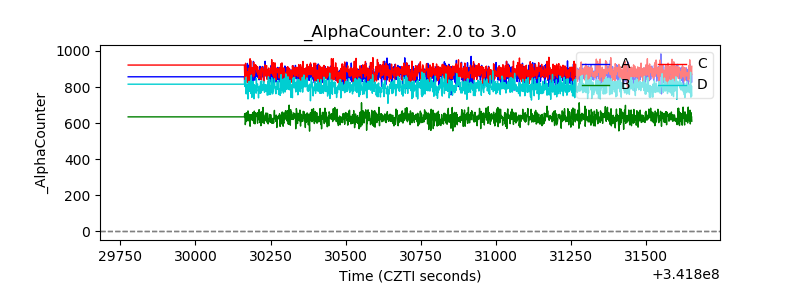 |
| _CPM_Rate | 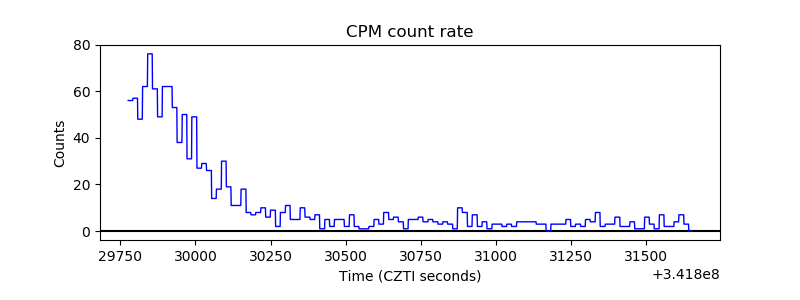 |
| CZT Counter | 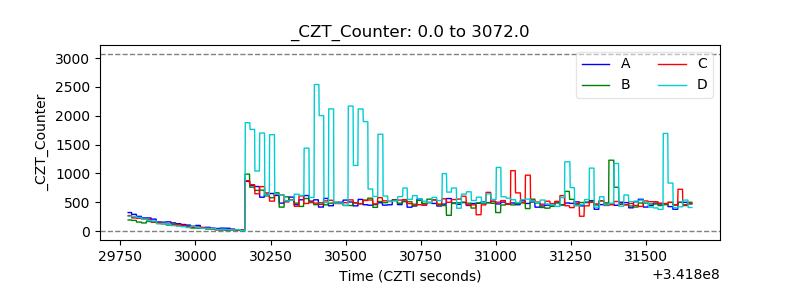 |
| +2.5 Volts monitor |  |
| +5 Volts monitor |  |
| _ROLL_ROT |  |
| _Roll_DEC | 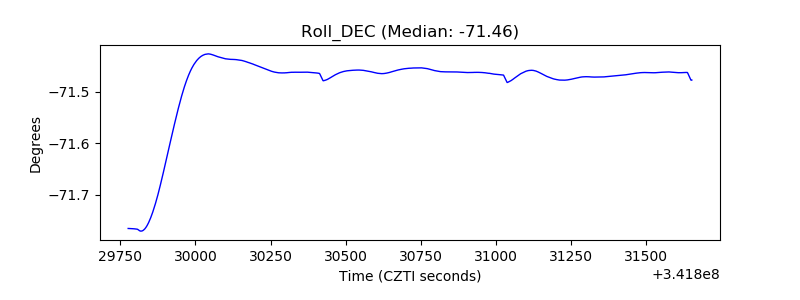 |
| _Roll_RA | 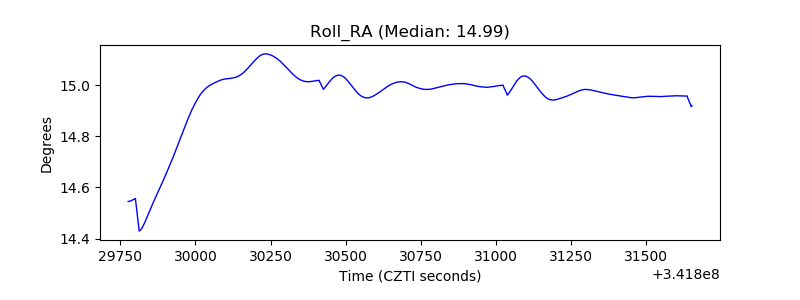 |
| Veto Counter | 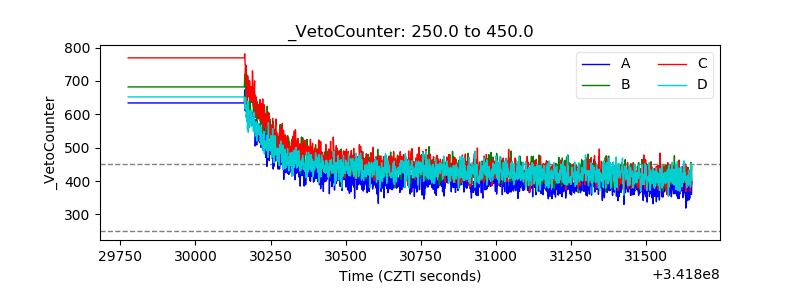 |