| Param | Original file | Final file |
|---|---|---|
| Filename | modeM0/AS1A09_038T15_9000003936_27535cztM0_level2.evt | modeM0/AS1A09_038T15_9000003936_27535cztM0_level2_quad_clean.evt |
| Size (bytes) | 442,336,320 | 83,335,680 |
| Size | 421.8 MB | 79.5 MB |
| Events in quadrant A | 2,563,788 | 552,177 |
| Events in quadrant B | 2,757,351 | 560,520 |
| Events in quadrant C | 2,713,205 | 535,311 |
| Events in quadrant D | 4,991,426 | 493,854 |
| Mode M0 | |||
|---|---|---|---|
| Quadrant | BADHDUFLAG | Total packets | Discarded packets |
| A | 0 | 11074 | 0 |
| B | 0 | 11633 | 0 |
| C | 0 | 11642 | 0 |
| D | 0 | 18416 | 0 |
| Quadrant | Total seconds | Saturated seconds | Saturation percentage |
|---|---|---|---|
| A | 5454 | 9 | 0.165017% |
| B | 5455 | 46 | 0.843263% |
| C | 5455 | 91 | 1.668194% |
| D | 5455 | 642 | 11.769019% |
Noise dominated data is calculated using 1-second bins in cleaned event files. If a bin has >2000 counts, and if more than 50% of those come from <1% of pixels, then it is considered to be noise-dominated and hence unusable.
| Quadrant | # 1 sec bins | Bins with >0 counts | Bins with >2000 counts | High rate bins dominated by noise | Noise dominated (total time) | Noise dominated (detector-on time) | Marked lightcurve |
|---|---|---|---|---|---|---|---|
| A | 5454 | 5454 | 7 | 7 | 0.13% | 0.13% | 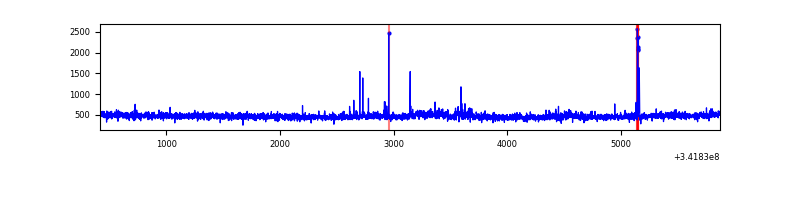 |
| B | 5455 | 5455 | 27 | 27 | 0.49% | 0.49% | 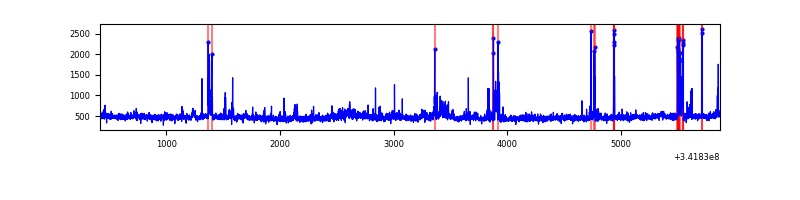 |
| C | 5455 | 5455 | 53 | 53 | 0.97% | 0.97% | 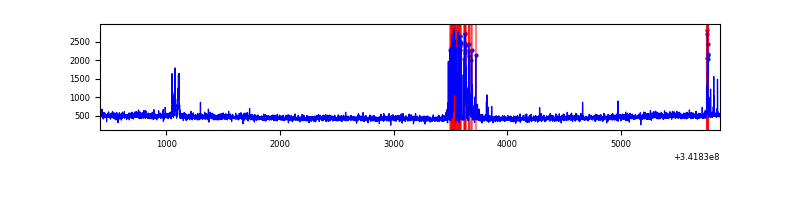 |
| D | 5455 | 5455 | 644 | 644 | 11.81% | 11.81% | 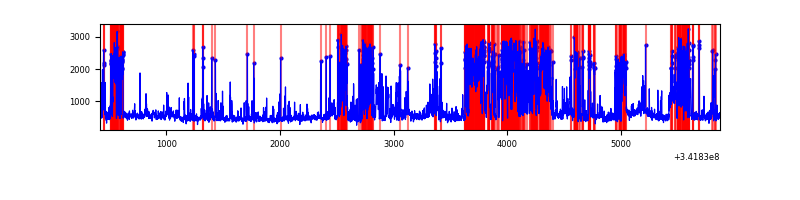 |
Top three noisy pixels from each quadrant. If the there are fewer than three noisy pixels in the level2.evt file, extra rows are filled as -1
| Pixel properties | Quadrant properties | ||||||
|---|---|---|---|---|---|---|---|
| Quadrant | DetID | PixID | Counts | Sigma | Mean | Median | Sigma |
| A | 0 | 13 | 94227 | 734.1 | 630 | 617 | 127.5 |
| A | 6 | 16 | 22458 | 171.28 | 630 | 617 | 127.5 |
| A | 0 | 31 | 11676 | 86.73 | 630 | 617 | 127.5 |
| B | 10 | 245 | 171181 | 1430.33 | 628 | 612 | 119.3 |
| B | 0 | 230 | 65196 | 541.58 | 628 | 612 | 119.3 |
| B | 15 | 33 | 27170 | 222.71 | 628 | 612 | 119.3 |
| C | 2 | 16 | 237036 | 1657.53 | 606 | 609 | 142.6 |
| C | 14 | 238 | 97911 | 682.16 | 606 | 609 | 142.6 |
| C | 1 | 16 | 10234 | 67.48 | 606 | 609 | 142.6 |
| D | 1 | 52 | 2037214 | 14626.56 | 580 | 564 | 139.2 |
| D | 7 | 80 | 481922 | 3456.96 | 580 | 564 | 139.2 |
| D | 2 | 250 | 118877 | 849.69 | 580 | 564 | 139.2 |
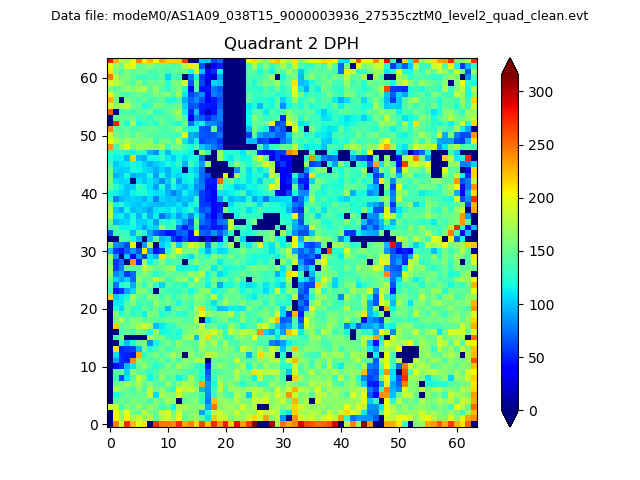
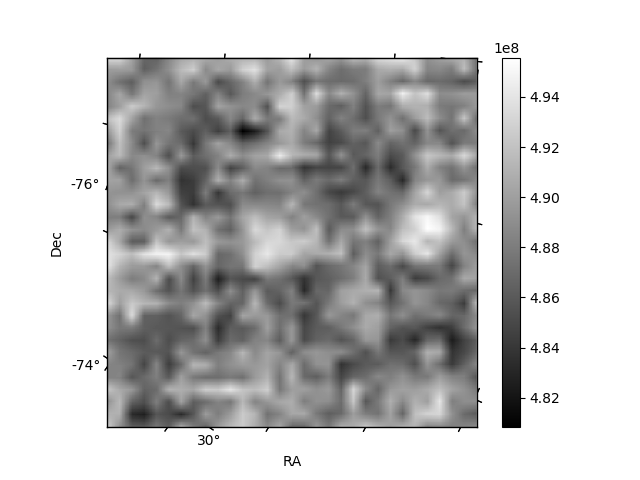
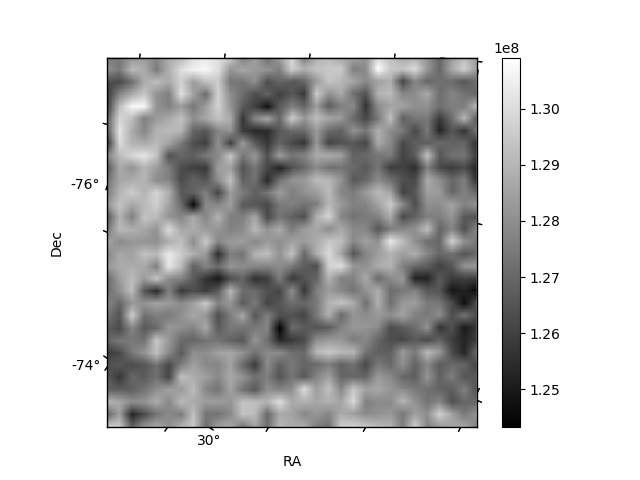
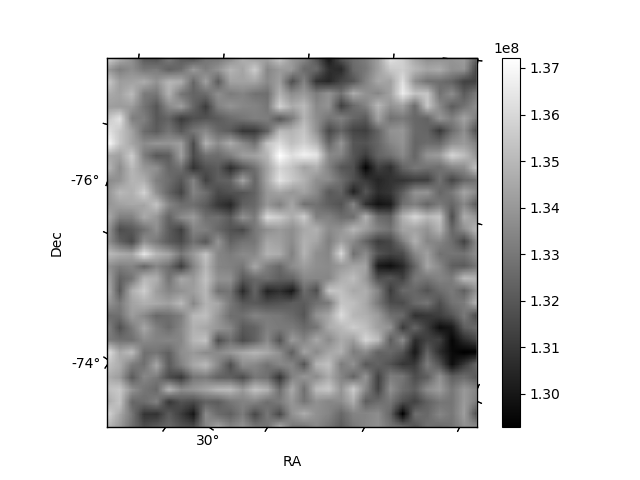
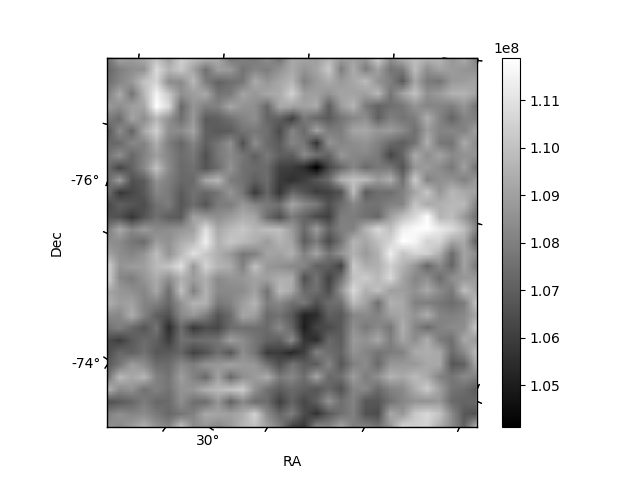
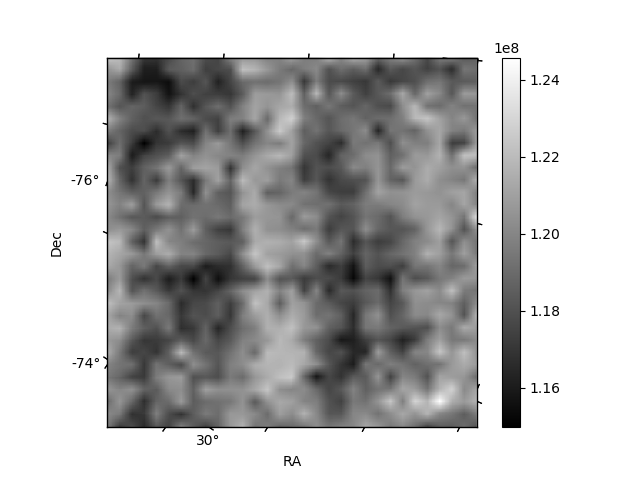
Histogram calculated using DETX and DETY for each event in the final _common_clean file
| Quadrant A | 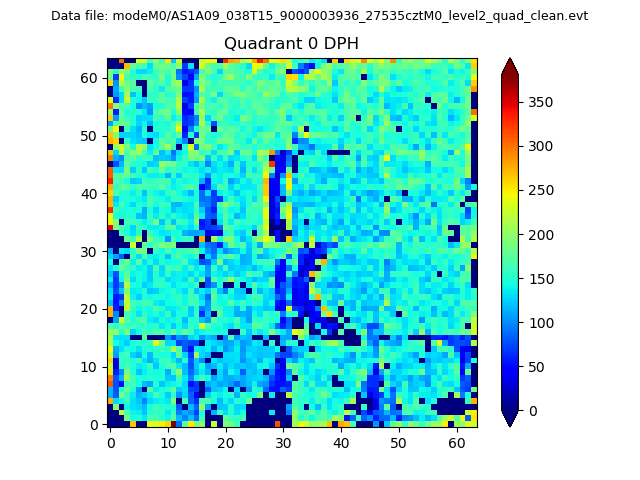 |
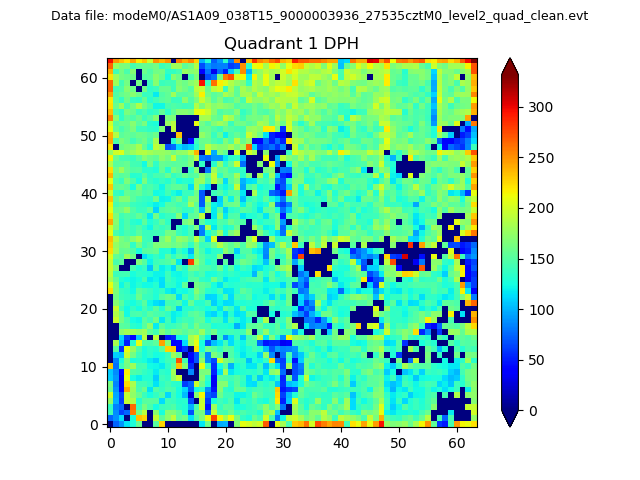 |
Quadrant B |
|---|---|---|---|
| Quadrant D | 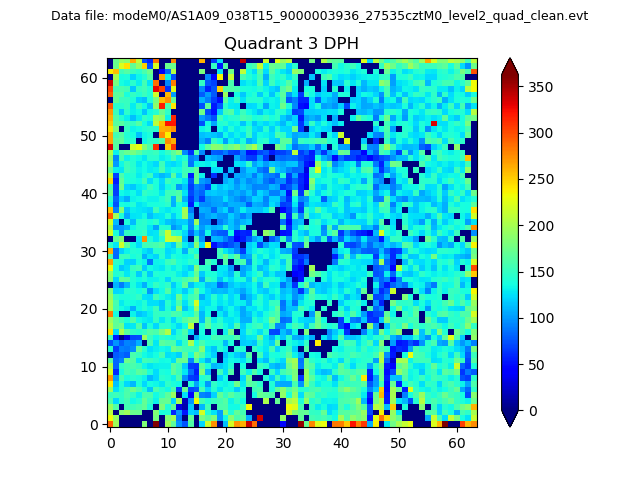 |
 |
Quadrant C |
| Plot type | Count rate plots | Images |
|---|---|---|
| Comparison with Poisson distribution Blue bars denote a histogram of data divided into 1 sec bins. Red curve is a Poisson curve with rate = median count rate of data. |
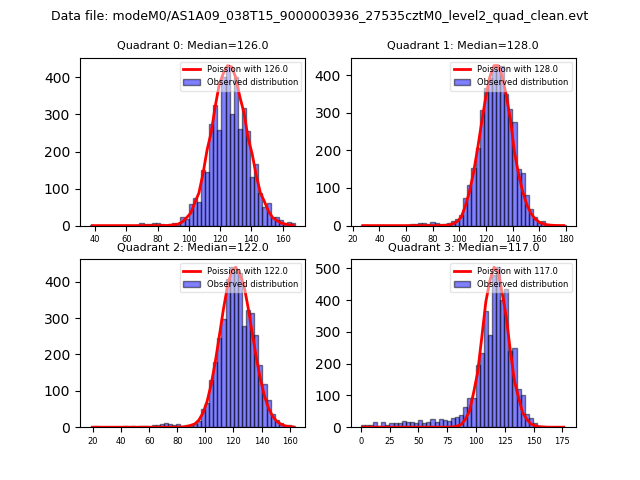 |
 |
| Quadrant-wise count rates Data is divided into 100 sec bins |
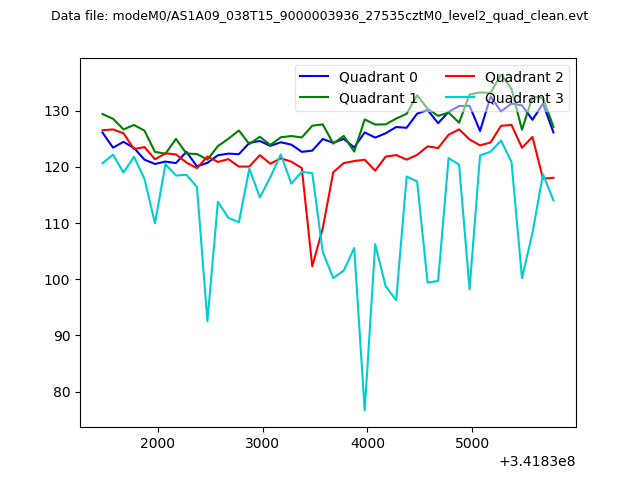 |
|
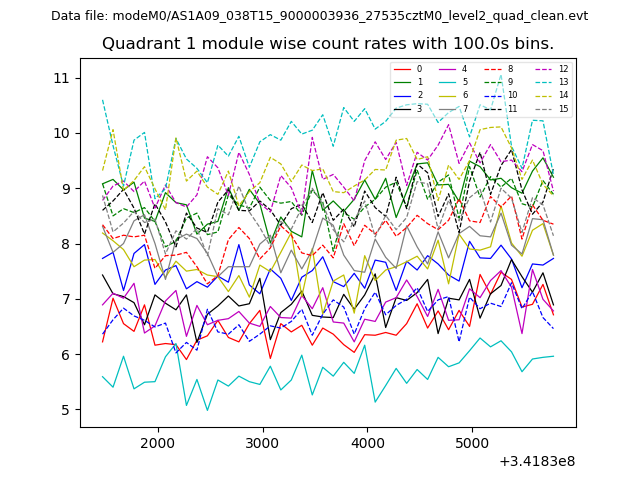
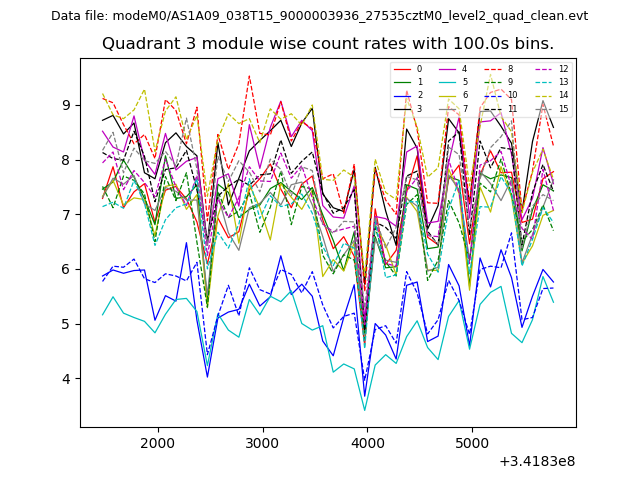
| Module-wise count rates for Quadrant A Data is divided into 100 sec bins |
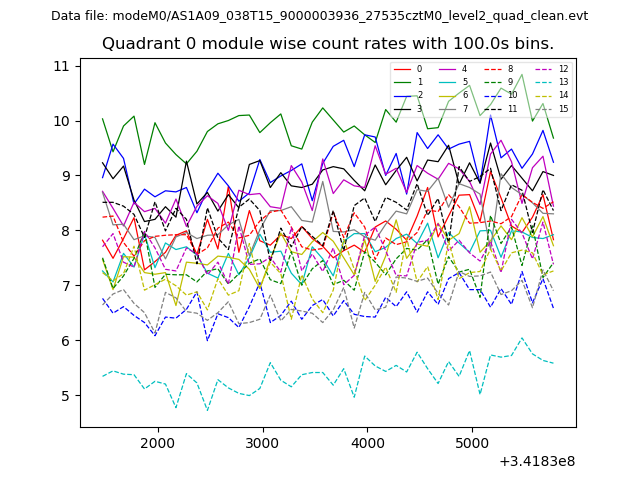 |
 |
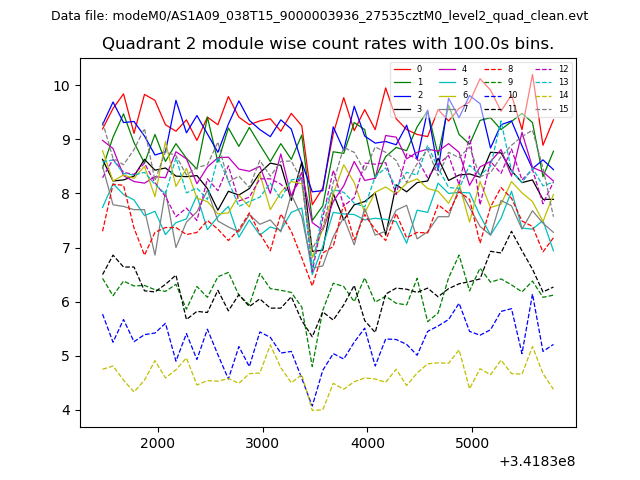
| Module-wise count rates for Quadrant B Data is divided into 100 sec bins |
 |
 |
| Module-wise count rates for Quadrant C Data is divided into 100 sec bins |
 |
 |
| Module-wise count rates for Quadrant D Data is divided into 100 sec bins |
 |
 |
| Parameter | Plot |
|---|---|
| CZT HV Monitor | 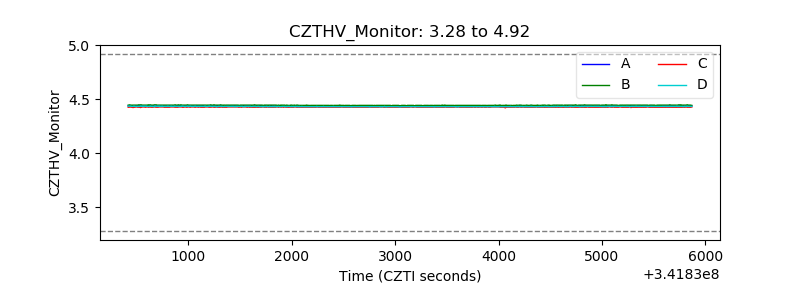 |
| D_VDD | 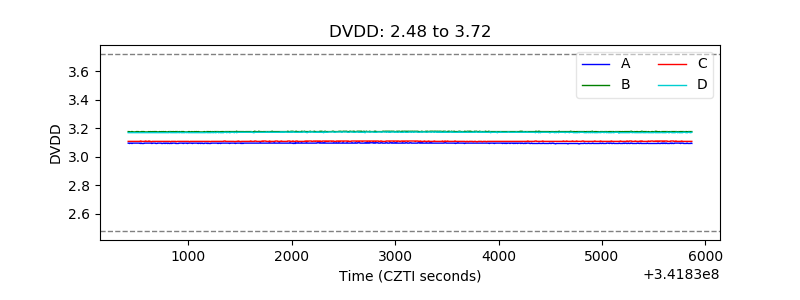 |
| Temperature 1 | 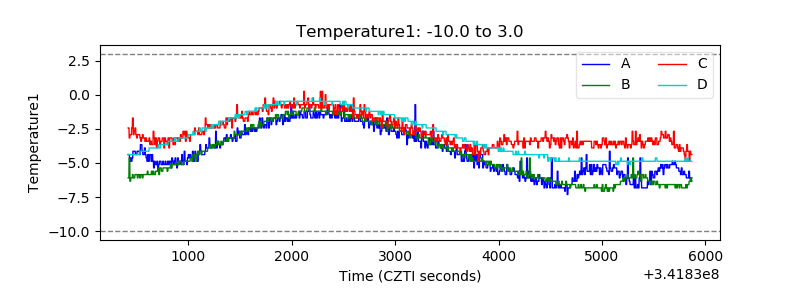 |
| Veto HV Monitor | 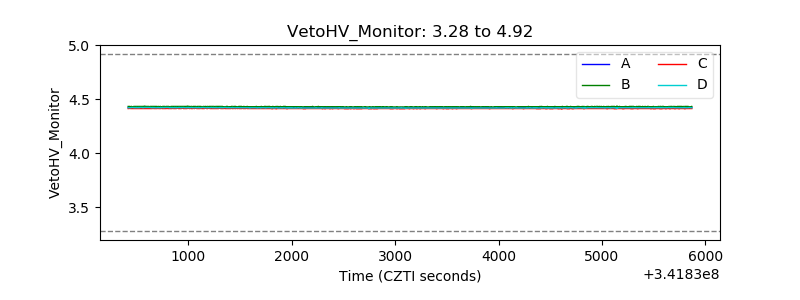 |
| Veto LLD | 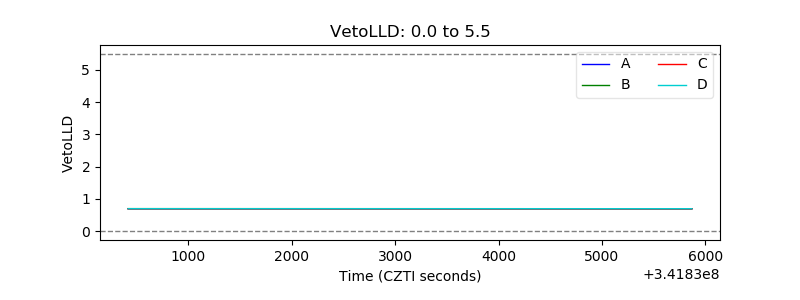 |
| Alpha Counter | 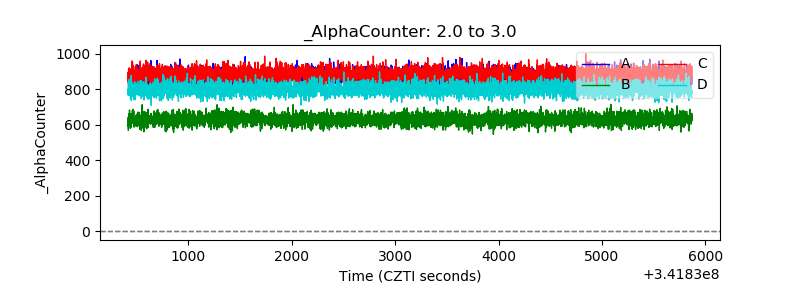 |
| _CPM_Rate | 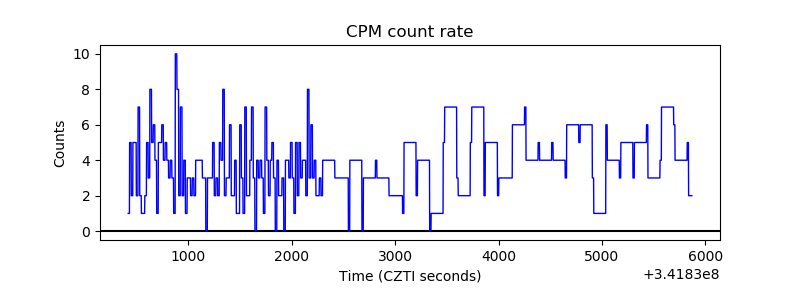 |
| CZT Counter | 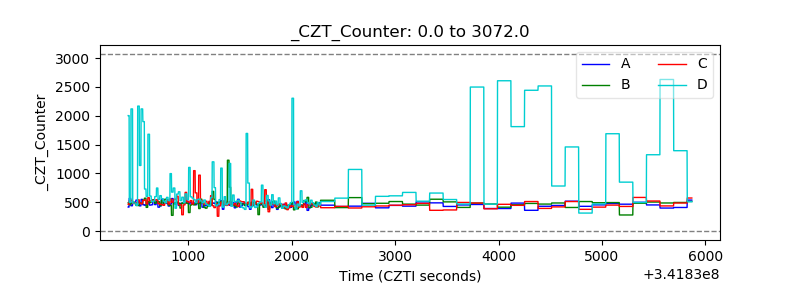 |
| +2.5 Volts monitor |  |
| +5 Volts monitor | 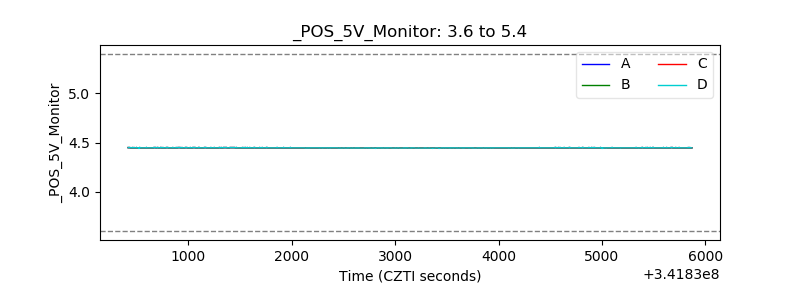 |
| _ROLL_ROT | 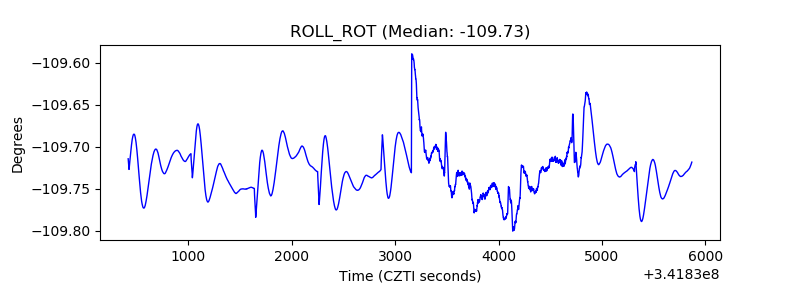 |
| _Roll_DEC | 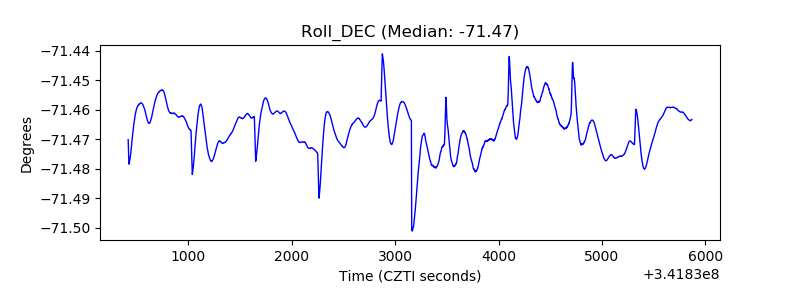 |
| _Roll_RA | 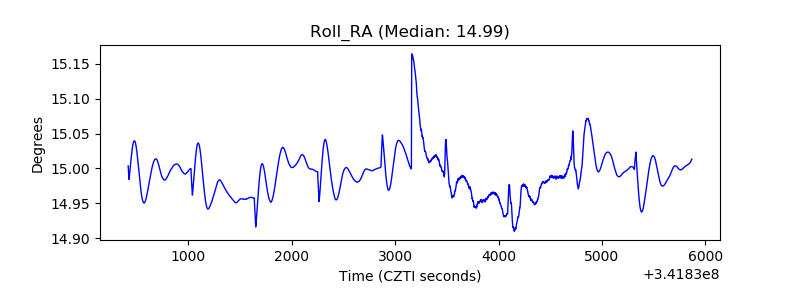 |
| Veto Counter |  |