| Param | Original file | Final file |
|---|---|---|
| Filename | modeM0/AS1A09_038T16_9000003938cztM0_level2.fits | modeM0/AS1A09_038T16_9000003938cztM0_level2_quad_clean.evt |
| Size (bytes) | 54,970,560 | 69,768,000 |
| Size | 52.4 MB | 66.5 MB |
| Events in quadrant A | 333,778 | 452,705 |
| Events in quadrant B | 322,774 | 451,396 |
| Events in quadrant C | 324,106 | 429,374 |
| Events in quadrant D | 272,670 | 367,636 |
| Mode M0 | |||
|---|---|---|---|
| Quadrant | BADHDUFLAG | Total packets | Discarded packets |
| A | 0 | 12127 | 0 |
| B | 0 | 12753 | 0 |
| C | 0 | 12586 | 0 |
| D | 0 | 17108 | 0 |
| Mode SS | |||
|---|---|---|---|
| Quadrant | BADHDUFLAG | Total packets | Discarded packets |
| A | 0 | 118 | 0 |
| B | 0 | 118 | 0 |
| C | 0 | 118 | 0 |
| D | 0 | 118 | 0 |
| Quadrant | Total seconds | Saturated seconds | Saturation percentage |
|---|---|---|---|
| A | 5883 | 124 | 2.107768% |
| B | 5883 | 171 | 2.906680% |
| C | 5883 | 162 | 2.753697% |
| D | 5883 | 503 | 8.550059% |
Noise dominated data is calculated using 1-second bins in cleaned event files. If a bin has >2000 counts, and if more than 50% of those come from <1% of pixels, then it is considered to be noise-dominated and hence unusable.
| Quadrant | # 1 sec bins | Bins with >0 counts | Bins with >2000 counts | High rate bins dominated by noise | Noise dominated (total time) | Noise dominated (detector-on time) | Marked lightcurve |
|---|---|---|---|---|---|---|---|
| A | 5943 | 5883 | 0 | 0 | 0.00% | 0.00% | 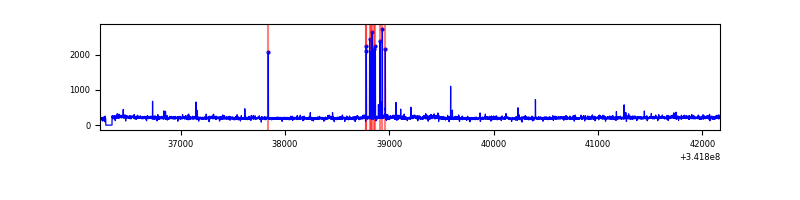 |
| B | 5942 | 5881 | 0 | 0 | 0.00% | 0.00% | 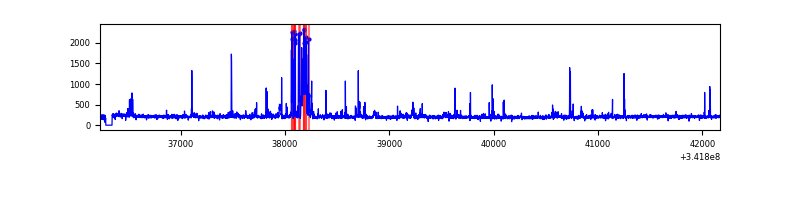 |
| C | 5942 | 5881 | 0 | 0 | 0.00% | 0.00% |  |
| D | 5942 | 5833 | 0 | 0 | 0.00% | 0.00% | 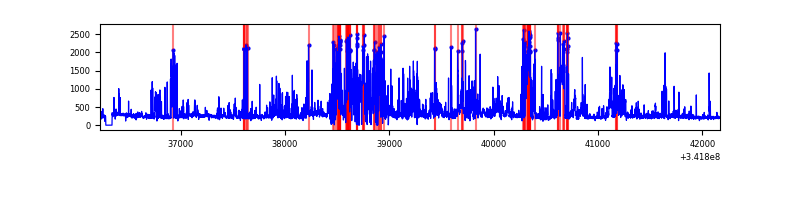 |
Top three noisy pixels from each quadrant. If the there are fewer than three noisy pixels in the level2.evt file, extra rows are filled as -1
| Pixel properties | Quadrant properties | ||||||
|---|---|---|---|---|---|---|---|
| Quadrant | DetID | PixID | Counts | Sigma | Mean | Median | Sigma |
| A | 14 | 188 | 327 | 10.29 | 87 | 82 | 23.8 |
| A | 7 | 110 | 277 | 8.19 | 87 | 82 | 23.8 |
| A | 14 | 204 | 271 | 7.94 | 87 | 82 | 23.8 |
| B | 2 | 9 | 236 | 8.12 | 85 | 81 | 19.1 |
| B | 3 | 80 | 224 | 7.5 | 85 | 81 | 19.1 |
| B | 14 | 254 | 221 | 7.34 | 85 | 81 | 19.1 |
| C | 12 | 249 | 232 | 6.5 | 85 | 80 | 23.4 |
| C | 12 | 242 | 223 | 6.11 | 85 | 80 | 23.4 |
| C | 9 | 242 | 220 | 5.99 | 85 | 80 | 23.4 |
| D | 3 | 14 | 225 | 6.88 | 77 | 70 | 22.5 |
| D | 4 | 246 | 221 | 6.7 | 77 | 70 | 22.5 |
| D | 4 | 160 | 209 | 6.17 | 77 | 70 | 22.5 |
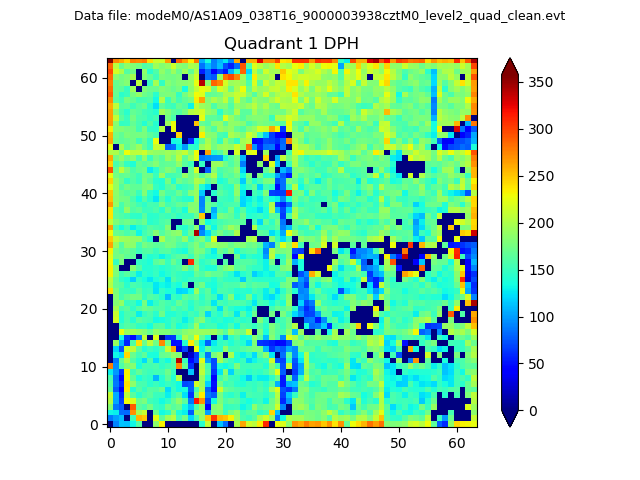
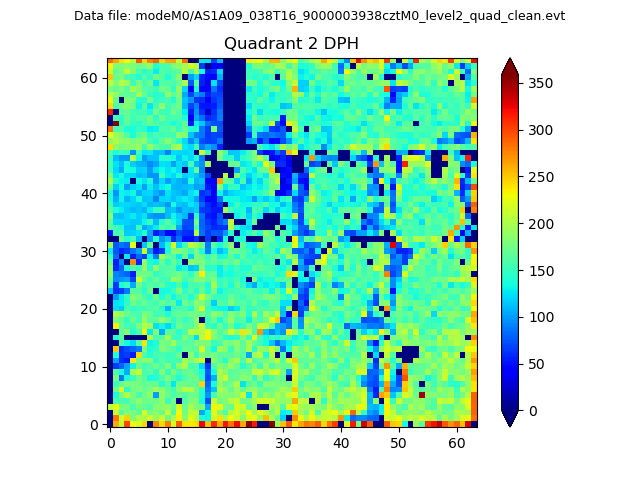
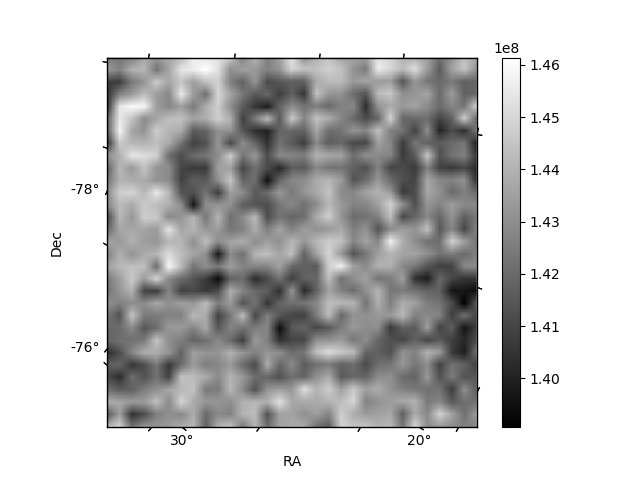
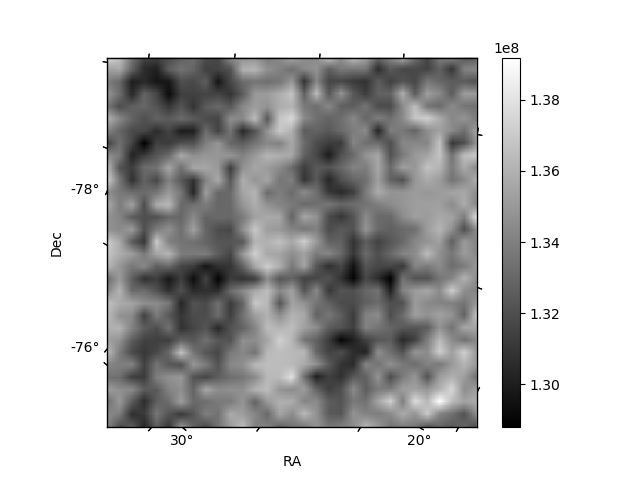
Histogram calculated using DETX and DETY for each event in the final _common_clean file
| Quadrant A | 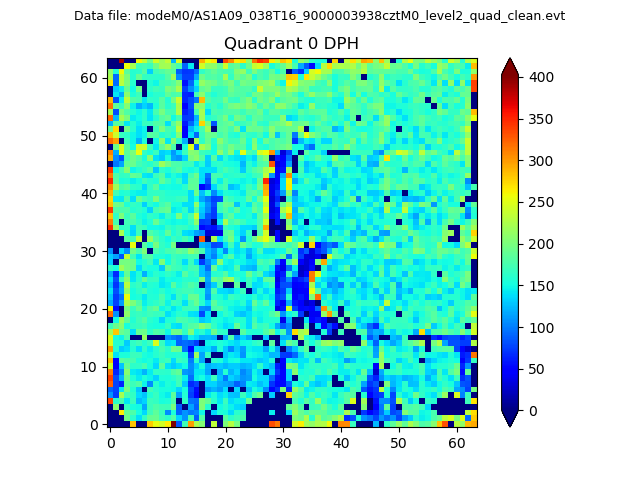 |
 |
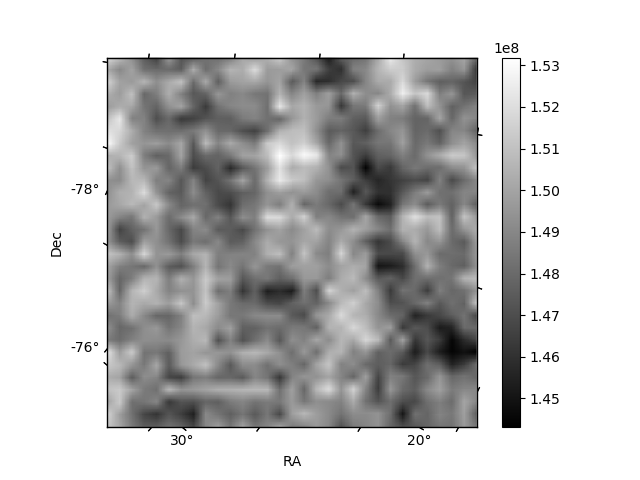
Quadrant B |
|---|---|---|---|
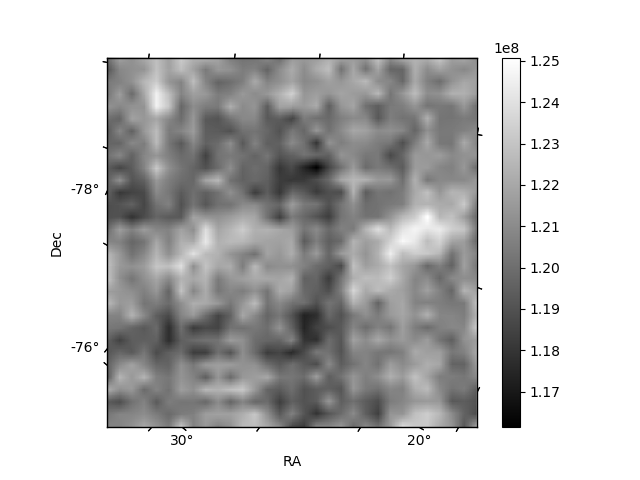
| Quadrant D | 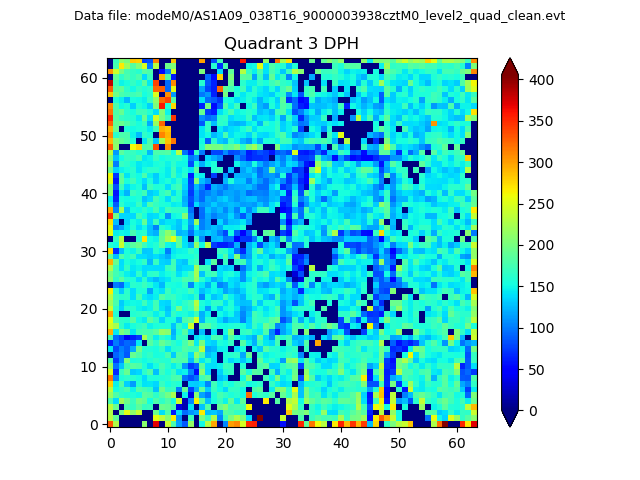 |
 |
Quadrant C |
| Plot type | Count rate plots | Images |
|---|---|---|
| Comparison with Poisson distribution Blue bars denote a histogram of data divided into 1 sec bins. Red curve is a Poisson curve with rate = median count rate of data. |
 |
 |
| Quadrant-wise count rates Data is divided into 100 sec bins |
 |
|
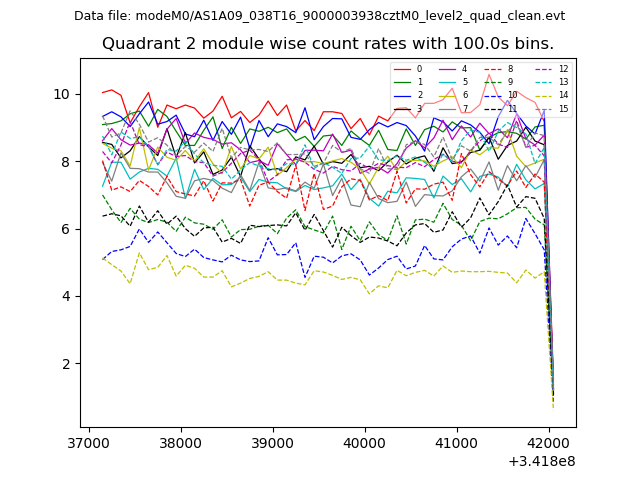
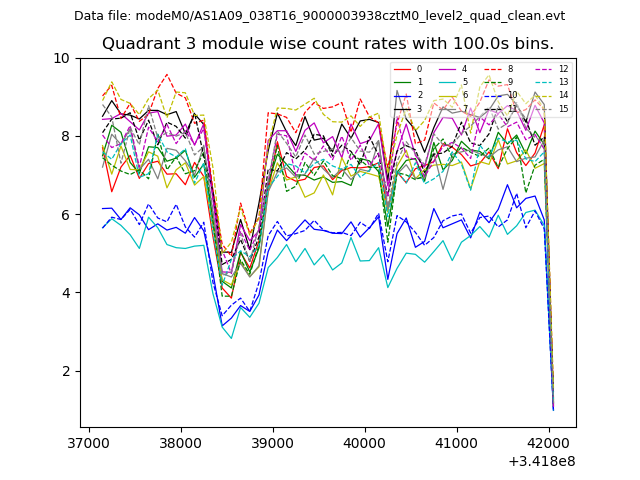
| Module-wise count rates for Quadrant A Data is divided into 100 sec bins |
 |
 |
| Module-wise count rates for Quadrant B Data is divided into 100 sec bins |
 |
 |
| Module-wise count rates for Quadrant C Data is divided into 100 sec bins |
 |
 |
| Module-wise count rates for Quadrant D Data is divided into 100 sec bins |
 |
 |
| Parameter | Plot |
|---|---|
| CZT HV Monitor | 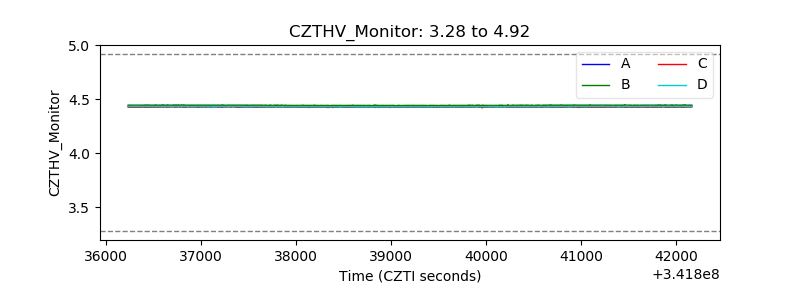 |
| D_VDD | 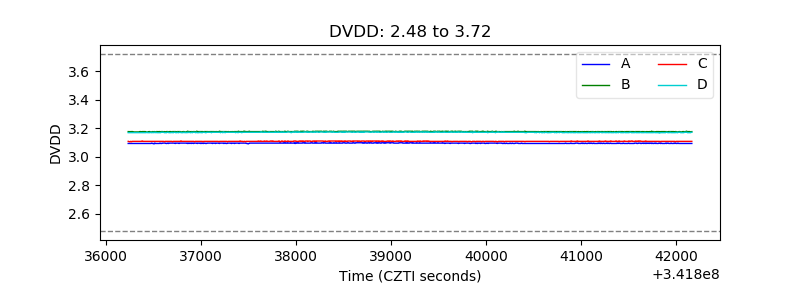 |
| Temperature 1 | 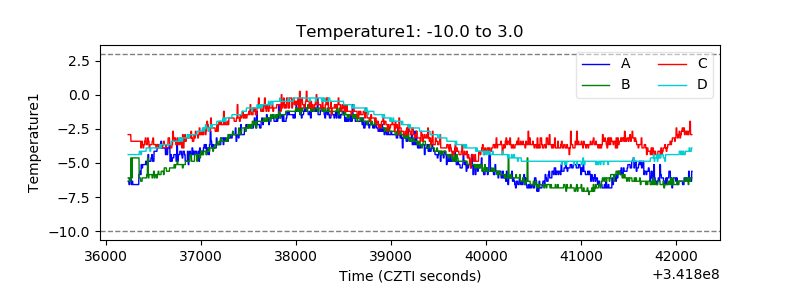 |
| Veto HV Monitor |  |
| Veto LLD |  |
| Alpha Counter |  |
| _CPM_Rate | 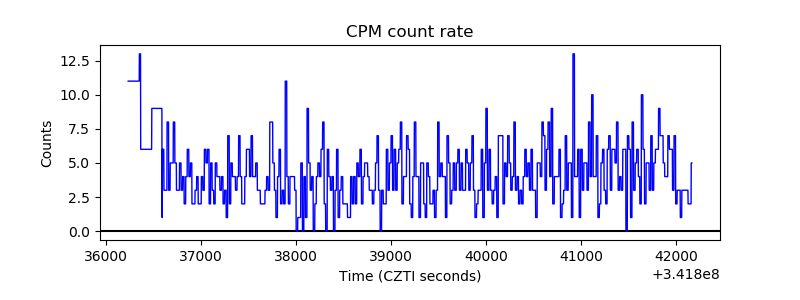 |
| CZT Counter | 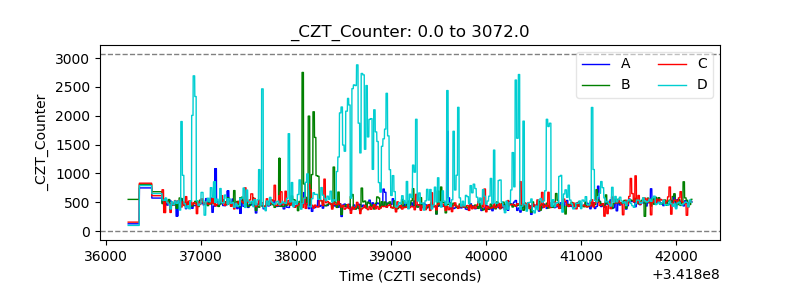 |
| +2.5 Volts monitor | 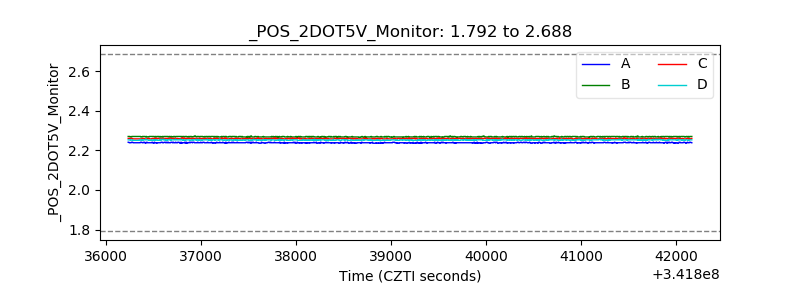 |
| +5 Volts monitor | 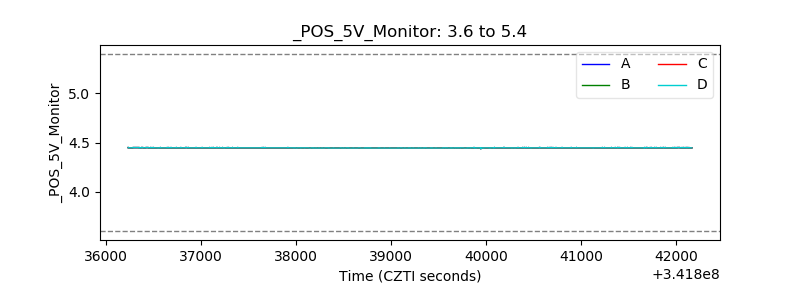 |
| _ROLL_ROT | 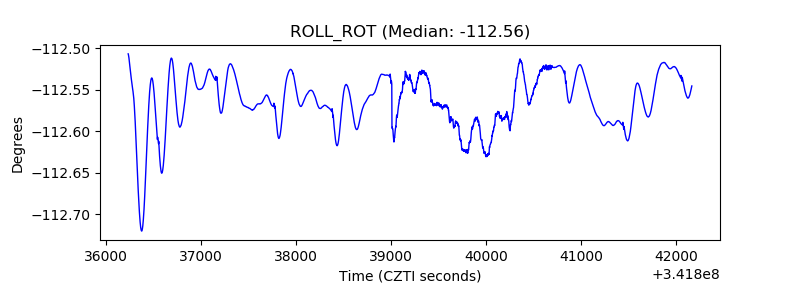 |
| _Roll_DEC | 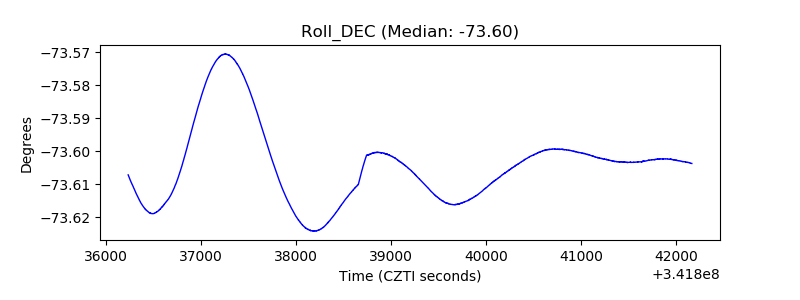 |
| _Roll_RA |  |
| Veto Counter | 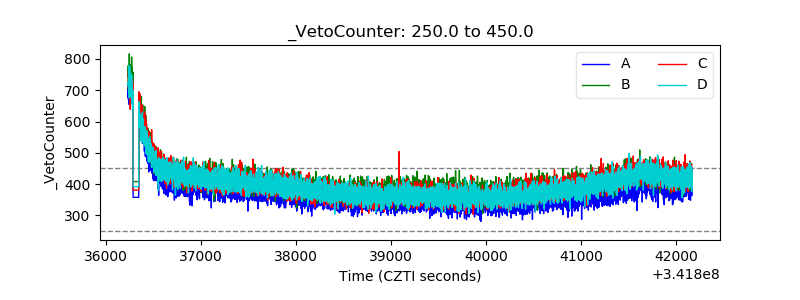 |