| Param | Original file | Final file |
|---|---|---|
| Filename | modeM0/AS1A09_038T16_9000003938_27535cztM0_level2.evt | modeM0/AS1A09_038T16_9000003938_27535cztM0_level2_quad_clean.evt |
| Size (bytes) | 128,764,800 | 17,498,880 |
| Size | 122.8 MB | 16.7 MB |
| Events in quadrant A | 858,073 | 100,549 |
| Events in quadrant B | 894,666 | 104,608 |
| Events in quadrant C | 939,947 | 101,923 |
| Events in quadrant D | 1,090,066 | 98,776 |
| Mode M0 | |||
|---|---|---|---|
| Quadrant | BADHDUFLAG | Total packets | Discarded packets |
| A | 0 | 3587 | 0 |
| B | 0 | 3703 | 0 |
| C | 0 | 3796 | 0 |
| D | 0 | 4272 | 0 |
| Quadrant | Total seconds | Saturated seconds | Saturation percentage |
|---|---|---|---|
| A | 1678 | 109 | 6.495828% |
| B | 1678 | 118 | 7.032181% |
| C | 1678 | 135 | 8.045292% |
| D | 1678 | 126 | 7.508939% |
Noise dominated data is calculated using 1-second bins in cleaned event files. If a bin has >2000 counts, and if more than 50% of those come from <1% of pixels, then it is considered to be noise-dominated and hence unusable.
| Quadrant | # 1 sec bins | Bins with >0 counts | Bins with >2000 counts | High rate bins dominated by noise | Noise dominated (total time) | Noise dominated (detector-on time) | Marked lightcurve |
|---|---|---|---|---|---|---|---|
| A | 1738 | 1678 | 1 | 1 | 0.06% | 0.06% | 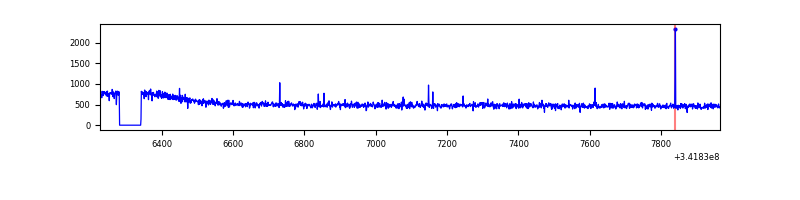 |
| B | 1738 | 1678 | 4 | 4 | 0.23% | 0.24% | 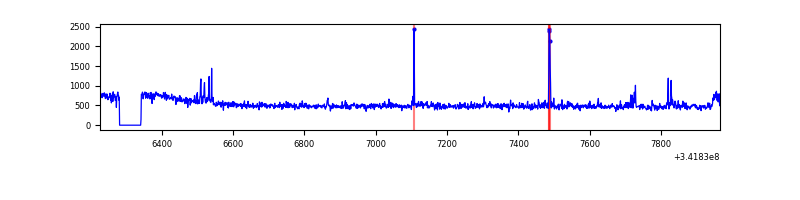 |
| C | 1738 | 1678 | 3 | 3 | 0.17% | 0.18% | 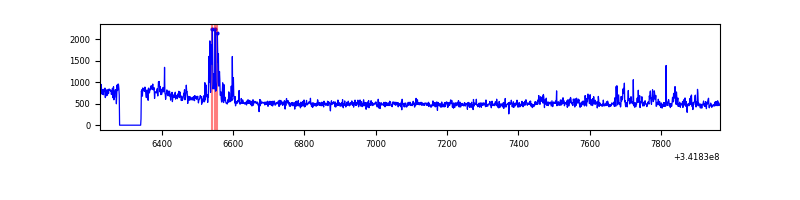 |
| D | 1738 | 1678 | 44 | 44 | 2.53% | 2.62% | 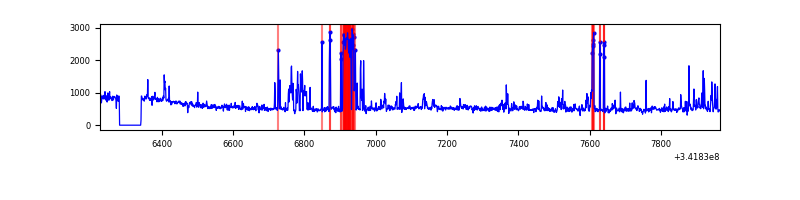 |
Top three noisy pixels from each quadrant. If the there are fewer than three noisy pixels in the level2.evt file, extra rows are filled as -1
| Pixel properties | Quadrant properties | ||||||
|---|---|---|---|---|---|---|---|
| Quadrant | DetID | PixID | Counts | Sigma | Mean | Median | Sigma |
| A | 0 | 13 | 10525 | 226.29 | 218 | 212 | 45.6 |
| A | 6 | 16 | 4562 | 95.44 | 218 | 212 | 45.6 |
| A | 13 | 254 | 2361 | 47.15 | 218 | 212 | 45.6 |
| B | 10 | 245 | 27955 | 644.7 | 215 | 209 | 43.0 |
| B | 0 | 230 | 6949 | 156.61 | 215 | 209 | 43.0 |
| B | 4 | 200 | 6211 | 139.46 | 215 | 209 | 43.0 |
| C | 2 | 16 | 39254 | 768.5 | 212 | 212 | 50.8 |
| C | 7 | 221 | 38733 | 758.25 | 212 | 212 | 50.8 |
| C | 14 | 238 | 34185 | 668.73 | 212 | 212 | 50.8 |
| D | 1 | 52 | 237598 | 4542.78 | 214 | 207 | 52.3 |
| D | 8 | 195 | 12430 | 233.9 | 214 | 207 | 52.3 |
| D | 12 | 227 | 9307 | 174.14 | 214 | 207 | 52.3 |
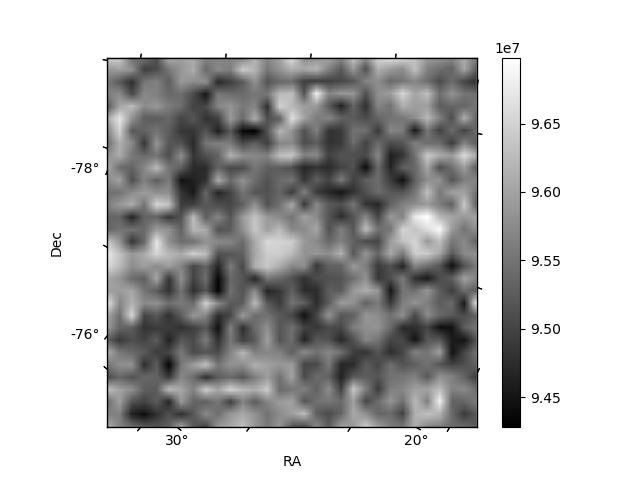
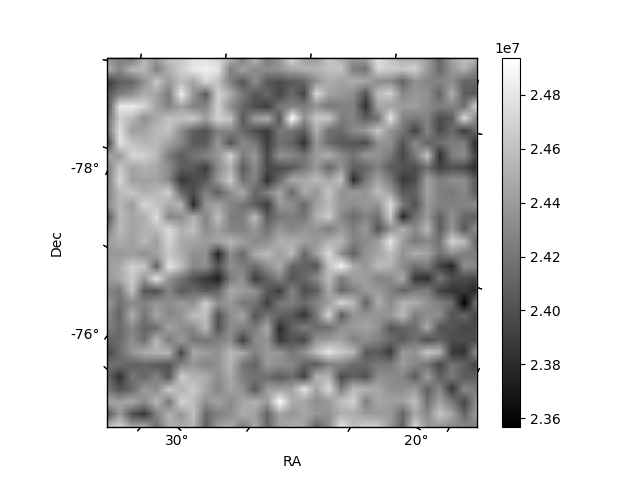
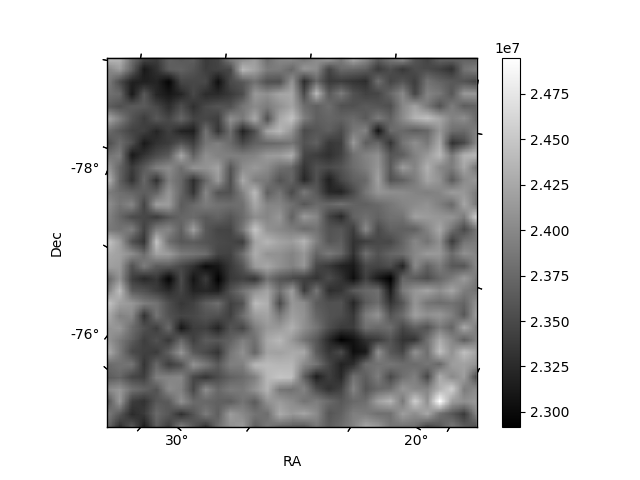
Histogram calculated using DETX and DETY for each event in the final _common_clean file
| Quadrant A | 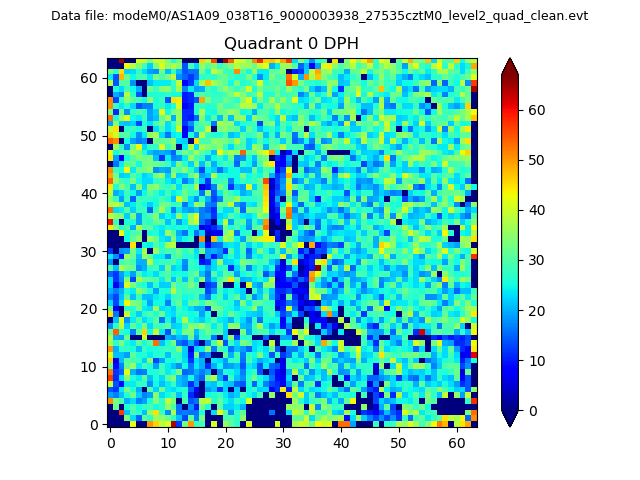 |
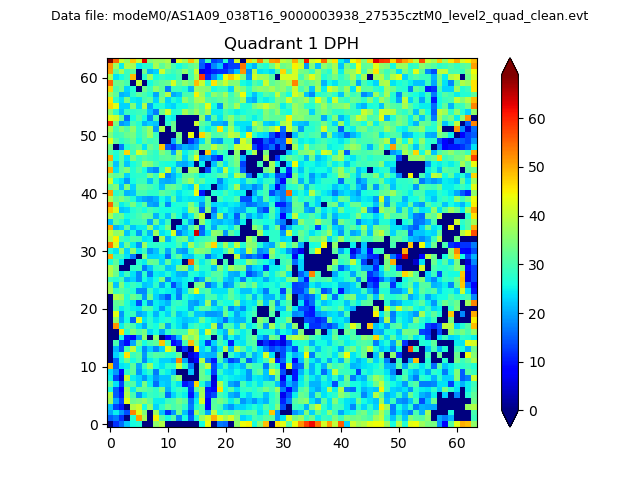 |
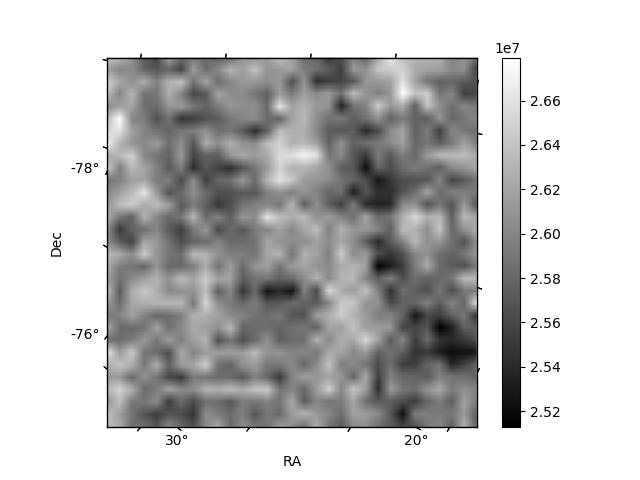
Quadrant B |
|---|---|---|---|
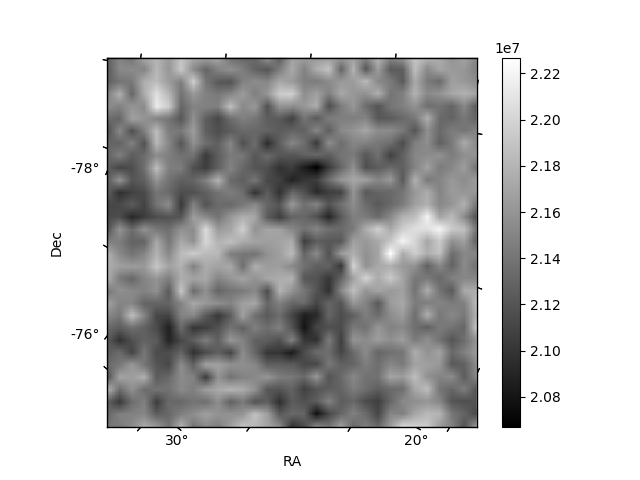
| Quadrant D | 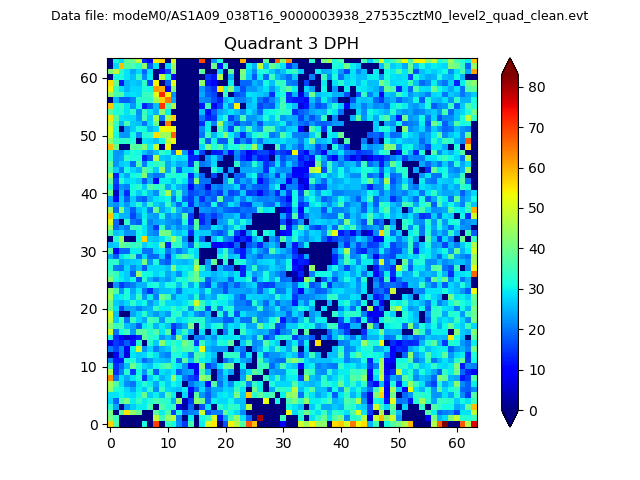 |
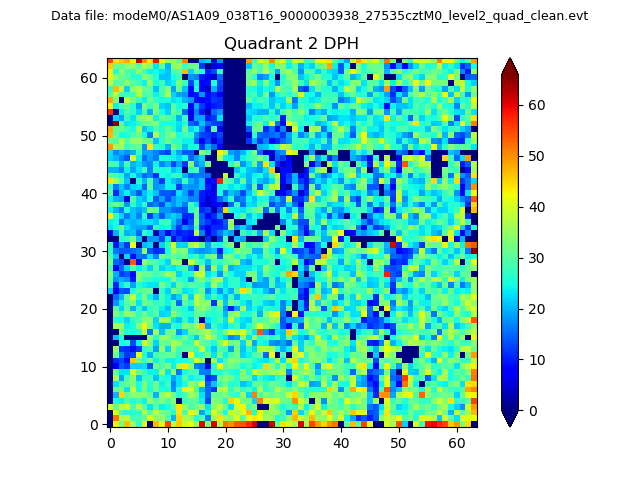 |
Quadrant C |
| Plot type | Count rate plots | Images |
|---|---|---|
| Comparison with Poisson distribution Blue bars denote a histogram of data divided into 1 sec bins. Red curve is a Poisson curve with rate = median count rate of data. |
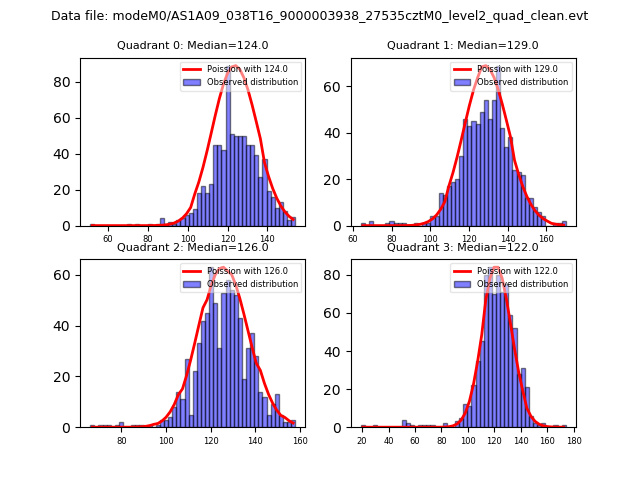 |
 |
| Quadrant-wise count rates Data is divided into 100 sec bins |
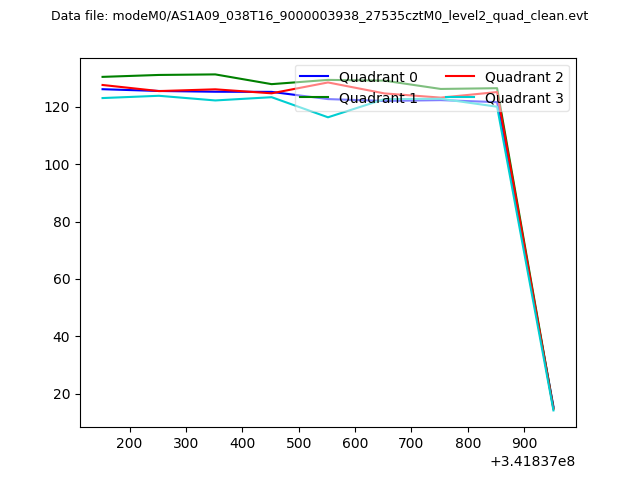 |
|
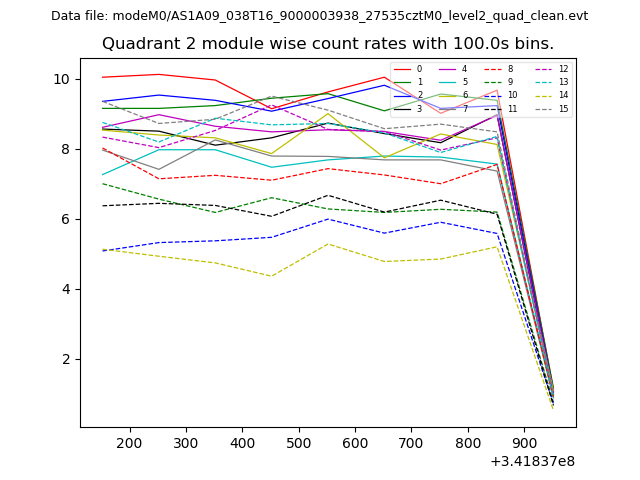
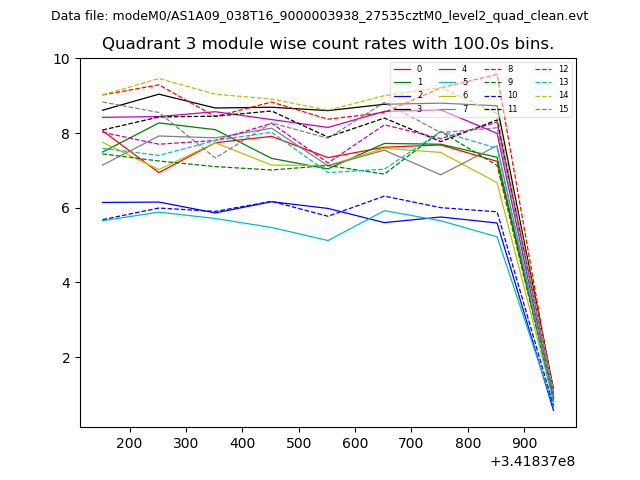
| Module-wise count rates for Quadrant A Data is divided into 100 sec bins |
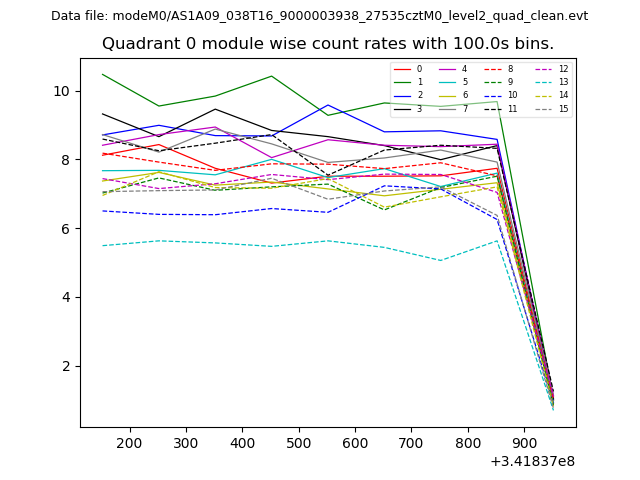 |
 |
| Module-wise count rates for Quadrant B Data is divided into 100 sec bins |
 |
 |
| Module-wise count rates for Quadrant C Data is divided into 100 sec bins |
 |
 |
| Module-wise count rates for Quadrant D Data is divided into 100 sec bins |
 |
 |
| Parameter | Plot |
|---|---|
| CZT HV Monitor |  |
| D_VDD | 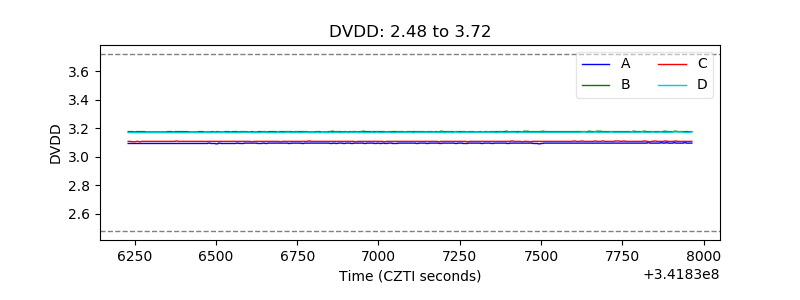 |
| Temperature 1 | 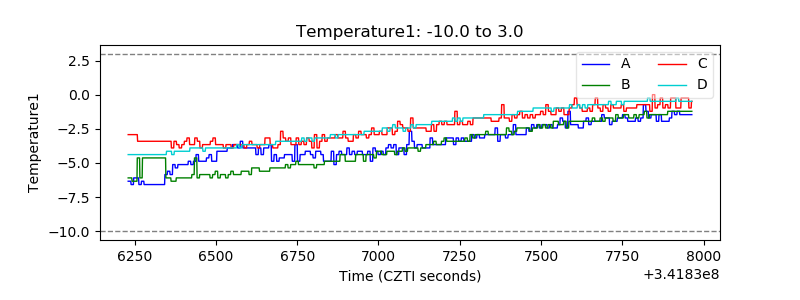 |
| Veto HV Monitor | 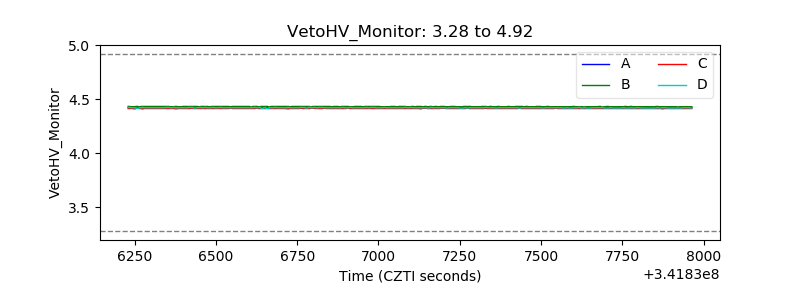 |
| Veto LLD | 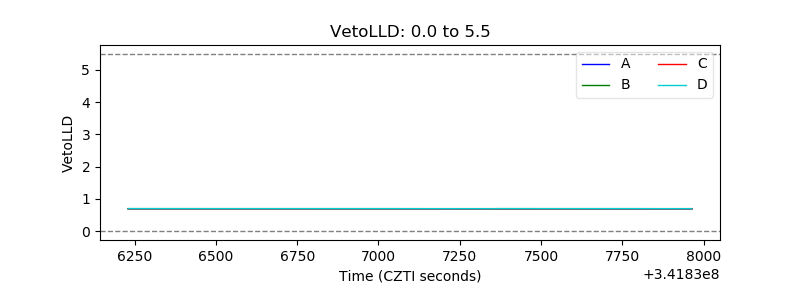 |
| Alpha Counter | 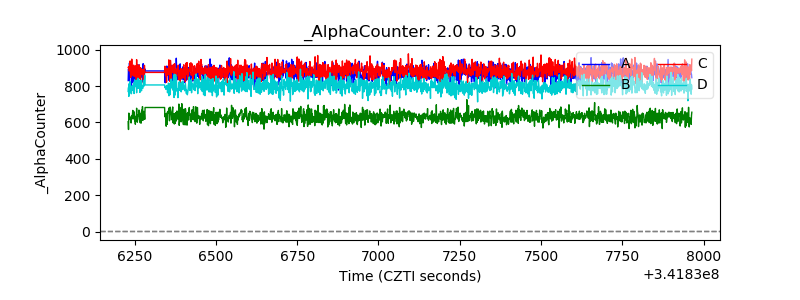 |
| _CPM_Rate | 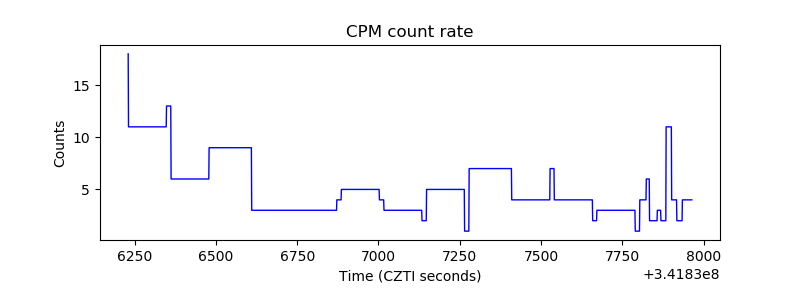 |
| CZT Counter | 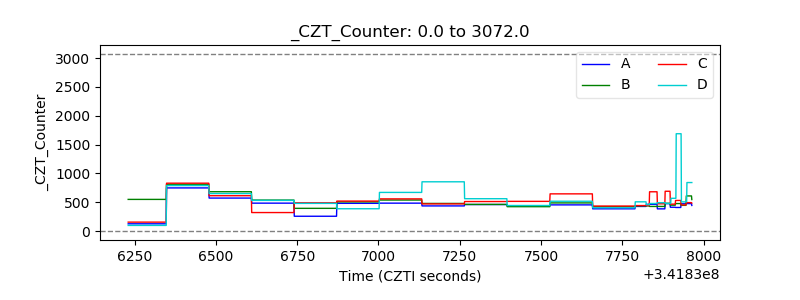 |
| +2.5 Volts monitor |  |
| +5 Volts monitor | 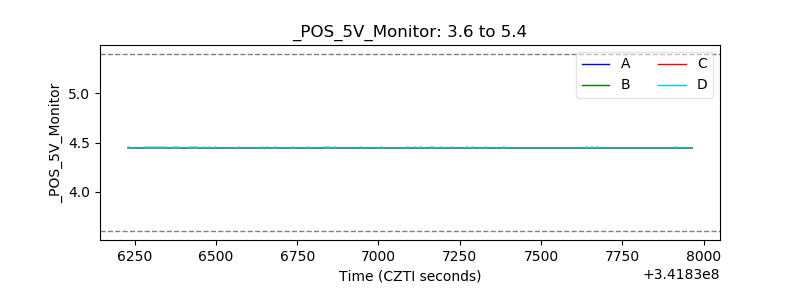 |
| _ROLL_ROT | 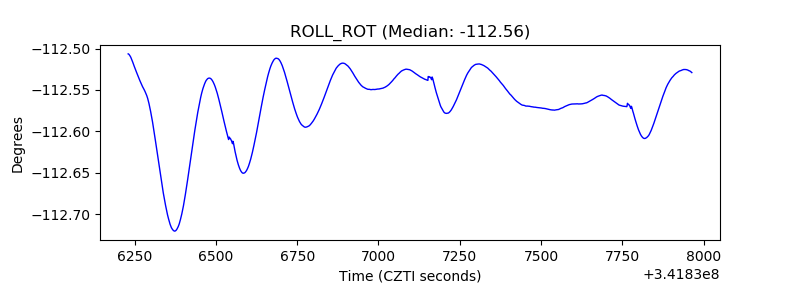 |
| _Roll_DEC | 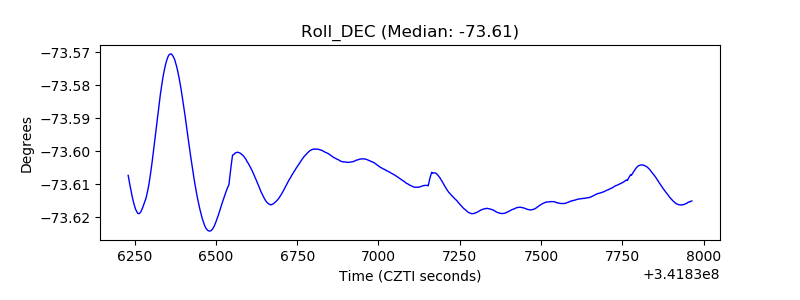 |
| _Roll_RA | 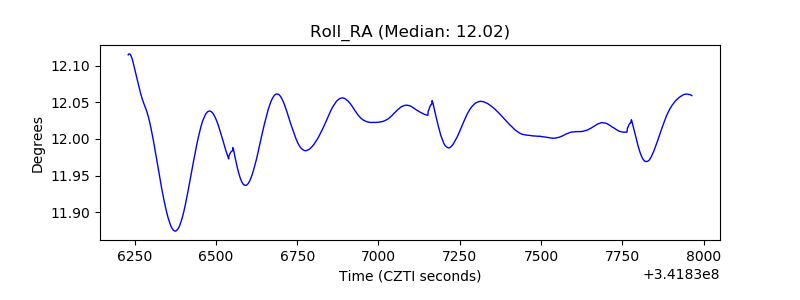 |
| Veto Counter | 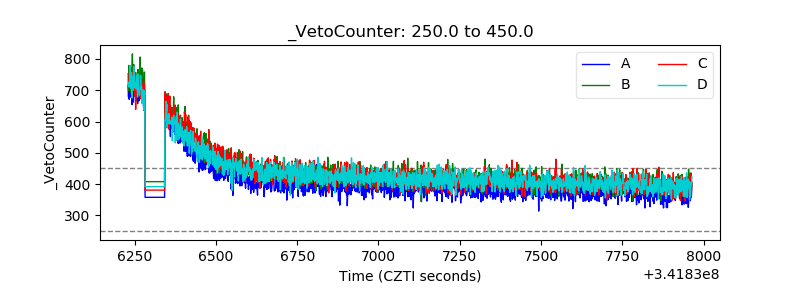 |