| Param | Original file | Final file |
|---|---|---|
| Filename | modeM0/AS1A09_038T16_9000003938_27536cztM0_level2.evt | modeM0/AS1A09_038T16_9000003938_27536cztM0_level2_quad_clean.evt |
| Size (bytes) | 375,897,600 | 89,772,480 |
| Size | 358.5 MB | 85.6 MB |
| Events in quadrant A | 2,295,109 | 609,079 |
| Events in quadrant B | 2,505,756 | 617,997 |
| Events in quadrant C | 2,426,745 | 592,077 |
| Events in quadrant D | 3,817,244 | 549,950 |
| Mode M0 | |||
|---|---|---|---|
| Quadrant | BADHDUFLAG | Total packets | Discarded packets |
| A | 0 | 10119 | 0 |
| B | 0 | 10697 | 0 |
| C | 0 | 10454 | 0 |
| D | 0 | 14622 | 0 |
| Quadrant | Total seconds | Saturated seconds | Saturation percentage |
|---|---|---|---|
| A | 4987 | 16 | 0.320834% |
| B | 4987 | 58 | 1.163024% |
| C | 4988 | 33 | 0.661588% |
| D | 4988 | 387 | 7.758621% |
Noise dominated data is calculated using 1-second bins in cleaned event files. If a bin has >2000 counts, and if more than 50% of those come from <1% of pixels, then it is considered to be noise-dominated and hence unusable.
| Quadrant | # 1 sec bins | Bins with >0 counts | Bins with >2000 counts | High rate bins dominated by noise | Noise dominated (total time) | Noise dominated (detector-on time) | Marked lightcurve |
|---|---|---|---|---|---|---|---|
| A | 4987 | 4987 | 14 | 14 | 0.28% | 0.28% | 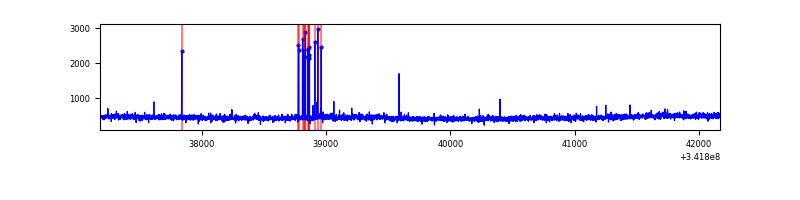 |
| B | 4987 | 4987 | 45 | 45 | 0.90% | 0.90% | 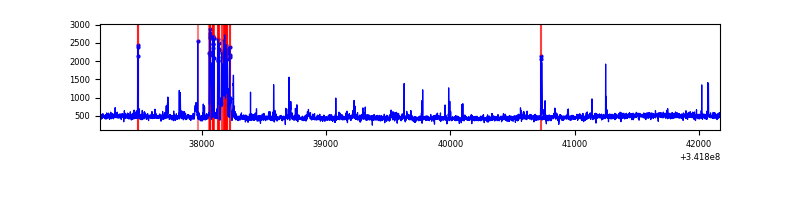 |
| C | 4988 | 4988 | 4 | 4 | 0.08% | 0.08% | 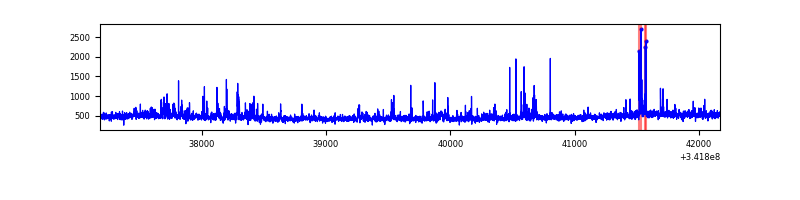 |
| D | 4988 | 4988 | 317 | 317 | 6.36% | 6.36% | 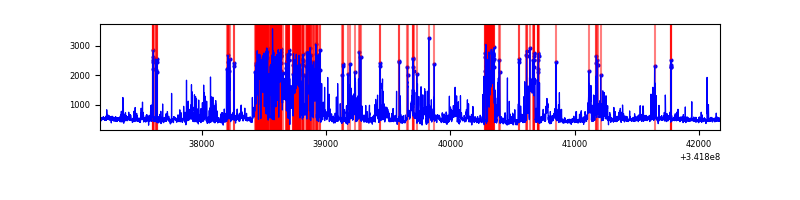 |
Top three noisy pixels from each quadrant. If the there are fewer than three noisy pixels in the level2.evt file, extra rows are filled as -1
| Pixel properties | Quadrant properties | ||||||
|---|---|---|---|---|---|---|---|
| Quadrant | DetID | PixID | Counts | Sigma | Mean | Median | Sigma |
| A | 0 | 13 | 52075 | 442.92 | 569 | 557 | 116.3 |
| A | 6 | 16 | 45867 | 389.55 | 569 | 557 | 116.3 |
| A | 13 | 254 | 8854 | 71.33 | 569 | 557 | 116.3 |
| B | 10 | 245 | 228087 | 2090.58 | 568 | 553 | 108.8 |
| B | 0 | 230 | 21465 | 192.14 | 568 | 553 | 108.8 |
| B | 12 | 111 | 13205 | 116.25 | 568 | 553 | 108.8 |
| C | 7 | 221 | 179972 | 1390.76 | 547 | 550 | 129.0 |
| C | 14 | 238 | 89673 | 690.82 | 547 | 550 | 129.0 |
| C | 2 | 16 | 23283 | 176.21 | 547 | 550 | 129.0 |
| D | 1 | 52 | 1395536 | 11004.77 | 526 | 511 | 126.8 |
| D | 7 | 80 | 233991 | 1841.83 | 526 | 511 | 126.8 |
| D | 2 | 250 | 74760 | 585.72 | 526 | 511 | 126.8 |
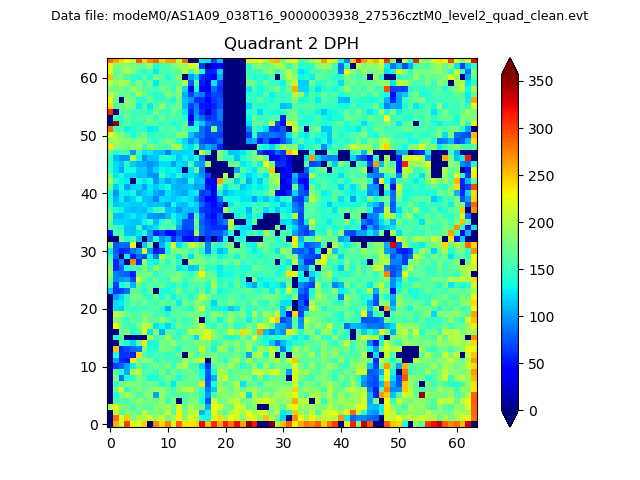
Histogram calculated using DETX and DETY for each event in the final _common_clean file
| Quadrant A | 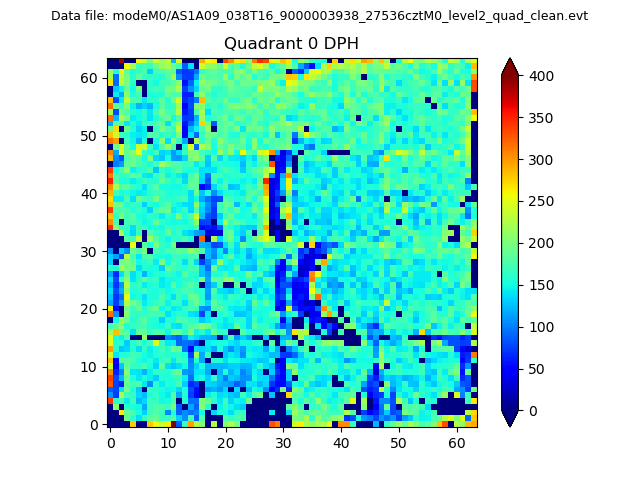 |
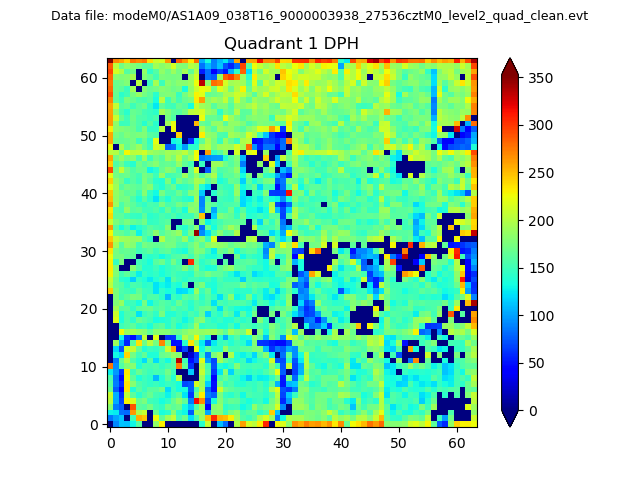 |
Quadrant B |
|---|---|---|---|
| Quadrant D | 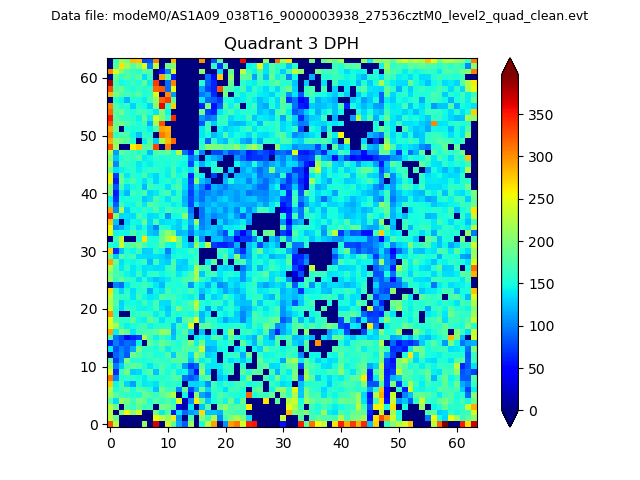 |
 |
Quadrant C |
| Plot type | Count rate plots | Images |
|---|---|---|
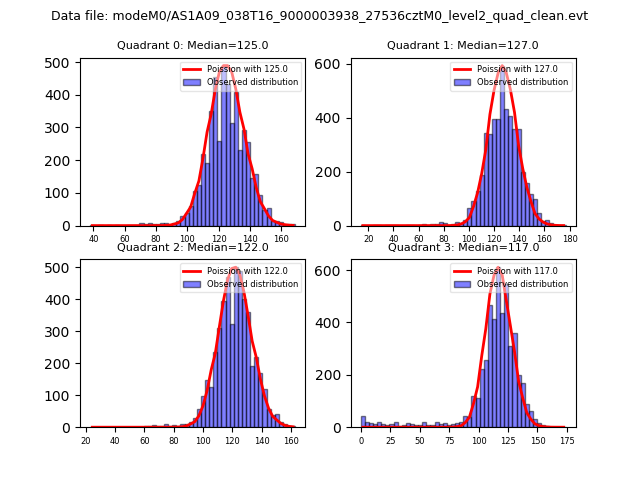
| Comparison with Poisson distribution Blue bars denote a histogram of data divided into 1 sec bins. Red curve is a Poisson curve with rate = median count rate of data. |
 |
 |
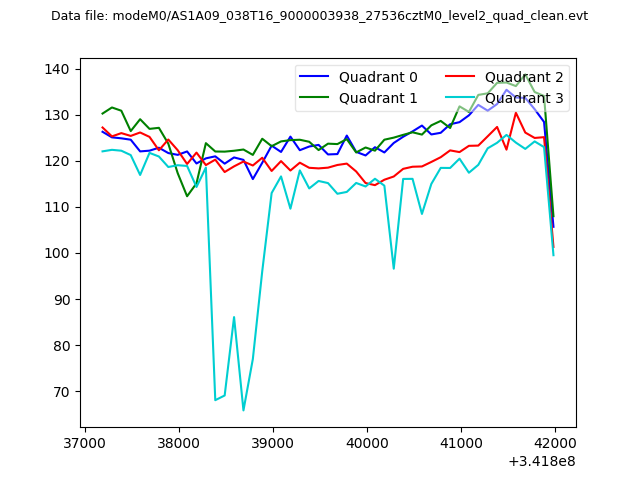
| Quadrant-wise count rates Data is divided into 100 sec bins |
 |
|
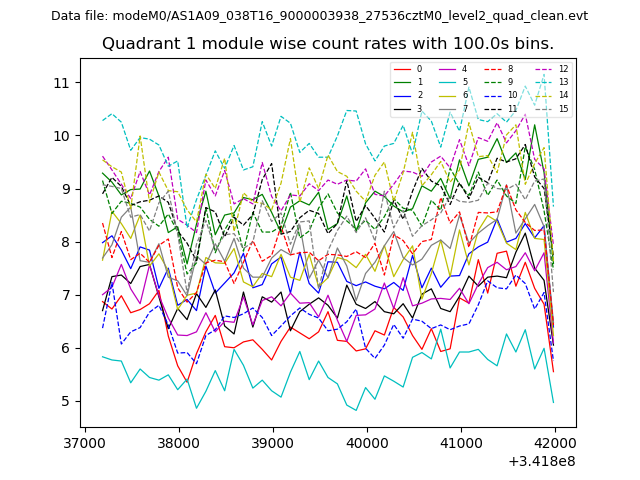
| Module-wise count rates for Quadrant A Data is divided into 100 sec bins |
 |
 |
| Module-wise count rates for Quadrant B Data is divided into 100 sec bins |
 |
 |
| Module-wise count rates for Quadrant C Data is divided into 100 sec bins |
 |
 |
| Module-wise count rates for Quadrant D Data is divided into 100 sec bins |
 |
 |
| Parameter | Plot |
|---|---|
| CZT HV Monitor | 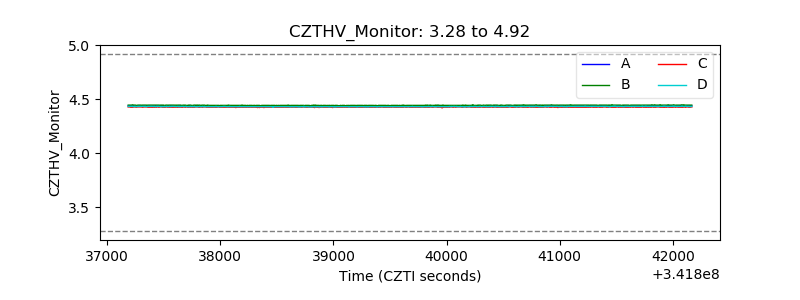 |
| D_VDD | 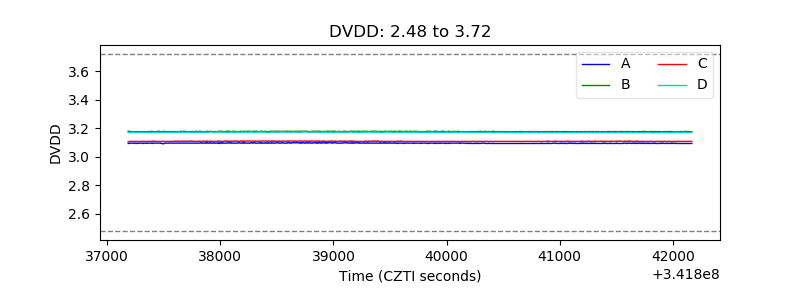 |
| Temperature 1 |  |
| Veto HV Monitor | 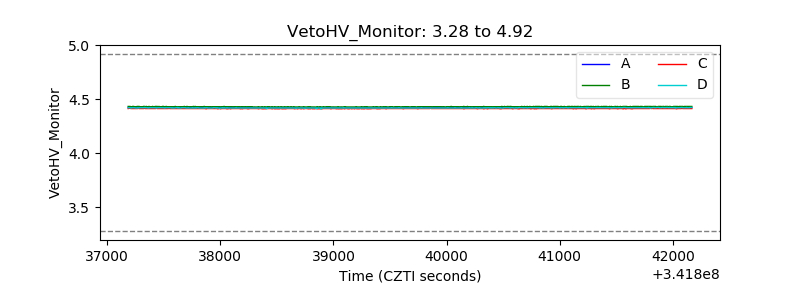 |
| Veto LLD | 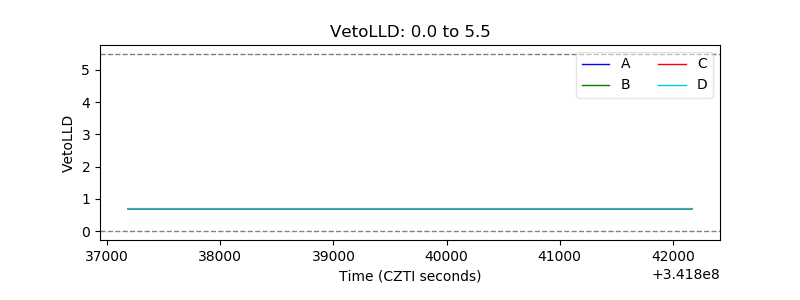 |
| Alpha Counter | 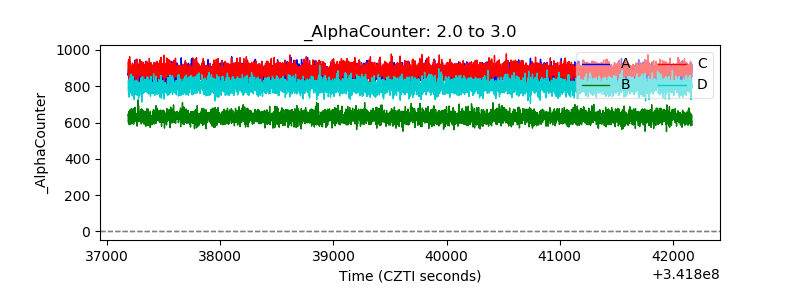 |
| _CPM_Rate | 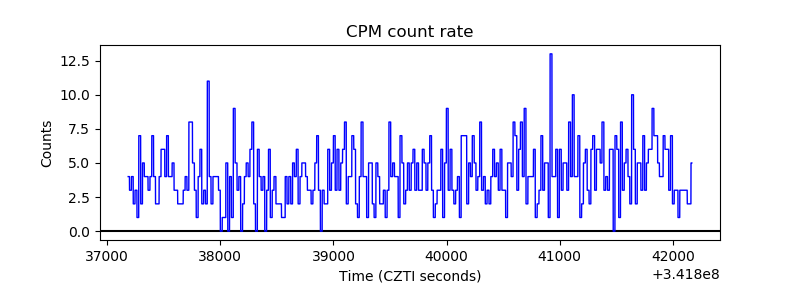 |
| CZT Counter | 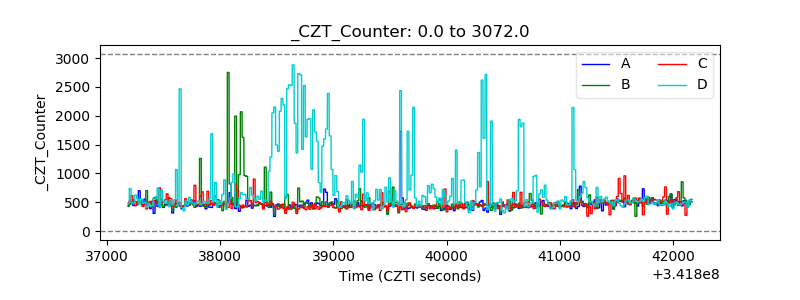 |
| +2.5 Volts monitor |  |
| +5 Volts monitor |  |
| _ROLL_ROT | 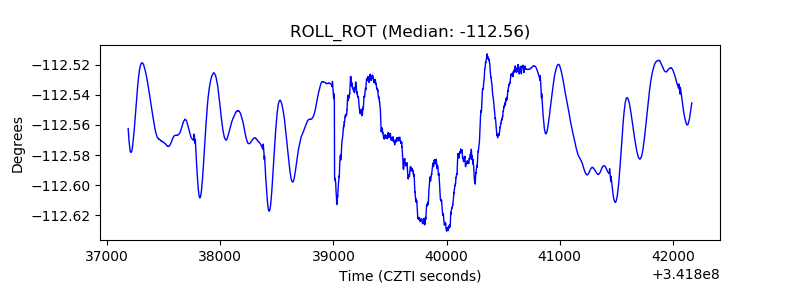 |
| _Roll_DEC |  |
| _Roll_RA | 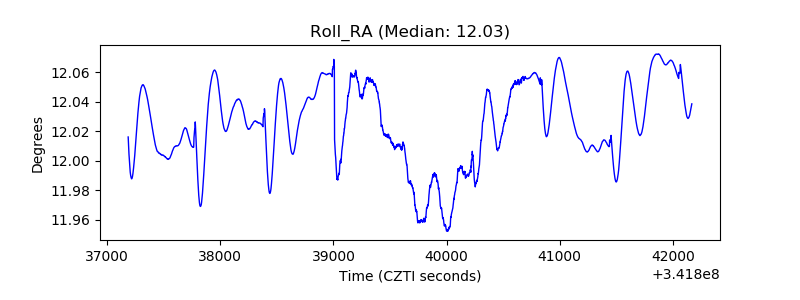 |
| Veto Counter |  |