| Param | Original file | Final file |
|---|---|---|
| Filename | modeM0/AS1A09_038T20_9000003940cztM0_level2.fits | modeM0/AS1A09_038T20_9000003940cztM0_level2_quad_clean.evt |
| Size (bytes) | 55,598,400 | 64,252,800 |
| Size | 53.0 MB | 61.3 MB |
| Events in quadrant A | 336,388 | 404,200 |
| Events in quadrant B | 323,710 | 404,722 |
| Events in quadrant C | 327,040 | 382,879 |
| Events in quadrant D | 281,460 | 338,405 |
| Mode M0 | |||
|---|---|---|---|
| Quadrant | BADHDUFLAG | Total packets | Discarded packets |
| A | 0 | 12310 | 0 |
| B | 0 | 12552 | 0 |
| C | 0 | 12903 | 0 |
| D | 0 | 15907 | 0 |
| Mode SS | |||
|---|---|---|---|
| Quadrant | BADHDUFLAG | Total packets | Discarded packets |
| A | 0 | 118 | 0 |
| B | 0 | 118 | 0 |
| C | 0 | 118 | 0 |
| D | 0 | 118 | 0 |
| Quadrant | Total seconds | Saturated seconds | Saturation percentage |
|---|---|---|---|
| A | 5942 | 148 | 2.490744% |
| B | 5942 | 182 | 3.062942% |
| C | 5942 | 232 | 3.904409% |
| D | 5942 | 461 | 7.758331% |
Noise dominated data is calculated using 1-second bins in cleaned event files. If a bin has >2000 counts, and if more than 50% of those come from <1% of pixels, then it is considered to be noise-dominated and hence unusable.
| Quadrant | # 1 sec bins | Bins with >0 counts | Bins with >2000 counts | High rate bins dominated by noise | Noise dominated (total time) | Noise dominated (detector-on time) | Marked lightcurve |
|---|---|---|---|---|---|---|---|
| A | 5962 | 5942 | 0 | 0 | 0.00% | 0.00% |  |
| B | 5962 | 5941 | 0 | 0 | 0.00% | 0.00% |  |
| C | 5962 | 5942 | 0 | 0 | 0.00% | 0.00% |  |
| D | 5962 | 5932 | 0 | 0 | 0.00% | 0.00% |  |
Top three noisy pixels from each quadrant. If the there are fewer than three noisy pixels in the level2.evt file, extra rows are filled as -1
| Pixel properties | Quadrant properties | ||||||
|---|---|---|---|---|---|---|---|
| Quadrant | DetID | PixID | Counts | Sigma | Mean | Median | Sigma |
| A | 7 | 110 | 284 | 8.44 | 87 | 83 | 23.8 |
| A | 0 | 29 | 266 | 7.68 | 87 | 83 | 23.8 |
| A | 9 | 19 | 259 | 7.39 | 87 | 83 | 23.8 |
| B | 2 | 9 | 281 | 10.49 | 85 | 81 | 19.0 |
| B | 2 | 8 | 237 | 8.18 | 85 | 81 | 19.0 |
| B | 14 | 254 | 236 | 8.12 | 85 | 81 | 19.0 |
| C | 12 | 249 | 248 | 7.19 | 86 | 81 | 23.2 |
| C | 12 | 250 | 247 | 7.15 | 86 | 81 | 23.2 |
| C | 3 | 126 | 238 | 6.76 | 86 | 81 | 23.2 |
| D | 3 | 159 | 209 | 5.8 | 80 | 73 | 23.5 |
| D | 15 | 46 | 203 | 5.54 | 80 | 73 | 23.5 |
| D | 4 | 160 | 200 | 5.41 | 80 | 73 | 23.5 |
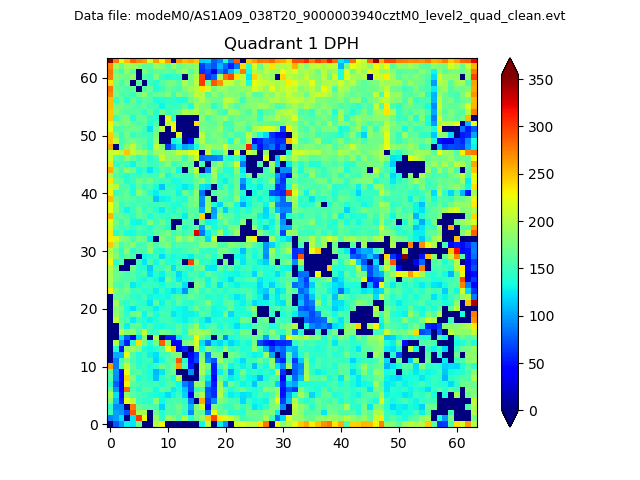
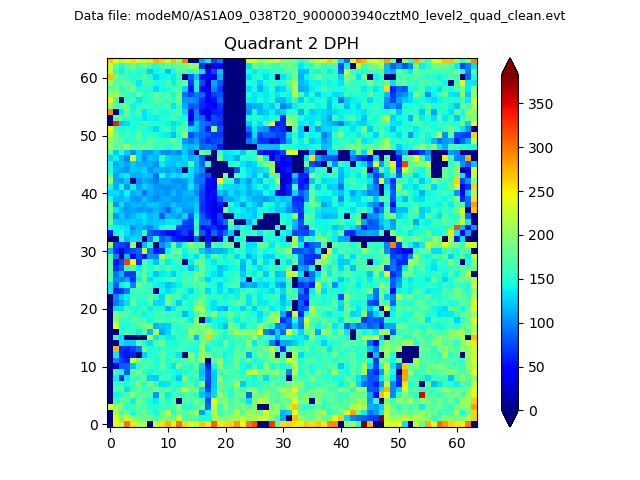
Histogram calculated using DETX and DETY for each event in the final _common_clean file
| Quadrant A |  |
 |
Quadrant B |
|---|---|---|---|
| Quadrant D | 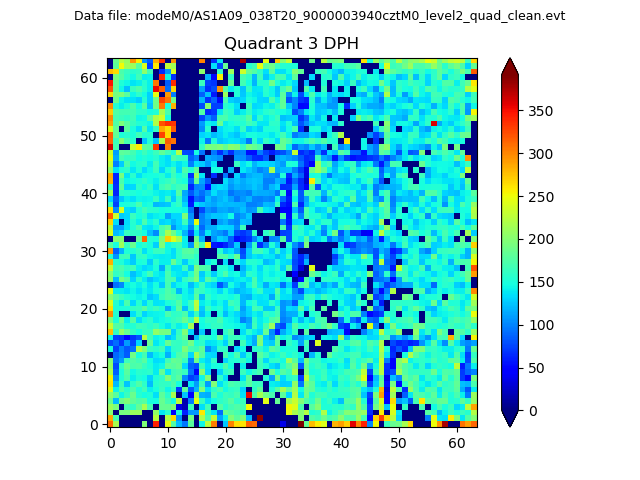 |
 |
Quadrant C |
| Plot type | Count rate plots | Images |
|---|---|---|
| Comparison with Poisson distribution Blue bars denote a histogram of data divided into 1 sec bins. Red curve is a Poisson curve with rate = median count rate of data. |
 |
 |
| Quadrant-wise count rates Data is divided into 100 sec bins |
 |
|
| Module-wise count rates for Quadrant A Data is divided into 100 sec bins |
 |
 |
| Module-wise count rates for Quadrant B Data is divided into 100 sec bins |
 |
 |
| Module-wise count rates for Quadrant C Data is divided into 100 sec bins |
 |
 |
| Module-wise count rates for Quadrant D Data is divided into 100 sec bins |
 |
 |
| Parameter | Plot |
|---|---|
| CZT HV Monitor |  |
| D_VDD |  |
| Temperature 1 | 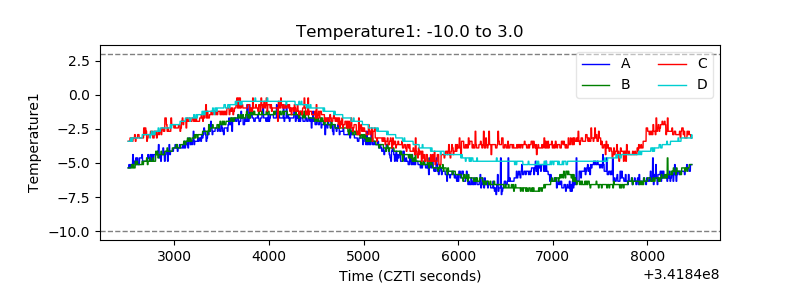 |
| Veto HV Monitor |  |
| Veto LLD |  |
| Alpha Counter |  |
| _CPM_Rate |  |
| CZT Counter |  |
| +2.5 Volts monitor |  |
| +5 Volts monitor |  |
| _ROLL_ROT |  |
| _Roll_DEC |  |
| _Roll_RA |  |
| Veto Counter |  |