| Param | Original file | Final file |
|---|---|---|
| Filename | modeM0/AS1A09_038T20_9000003940_27539cztM0_level2.evt | modeM0/AS1A09_038T20_9000003940_27539cztM0_level2_quad_clean.evt |
| Size (bytes) | 437,656,320 | 89,642,880 |
| Size | 417.4 MB | 85.5 MB |
| Events in quadrant A | 2,872,563 | 588,296 |
| Events in quadrant B | 2,936,155 | 596,846 |
| Events in quadrant C | 3,005,293 | 571,186 |
| Events in quadrant D | 4,036,411 | 543,411 |
| Mode M0 | |||
|---|---|---|---|
| Quadrant | BADHDUFLAG | Total packets | Discarded packets |
| A | 0 | 12310 | 0 |
| B | 0 | 12552 | 0 |
| C | 0 | 12903 | 0 |
| D | 0 | 15907 | 0 |
| Quadrant | Total seconds | Saturated seconds | Saturation percentage |
|---|---|---|---|
| A | 5942 | 148 | 2.490744% |
| B | 5942 | 182 | 3.062942% |
| C | 5942 | 232 | 3.904409% |
| D | 5942 | 461 | 7.758331% |
Noise dominated data is calculated using 1-second bins in cleaned event files. If a bin has >2000 counts, and if more than 50% of those come from <1% of pixels, then it is considered to be noise-dominated and hence unusable.
| Quadrant | # 1 sec bins | Bins with >0 counts | Bins with >2000 counts | High rate bins dominated by noise | Noise dominated (total time) | Noise dominated (detector-on time) | Marked lightcurve |
|---|---|---|---|---|---|---|---|
| A | 5962 | 5943 | 3 | 3 | 0.05% | 0.05% | 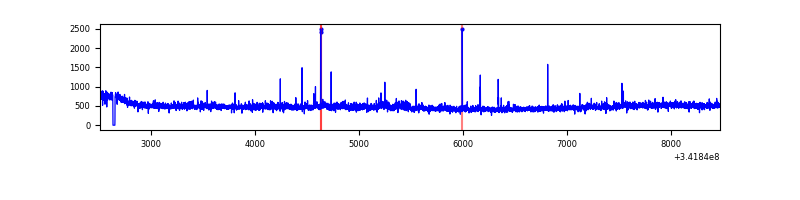 |
| B | 5962 | 5942 | 11 | 11 | 0.18% | 0.19% | 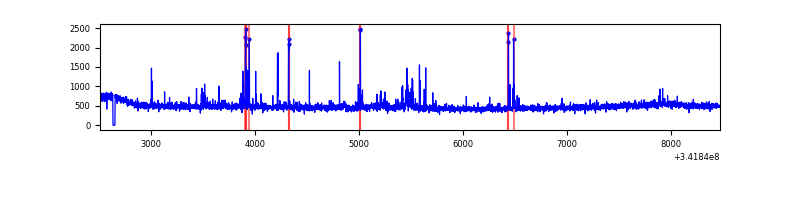 |
| C | 5962 | 5943 | 14 | 14 | 0.23% | 0.24% | 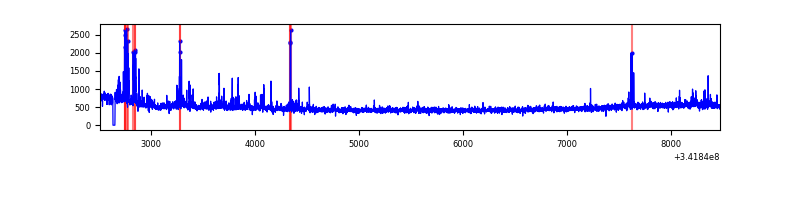 |
| D | 5962 | 5943 | 279 | 279 | 4.68% | 4.69% | 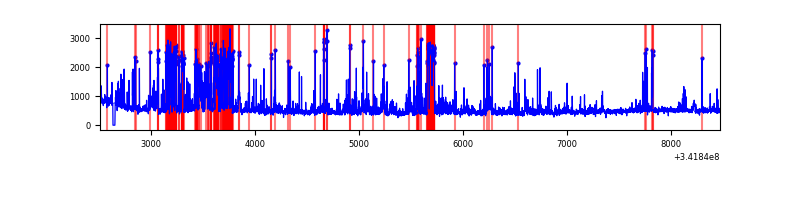 |
Top three noisy pixels from each quadrant. If the there are fewer than three noisy pixels in the level2.evt file, extra rows are filled as -1
| Pixel properties | Quadrant properties | ||||||
|---|---|---|---|---|---|---|---|
| Quadrant | DetID | PixID | Counts | Sigma | Mean | Median | Sigma |
| A | 0 | 13 | 112779 | 780.93 | 707 | 691 | 143.5 |
| A | 14 | 235 | 17681 | 118.37 | 707 | 691 | 143.5 |
| A | 6 | 16 | 11809 | 77.46 | 707 | 691 | 143.5 |
| B | 10 | 245 | 62677 | 456.57 | 704 | 685 | 135.8 |
| B | 0 | 244 | 38968 | 281.95 | 704 | 685 | 135.8 |
| B | 0 | 230 | 23356 | 166.97 | 704 | 685 | 135.8 |
| C | 7 | 221 | 241102 | 1502.63 | 679 | 679 | 160.0 |
| C | 14 | 238 | 111401 | 692.0 | 679 | 679 | 160.0 |
| C | 2 | 16 | 5029 | 27.19 | 679 | 679 | 160.0 |
| D | 1 | 52 | 1324143 | 8203.77 | 670 | 649 | 161.3 |
| D | 2 | 250 | 56675 | 347.28 | 670 | 649 | 161.3 |
| D | 7 | 80 | 55592 | 340.57 | 670 | 649 | 161.3 |
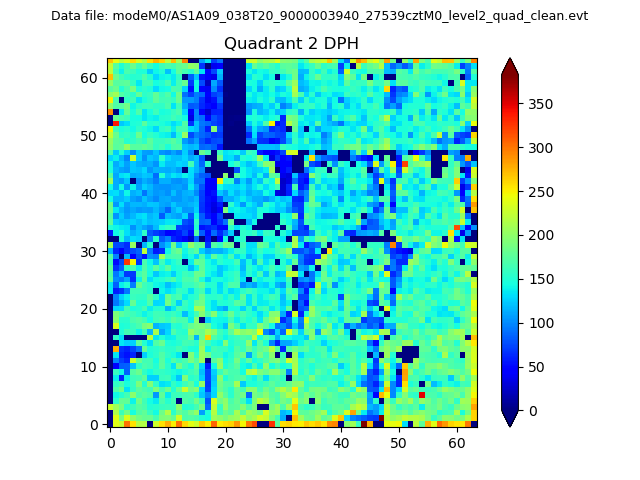
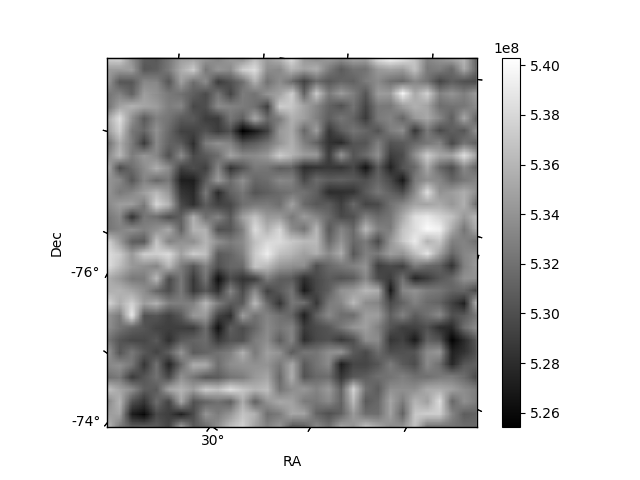
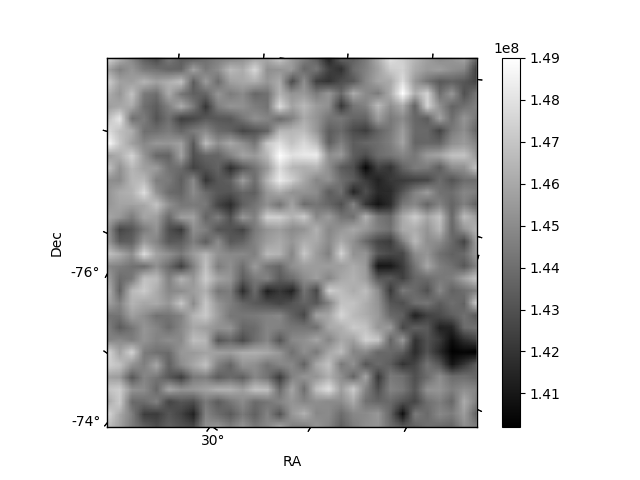
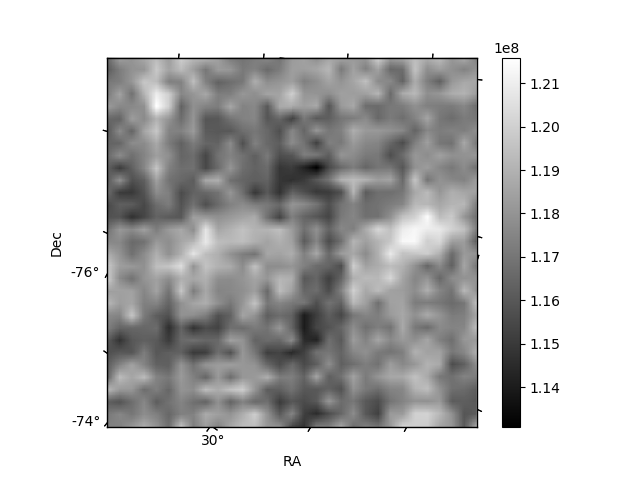
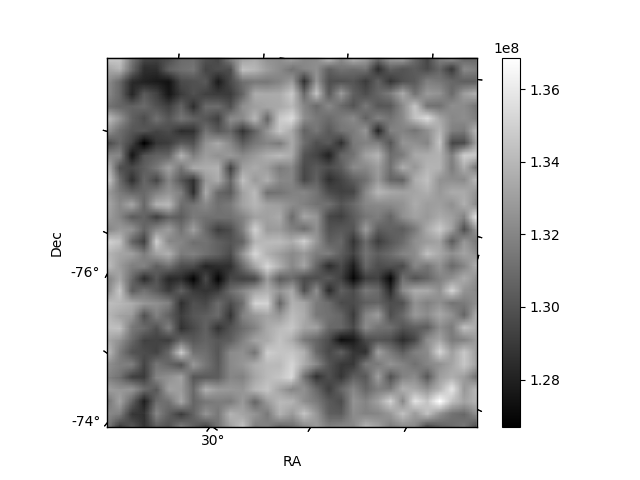
Histogram calculated using DETX and DETY for each event in the final _common_clean file
| Quadrant A | 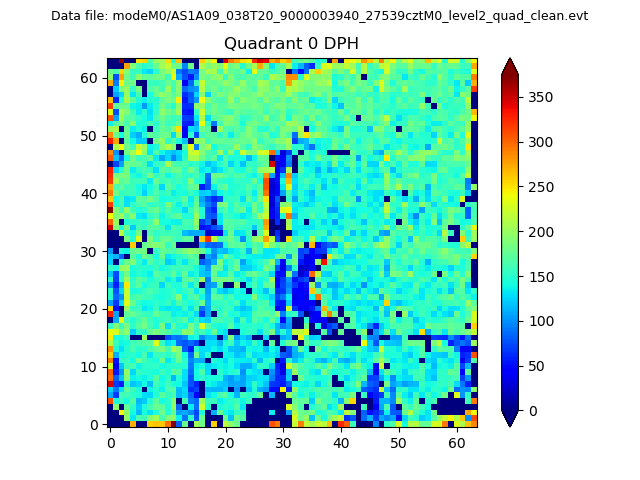 |
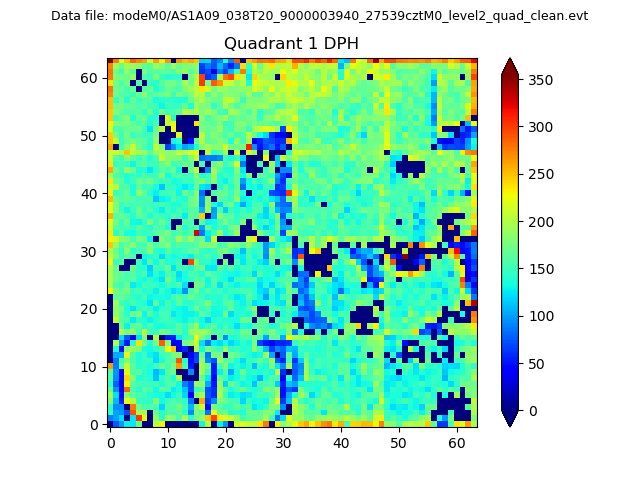 |
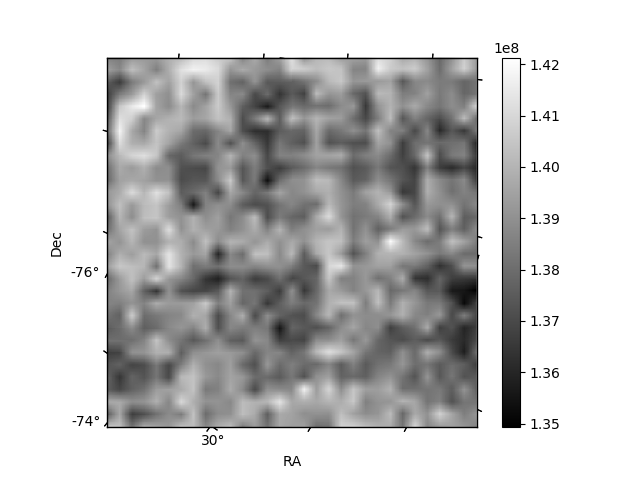
Quadrant B |
|---|---|---|---|
| Quadrant D | 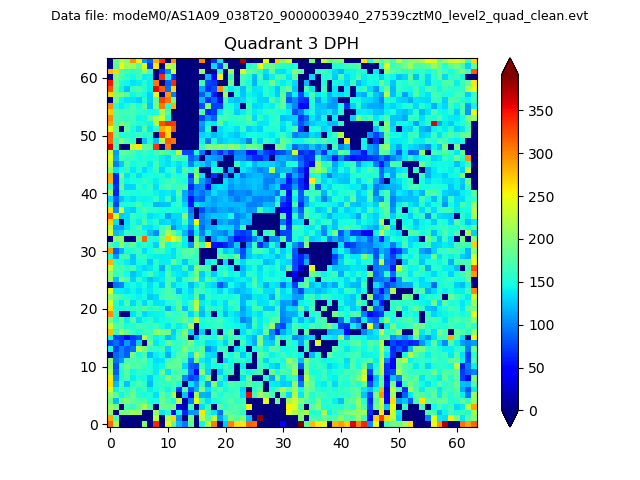 |
 |
Quadrant C |
| Plot type | Count rate plots | Images |
|---|---|---|
| Comparison with Poisson distribution Blue bars denote a histogram of data divided into 1 sec bins. Red curve is a Poisson curve with rate = median count rate of data. |
 |
 |
| Quadrant-wise count rates Data is divided into 100 sec bins |
 |
|
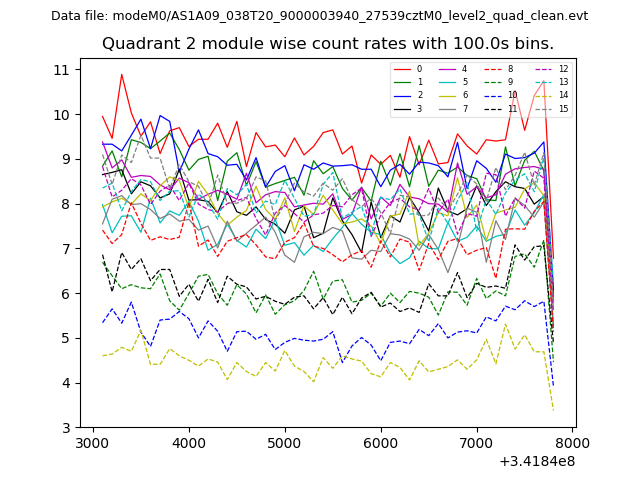
| Module-wise count rates for Quadrant A Data is divided into 100 sec bins |
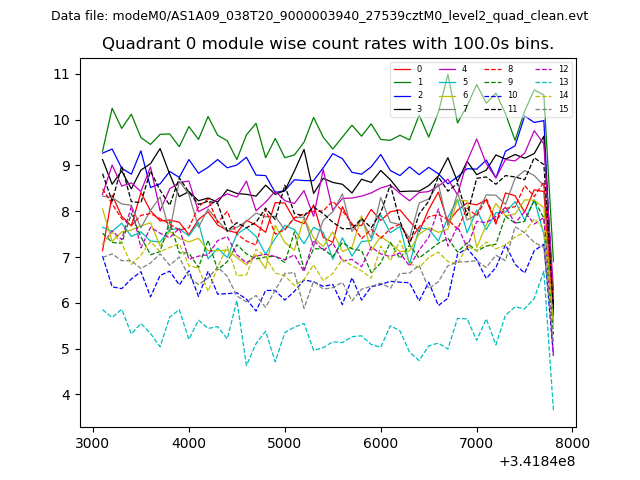 |
 |
| Module-wise count rates for Quadrant B Data is divided into 100 sec bins |
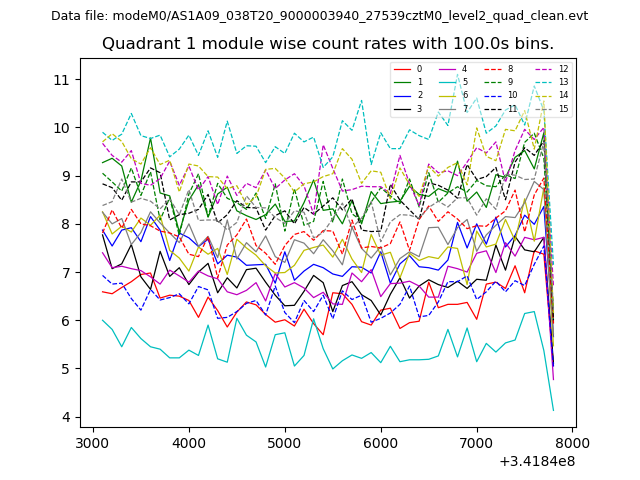 |
 |
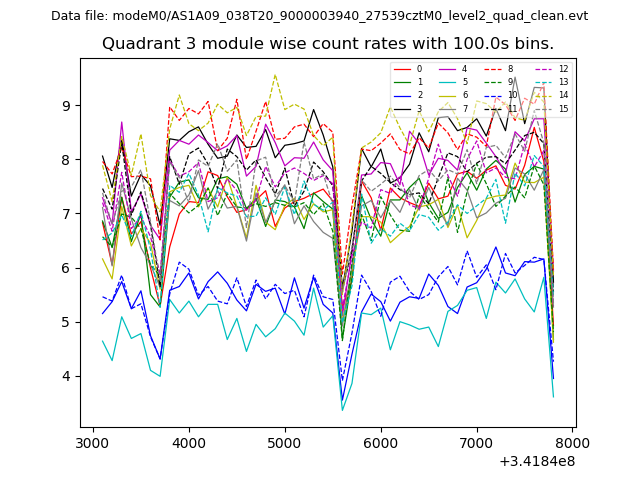
| Module-wise count rates for Quadrant C Data is divided into 100 sec bins |
 |
 |
| Module-wise count rates for Quadrant D Data is divided into 100 sec bins |
 |
 |
| Parameter | Plot |
|---|---|
| CZT HV Monitor | 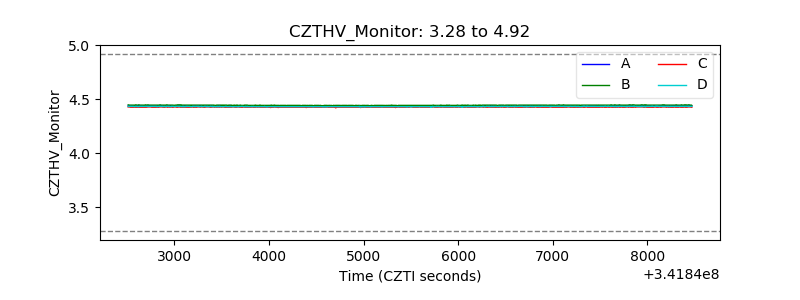 |
| D_VDD | 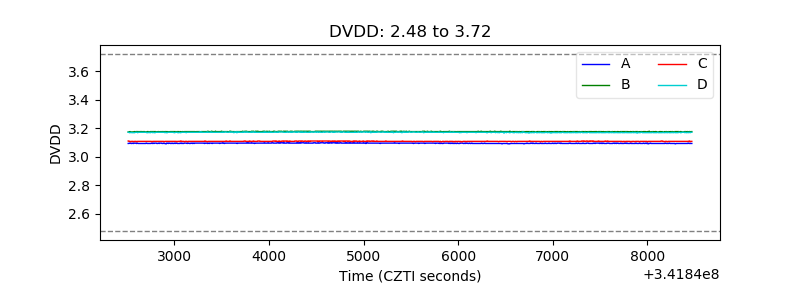 |
| Temperature 1 | 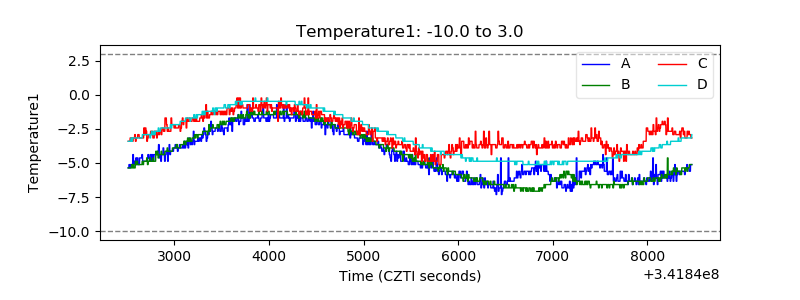 |
| Veto HV Monitor | 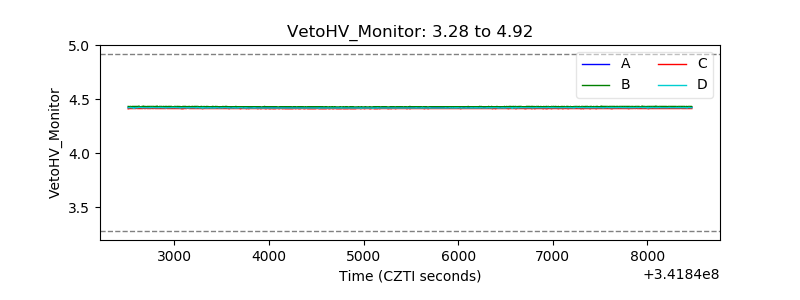 |
| Veto LLD | 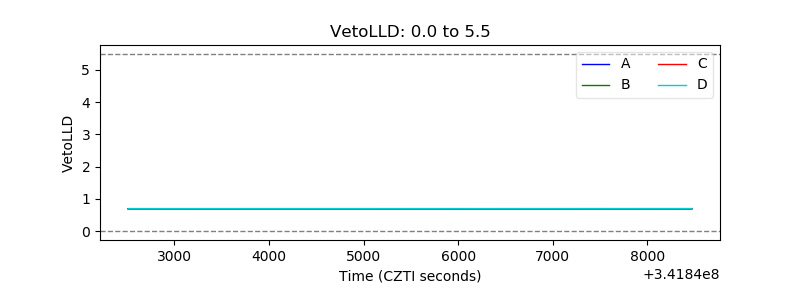 |
| Alpha Counter | 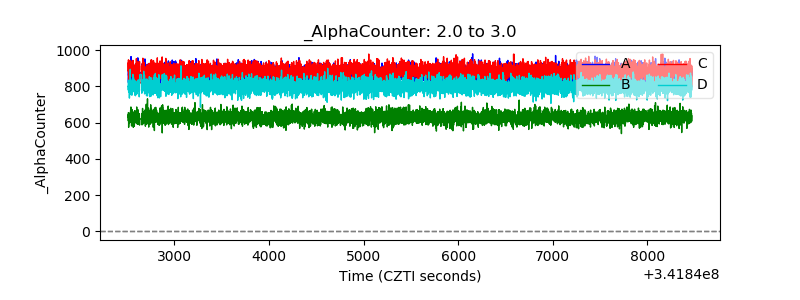 |
| _CPM_Rate | 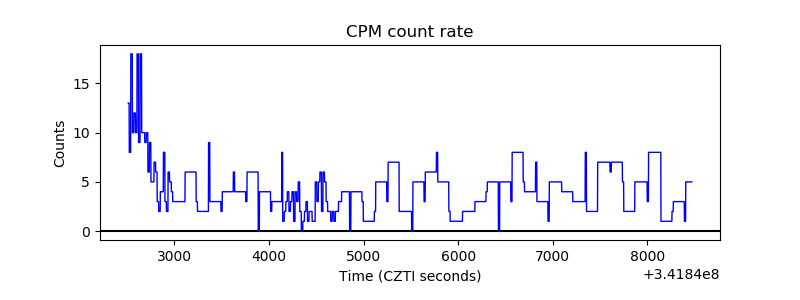 |
| CZT Counter | 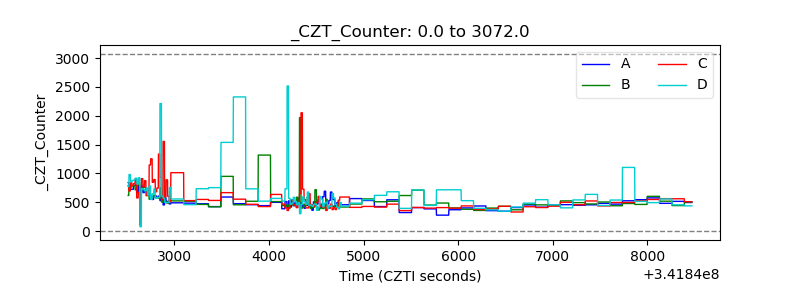 |
| +2.5 Volts monitor |  |
| +5 Volts monitor |  |
| _ROLL_ROT | 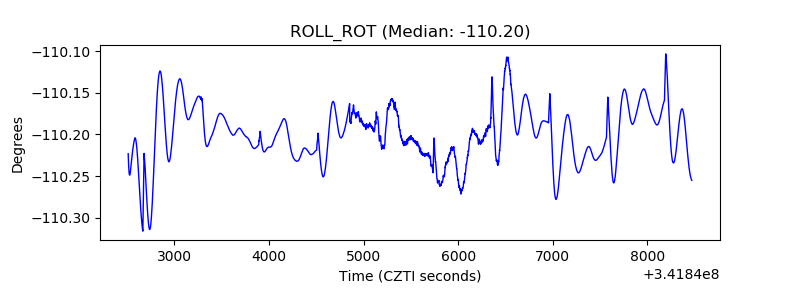 |
| _Roll_DEC | 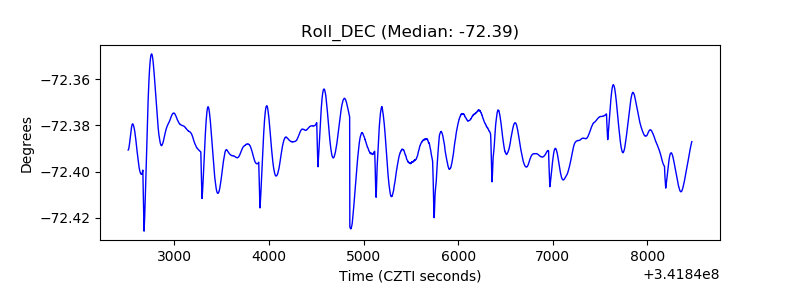 |
| _Roll_RA | 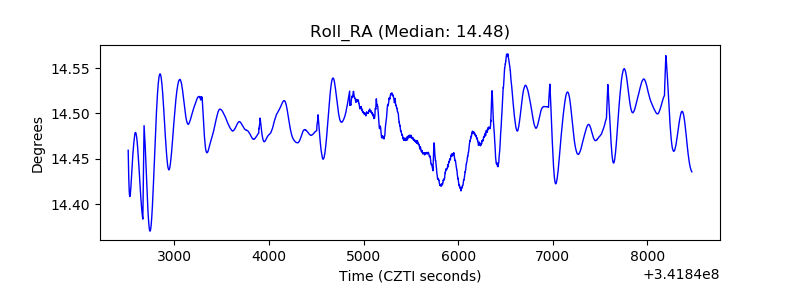 |
| Veto Counter | 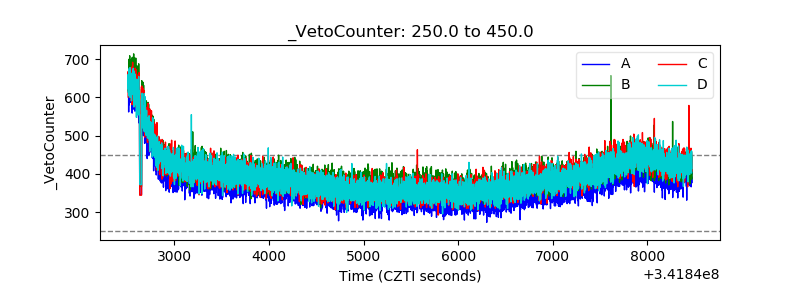 |