| Param | Original file | Final file |
|---|---|---|
| Filename | modeM0/AS1A09_038T22_9000003942cztM0_level2.fits | modeM0/AS1A09_038T22_9000003942cztM0_level2_quad_clean.evt |
| Size (bytes) | 43,179,840 | 52,536,960 |
| Size | 41.2 MB | 50.1 MB |
| Events in quadrant A | 258,128 | 335,075 |
| Events in quadrant B | 249,826 | 333,614 |
| Events in quadrant C | 251,914 | 311,824 |
| Events in quadrant D | 215,652 | 277,608 |
| Mode SS | |||
|---|---|---|---|
| Quadrant | BADHDUFLAG | Total packets | Discarded packets |
| A | 0 | 94 | 0 |
| B | 0 | 94 | 0 |
| C | 0 | 94 | 0 |
| D | 0 | 94 | 0 |
| Mode M9 | |||
|---|---|---|---|
| Quadrant | BADHDUFLAG | Total packets | Discarded packets |
| A | 0 | 2 | 0 |
| B | 0 | 2 | 0 |
| C | 0 | 2 | 0 |
| D | 0 | 2 | 0 |
| Mode M0 | |||
|---|---|---|---|
| Quadrant | BADHDUFLAG | Total packets | Discarded packets |
| A | 0 | 9729 | 0 |
| B | 0 | 10088 | 0 |
| C | 0 | 10836 | 0 |
| D | 0 | 12084 | 0 |
| Quadrant | Total seconds | Saturated seconds | Saturation percentage |
|---|---|---|---|
| A | 4733 | 18 | 0.380308% |
| B | 4733 | 26 | 0.549334% |
| C | 4733 | 55 | 1.162054% |
| D | 4733 | 218 | 4.605958% |
Noise dominated data is calculated using 1-second bins in cleaned event files. If a bin has >2000 counts, and if more than 50% of those come from <1% of pixels, then it is considered to be noise-dominated and hence unusable.
| Quadrant | # 1 sec bins | Bins with >0 counts | Bins with >2000 counts | High rate bins dominated by noise | Noise dominated (total time) | Noise dominated (detector-on time) | Marked lightcurve |
|---|---|---|---|---|---|---|---|
| A | 4732 | 4732 | 0 | 0 | 0.00% | 0.00% |  |
| B | 4731 | 4731 | 0 | 0 | 0.00% | 0.00% |  |
| C | 4732 | 4732 | 0 | 0 | 0.00% | 0.00% | 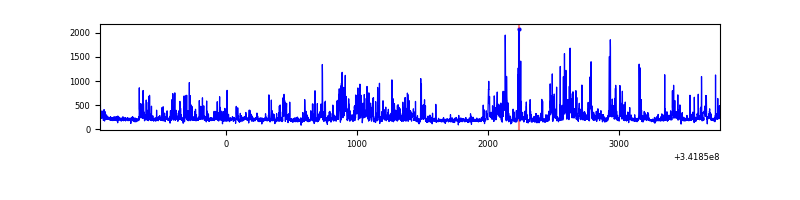 |
| D | 4732 | 4701 | 0 | 0 | 0.00% | 0.00% |  |
Top three noisy pixels from each quadrant. If the there are fewer than three noisy pixels in the level2.evt file, extra rows are filled as -1
| Pixel properties | Quadrant properties | ||||||
|---|---|---|---|---|---|---|---|
| Quadrant | DetID | PixID | Counts | Sigma | Mean | Median | Sigma |
| A | 12 | 254 | 197 | 7.08 | 67 | 63 | 18.9 |
| A | 9 | 19 | 193 | 6.87 | 67 | 63 | 18.9 |
| A | 0 | 29 | 192 | 6.82 | 67 | 63 | 18.9 |
| B | 2 | 9 | 183 | 7.8 | 66 | 63 | 15.4 |
| B | 3 | 17 | 180 | 7.61 | 66 | 63 | 15.4 |
| B | 5 | 232 | 179 | 7.54 | 66 | 63 | 15.4 |
| C | 3 | 202 | 194 | 6.95 | 66 | 62 | 19.0 |
| C | 1 | 80 | 193 | 6.89 | 66 | 62 | 19.0 |
| C | 2 | 191 | 188 | 6.63 | 66 | 62 | 19.0 |
| D | 3 | 14 | 177 | 6.82 | 61 | 55 | 17.9 |
| D | 15 | 46 | 169 | 6.37 | 61 | 55 | 17.9 |
| D | 3 | 159 | 163 | 6.04 | 61 | 55 | 17.9 |
Histogram calculated using DETX and DETY for each event in the final _common_clean file
| Quadrant A |  |
 |
Quadrant B |
|---|---|---|---|
| Quadrant D |  |
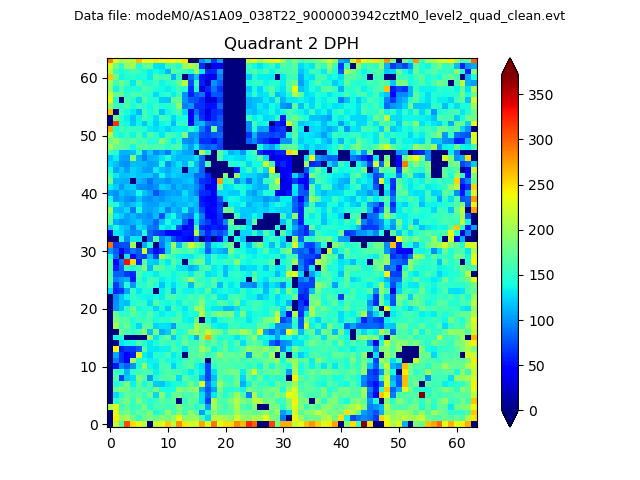 |
Quadrant C |
| Plot type | Count rate plots | Images |
|---|---|---|
| Comparison with Poisson distribution Blue bars denote a histogram of data divided into 1 sec bins. Red curve is a Poisson curve with rate = median count rate of data. |
 |
 |
| Quadrant-wise count rates Data is divided into 100 sec bins |
 |
|
| Module-wise count rates for Quadrant A Data is divided into 100 sec bins |
 |
 |
| Module-wise count rates for Quadrant B Data is divided into 100 sec bins |
 |
 |
| Module-wise count rates for Quadrant C Data is divided into 100 sec bins |
 |
 |
| Module-wise count rates for Quadrant D Data is divided into 100 sec bins |
 |
 |
| Parameter | Plot |
|---|---|
| CZT HV Monitor |  |
| D_VDD |  |
| Temperature 1 |  |
| Veto HV Monitor |  |
| Veto LLD |  |
| Alpha Counter |  |
| _CPM_Rate |  |
| CZT Counter |  |
| +2.5 Volts monitor |  |
| +5 Volts monitor |  |
| _ROLL_ROT |  |
| _Roll_DEC |  |
| _Roll_RA |  |
| Veto Counter |  |