| Param | Original file | Final file |
|---|---|---|
| Filename | modeM0/AS1A09_038T22_9000003942_27539cztM0_level2.evt | modeM0/AS1A09_038T22_9000003942_27539cztM0_level2_quad_clean.evt |
| Size (bytes) | 342,694,080 | 84,873,600 |
| Size | 326.8 MB | 80.9 MB |
| Events in quadrant A | 2,188,041 | 573,310 |
| Events in quadrant B | 2,337,648 | 580,752 |
| Events in quadrant C | 2,597,317 | 552,251 |
| Events in quadrant D | 2,933,102 | 531,733 |
| Mode M9 | |||
|---|---|---|---|
| Quadrant | BADHDUFLAG | Total packets | Discarded packets |
| A | 0 | 2 | 0 |
| B | 0 | 2 | 0 |
| C | 0 | 2 | 0 |
| D | 0 | 2 | 0 |
| Mode M0 | |||
|---|---|---|---|
| Quadrant | BADHDUFLAG | Total packets | Discarded packets |
| A | 0 | 9729 | 0 |
| B | 0 | 10088 | 0 |
| C | 0 | 10836 | 0 |
| D | 0 | 12084 | 0 |
| Quadrant | Total seconds | Saturated seconds | Saturation percentage |
|---|---|---|---|
| A | 4733 | 18 | 0.380308% |
| B | 4733 | 26 | 0.549334% |
| C | 4733 | 55 | 1.162054% |
| D | 4733 | 218 | 4.605958% |
Noise dominated data is calculated using 1-second bins in cleaned event files. If a bin has >2000 counts, and if more than 50% of those come from <1% of pixels, then it is considered to be noise-dominated and hence unusable.
| Quadrant | # 1 sec bins | Bins with >0 counts | Bins with >2000 counts | High rate bins dominated by noise | Noise dominated (total time) | Noise dominated (detector-on time) | Marked lightcurve |
|---|---|---|---|---|---|---|---|
| A | 4733 | 4733 | 5 | 5 | 0.11% | 0.11% | 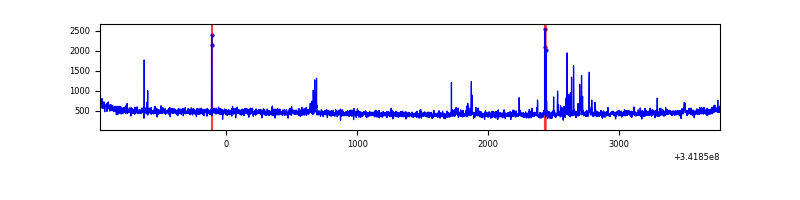 |
| B | 4733 | 4733 | 11 | 11 | 0.23% | 0.23% | 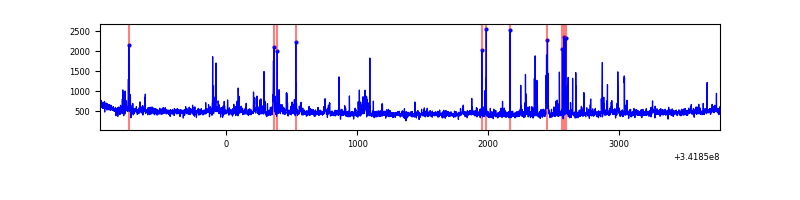 |
| C | 4733 | 4733 | 9 | 9 | 0.19% | 0.19% | 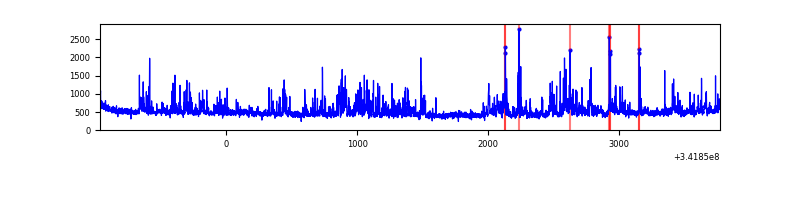 |
| D | 4733 | 4733 | 199 | 199 | 4.20% | 4.20% | 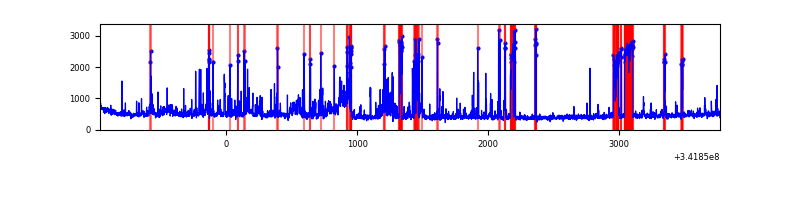 |
Top three noisy pixels from each quadrant. If the there are fewer than three noisy pixels in the level2.evt file, extra rows are filled as -1
| Pixel properties | Quadrant properties | ||||||
|---|---|---|---|---|---|---|---|
| Quadrant | DetID | PixID | Counts | Sigma | Mean | Median | Sigma |
| A | 14 | 235 | 56141 | 511.39 | 536 | 525 | 108.8 |
| A | 4 | 2 | 29867 | 269.8 | 536 | 525 | 108.8 |
| A | 0 | 13 | 18567 | 165.89 | 536 | 525 | 108.8 |
| B | 10 | 245 | 132645 | 1280.86 | 535 | 522 | 103.2 |
| B | 15 | 32 | 54916 | 527.32 | 535 | 522 | 103.2 |
| B | 0 | 230 | 22791 | 215.89 | 535 | 522 | 103.2 |
| C | 7 | 221 | 503703 | 4172.31 | 513 | 517 | 120.6 |
| C | 14 | 238 | 84345 | 695.08 | 513 | 517 | 120.6 |
| C | 2 | 16 | 8746 | 68.23 | 513 | 517 | 120.6 |
| D | 7 | 80 | 517818 | 4255.15 | 504 | 489 | 121.6 |
| D | 1 | 52 | 367731 | 3020.65 | 504 | 489 | 121.6 |
| D | 2 | 250 | 99502 | 814.4 | 504 | 489 | 121.6 |
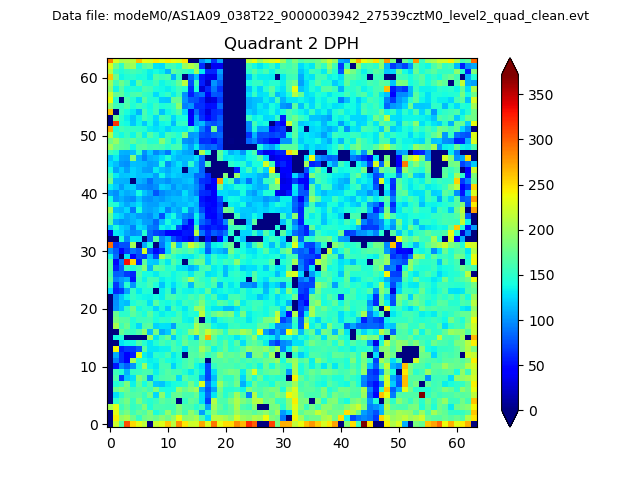
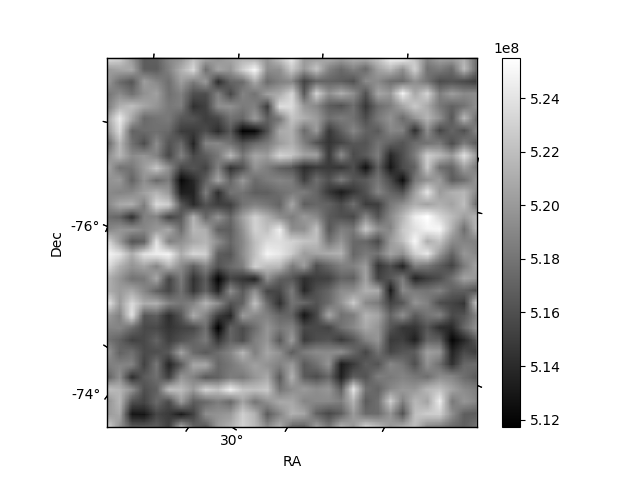
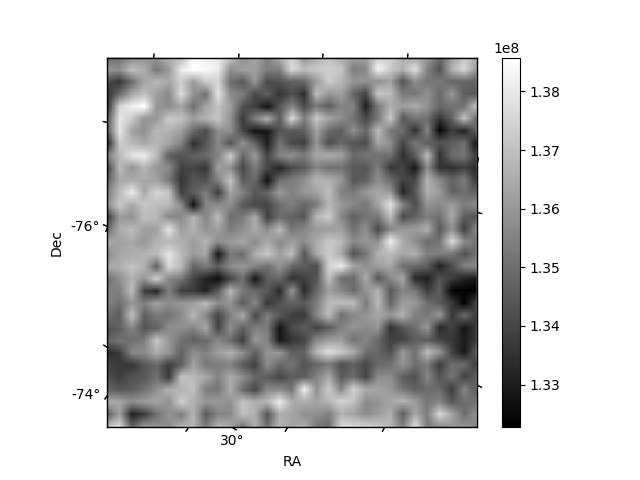
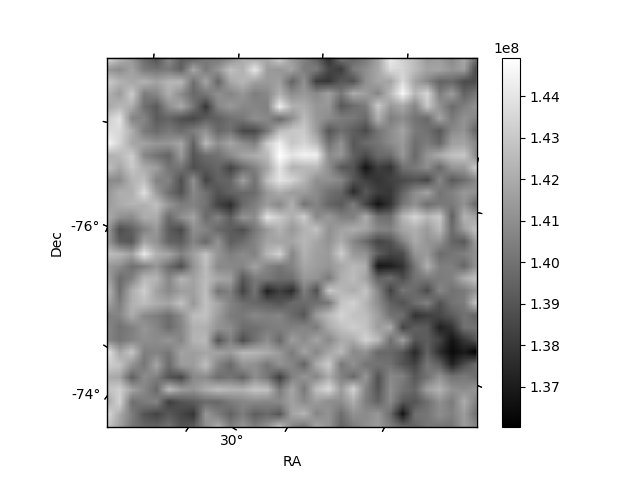
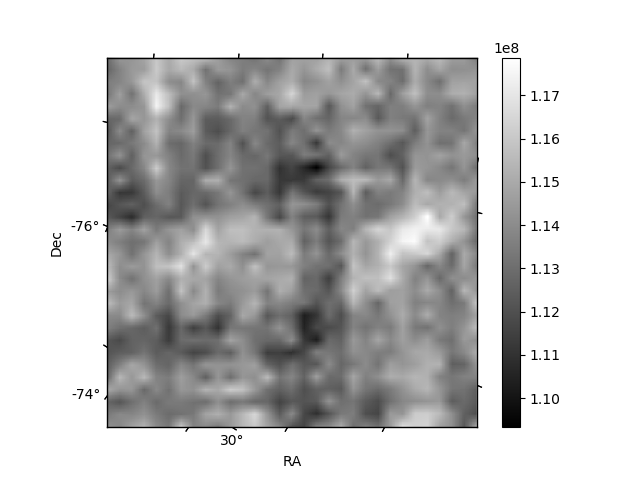
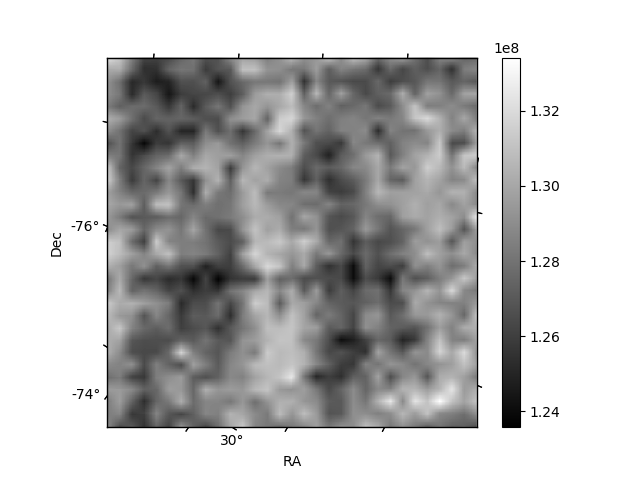
Histogram calculated using DETX and DETY for each event in the final _common_clean file
| Quadrant A | 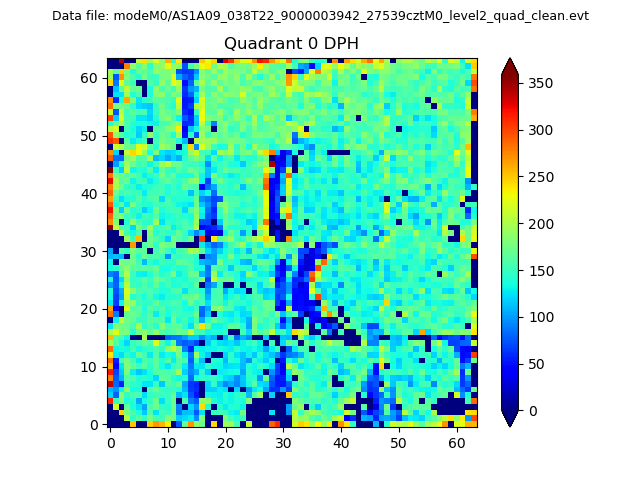 |
 |
Quadrant B |
|---|---|---|---|
| Quadrant D | 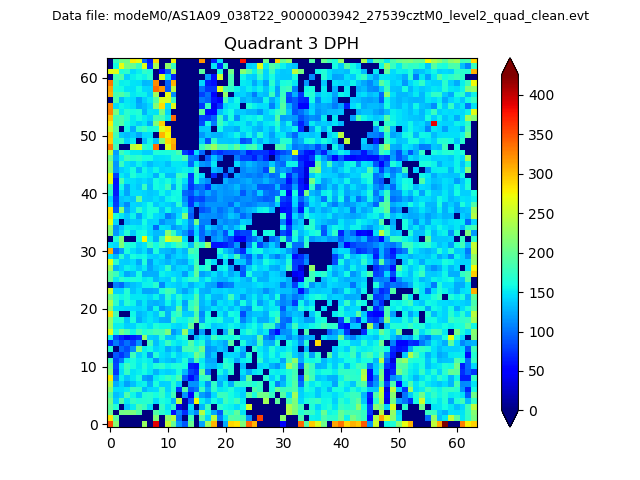 |
 |
Quadrant C |
| Plot type | Count rate plots | Images |
|---|---|---|
| Comparison with Poisson distribution Blue bars denote a histogram of data divided into 1 sec bins. Red curve is a Poisson curve with rate = median count rate of data. |
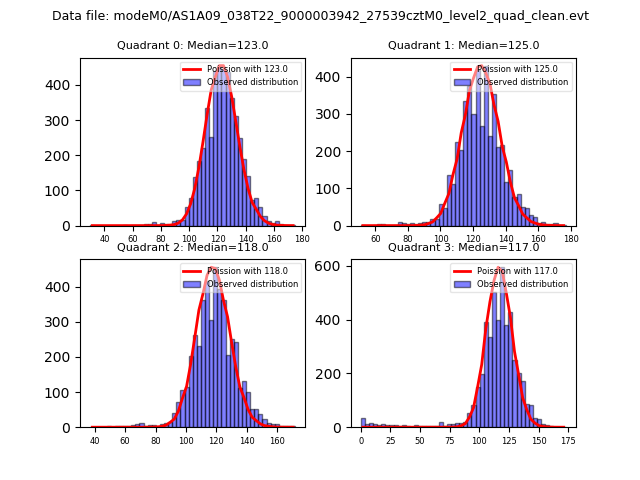 |
 |
| Quadrant-wise count rates Data is divided into 100 sec bins |
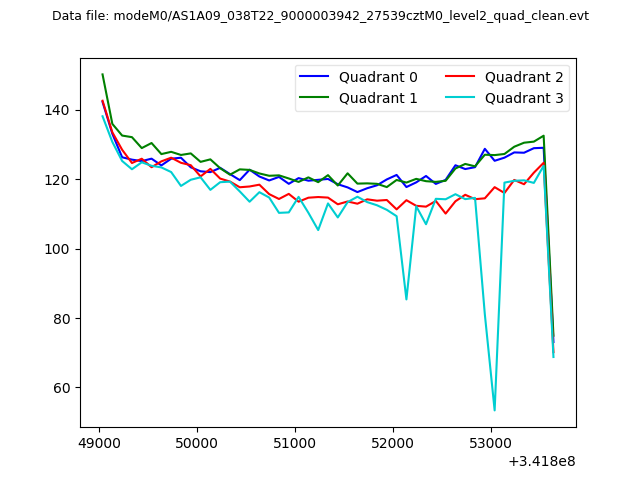 |
|
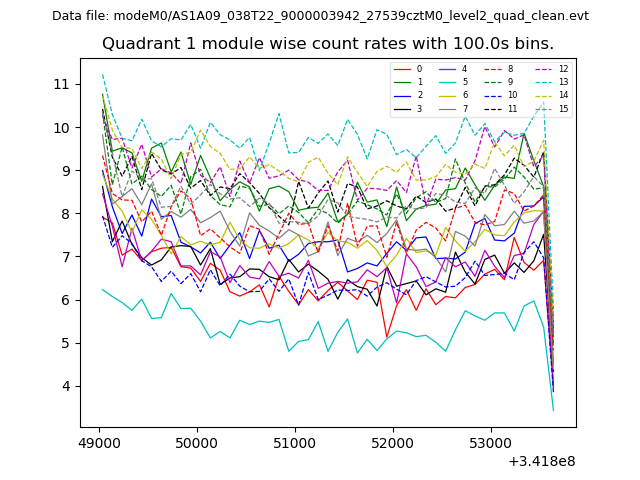
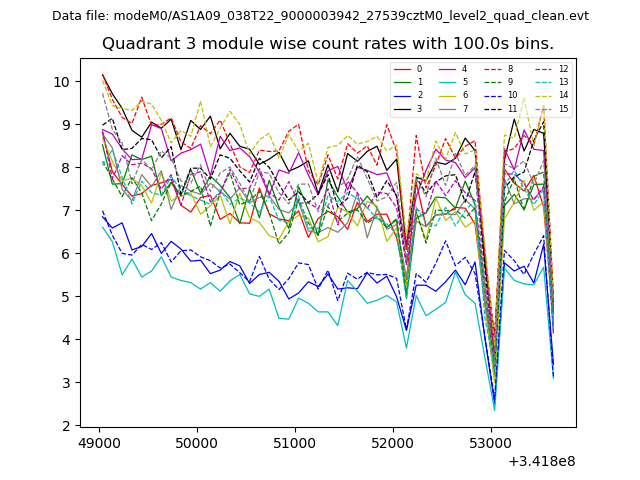
| Module-wise count rates for Quadrant A Data is divided into 100 sec bins |
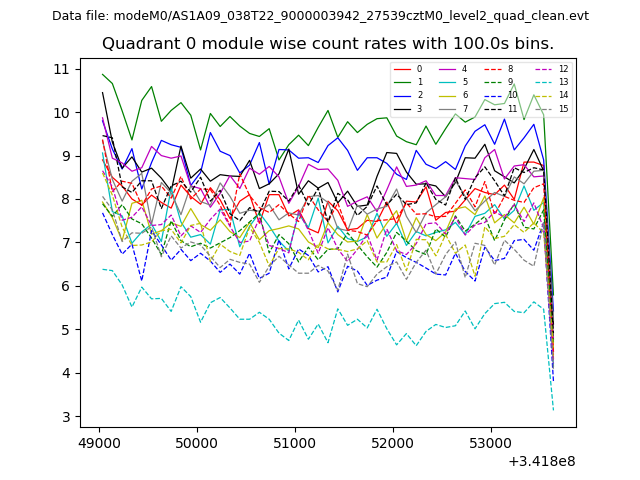 |
 |
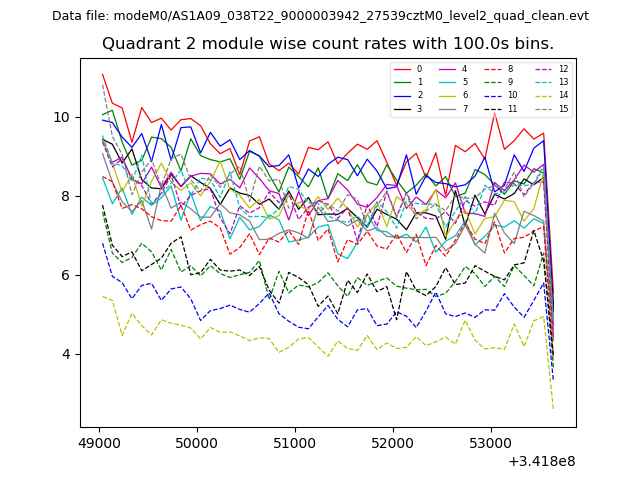
| Module-wise count rates for Quadrant B Data is divided into 100 sec bins |
 |
 |
| Module-wise count rates for Quadrant C Data is divided into 100 sec bins |
 |
 |
| Module-wise count rates for Quadrant D Data is divided into 100 sec bins |
 |
 |
| Parameter | Plot |
|---|---|
| CZT HV Monitor | 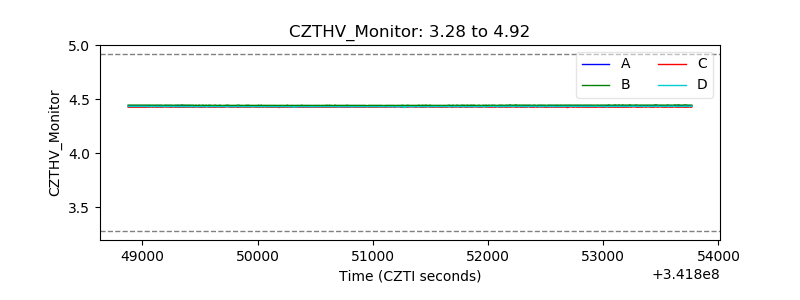 |
| D_VDD | 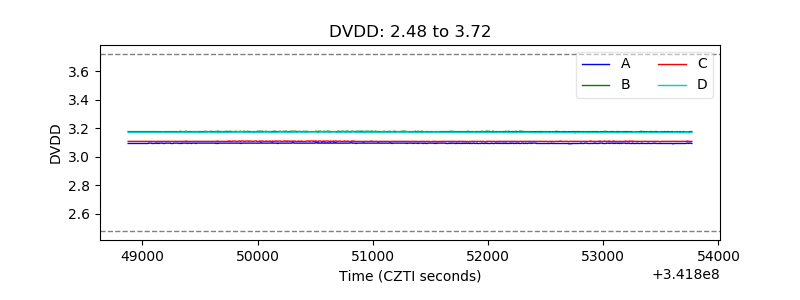 |
| Temperature 1 | 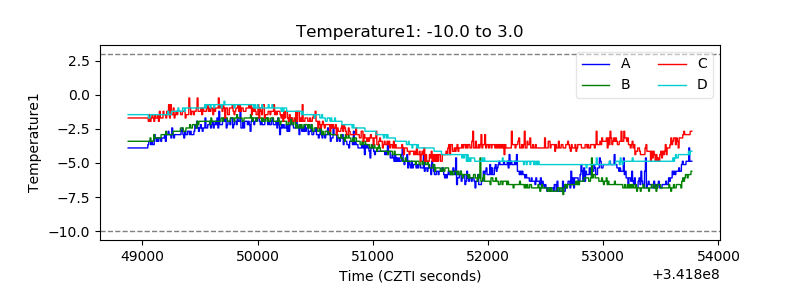 |
| Veto HV Monitor | 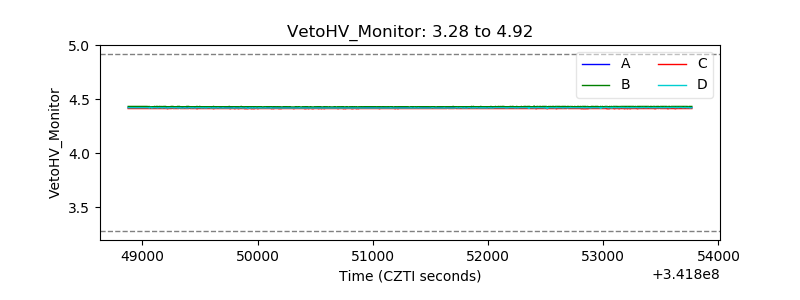 |
| Veto LLD | 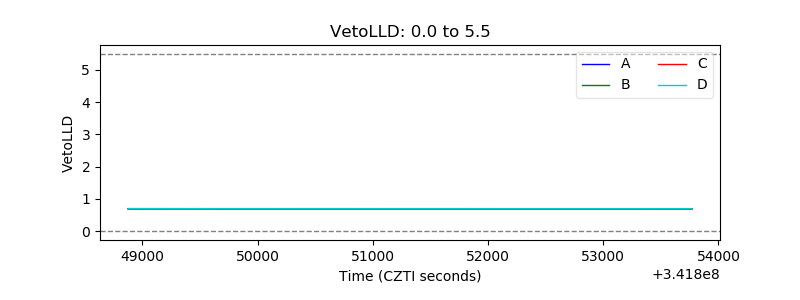 |
| Alpha Counter | 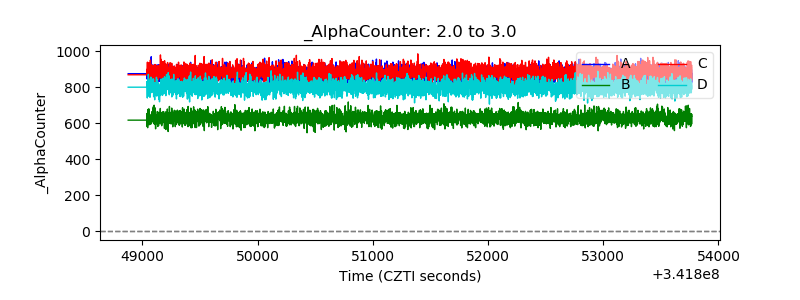 |
| _CPM_Rate | 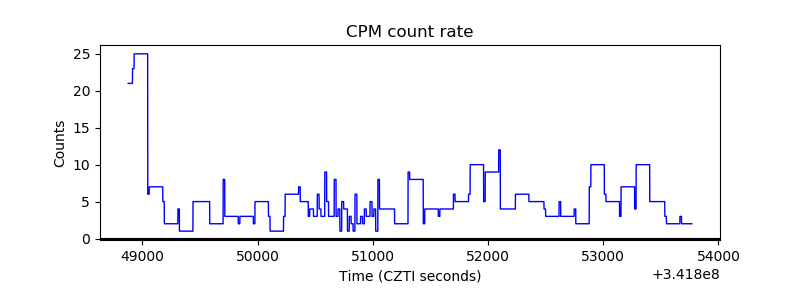 |
| CZT Counter | 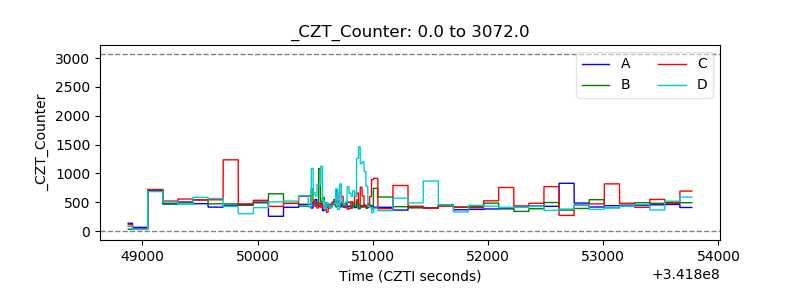 |
| +2.5 Volts monitor |  |
| +5 Volts monitor |  |
| _ROLL_ROT | 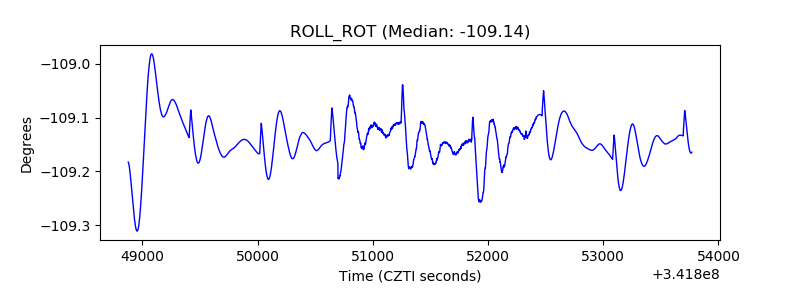 |
| _Roll_DEC |  |
| _Roll_RA | 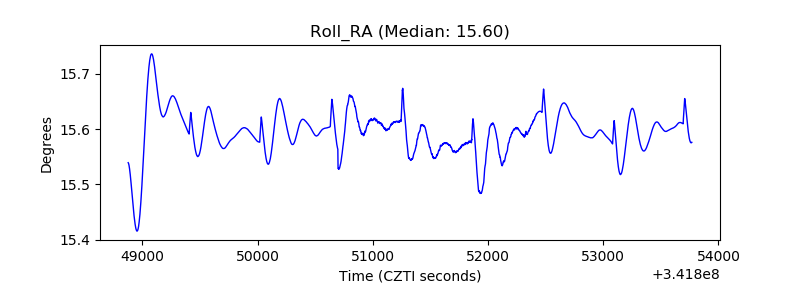 |
| Veto Counter | 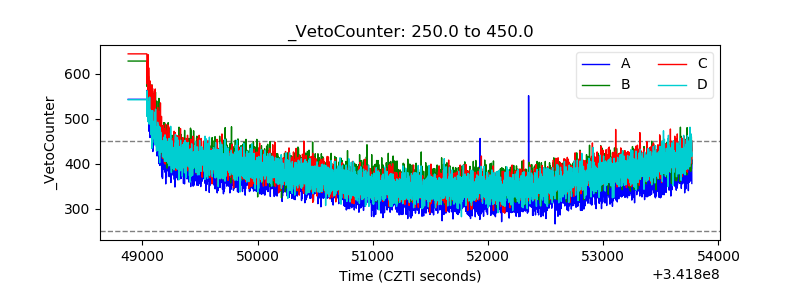 |