| Param | Original file | Final file |
|---|---|---|
| Filename | modeM0/AS1A09_038T23_9000003944cztM0_level2.fits | modeM0/AS1A09_038T23_9000003944cztM0_level2_quad_clean.evt |
| Size (bytes) | 50,339,520 | 60,531,840 |
| Size | 48.0 MB | 57.7 MB |
| Events in quadrant A | 301,946 | 382,525 |
| Events in quadrant B | 290,404 | 378,038 |
| Events in quadrant C | 294,118 | 360,046 |
| Events in quadrant D | 258,508 | 332,085 |
| Mode SS | |||
|---|---|---|---|
| Quadrant | BADHDUFLAG | Total packets | Discarded packets |
| A | 0 | 110 | 0 |
| B | 0 | 110 | 0 |
| C | 0 | 110 | 0 |
| D | 0 | 110 | 0 |
| Mode M9 | |||
|---|---|---|---|
| Quadrant | BADHDUFLAG | Total packets | Discarded packets |
| A | 0 | 5 | 0 |
| B | 0 | 5 | 0 |
| C | 0 | 5 | 0 |
| D | 0 | 5 | 0 |
| Mode M0 | |||
|---|---|---|---|
| Quadrant | BADHDUFLAG | Total packets | Discarded packets |
| A | 0 | 11140 | 0 |
| B | 0 | 11949 | 0 |
| C | 0 | 11299 | 0 |
| D | 0 | 12135 | 0 |
| Quadrant | Total seconds | Saturated seconds | Saturation percentage |
|---|---|---|---|
| A | 5426 | 68 | 1.253225% |
| B | 5426 | 114 | 2.100995% |
| C | 5426 | 80 | 1.474383% |
| D | 5426 | 108 | 1.990417% |
Noise dominated data is calculated using 1-second bins in cleaned event files. If a bin has >2000 counts, and if more than 50% of those come from <1% of pixels, then it is considered to be noise-dominated and hence unusable.
| Quadrant | # 1 sec bins | Bins with >0 counts | Bins with >2000 counts | High rate bins dominated by noise | Noise dominated (total time) | Noise dominated (detector-on time) | Marked lightcurve |
|---|---|---|---|---|---|---|---|
| A | 5956 | 5425 | 0 | 0 | 0.00% | 0.00% | 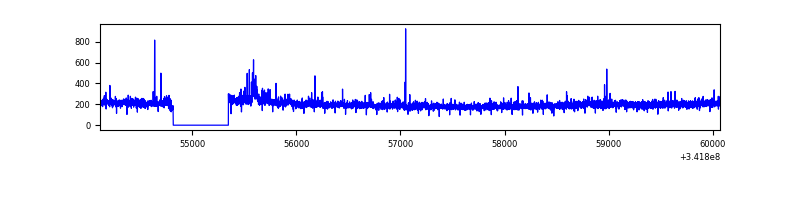 |
| B | 5955 | 5424 | 0 | 0 | 0.00% | 0.00% | 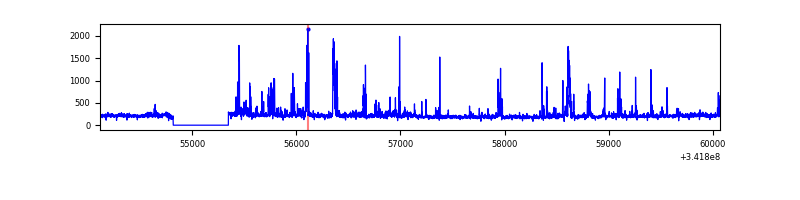 |
| C | 5956 | 5425 | 0 | 0 | 0.00% | 0.00% |  |
| D | 5955 | 5423 | 0 | 0 | 0.00% | 0.00% | 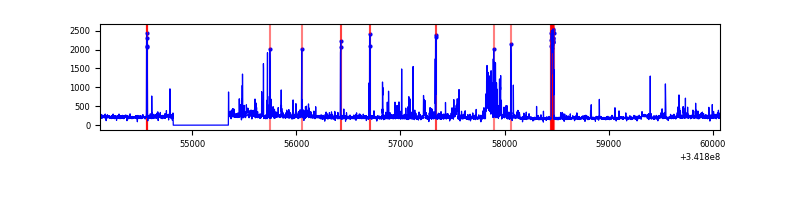 |
Top three noisy pixels from each quadrant. If the there are fewer than three noisy pixels in the level2.evt file, extra rows are filled as -1
| Pixel properties | Quadrant properties | ||||||
|---|---|---|---|---|---|---|---|
| Quadrant | DetID | PixID | Counts | Sigma | Mean | Median | Sigma |
| A | 0 | 29 | 247 | 8.11 | 78 | 74 | 21.3 |
| A | 7 | 110 | 244 | 7.97 | 78 | 74 | 21.3 |
| A | 9 | 19 | 233 | 7.45 | 78 | 74 | 21.3 |
| B | 2 | 9 | 250 | 10.39 | 76 | 72 | 17.1 |
| B | 3 | 17 | 212 | 8.17 | 76 | 72 | 17.1 |
| B | 14 | 254 | 209 | 7.99 | 76 | 72 | 17.1 |
| C | 1 | 80 | 238 | 7.65 | 77 | 72 | 21.7 |
| C | 1 | 81 | 218 | 6.73 | 77 | 72 | 21.7 |
| C | 9 | 209 | 207 | 6.22 | 77 | 72 | 21.7 |
| D | 3 | 14 | 208 | 6.59 | 73 | 67 | 21.4 |
| D | 6 | 67 | 195 | 5.98 | 73 | 67 | 21.4 |
| D | 6 | 231 | 194 | 5.93 | 73 | 67 | 21.4 |
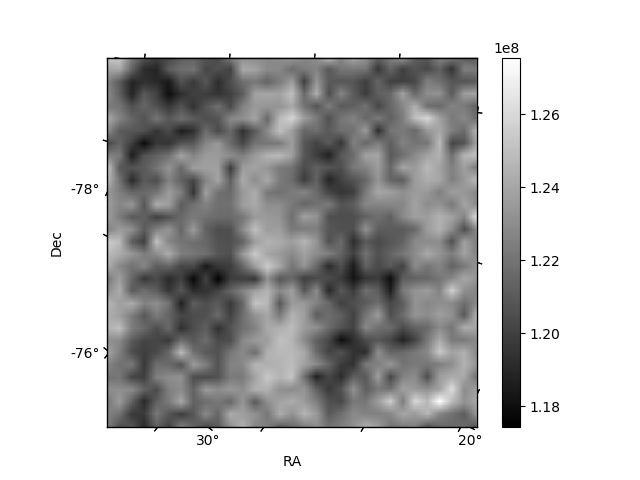
Histogram calculated using DETX and DETY for each event in the final _common_clean file
| Quadrant A | 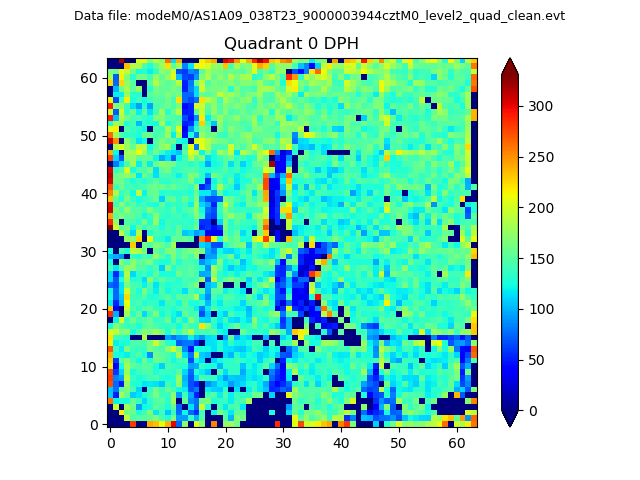 |
 |
Quadrant B |
|---|---|---|---|
| Quadrant D |  |
 |
Quadrant C |
| Plot type | Count rate plots | Images |
|---|---|---|
| Comparison with Poisson distribution Blue bars denote a histogram of data divided into 1 sec bins. Red curve is a Poisson curve with rate = median count rate of data. |
 |
 |
| Quadrant-wise count rates Data is divided into 100 sec bins |
 |
|
| Module-wise count rates for Quadrant A Data is divided into 100 sec bins |
 |
 |
| Module-wise count rates for Quadrant B Data is divided into 100 sec bins |
 |
 |
| Module-wise count rates for Quadrant C Data is divided into 100 sec bins |
 |
 |
| Module-wise count rates for Quadrant D Data is divided into 100 sec bins |
 |
 |
| Parameter | Plot |
|---|---|
| CZT HV Monitor |  |
| D_VDD |  |
| Temperature 1 |  |
| Veto HV Monitor | 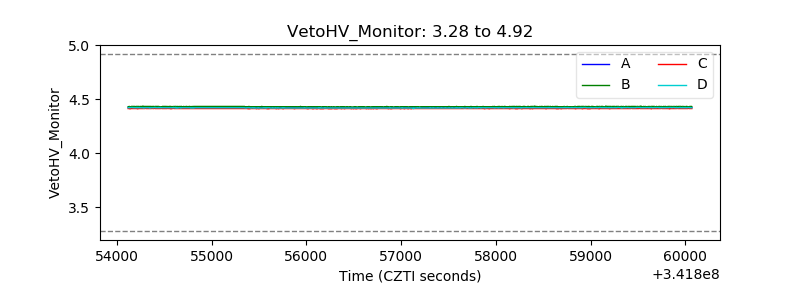 |
| Veto LLD | 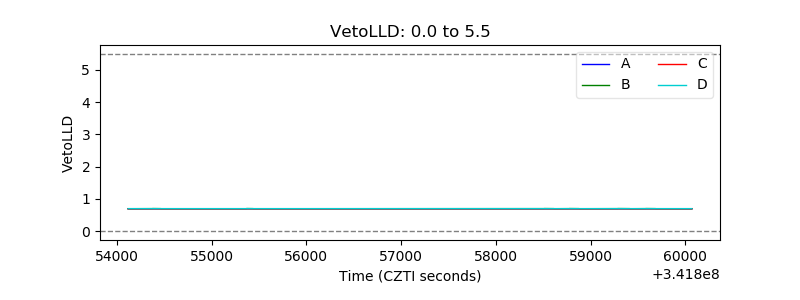 |
| Alpha Counter |  |
| _CPM_Rate |  |
| CZT Counter |  |
| +2.5 Volts monitor |  |
| +5 Volts monitor |  |
| _ROLL_ROT |  |
| _Roll_DEC |  |
| _Roll_RA | 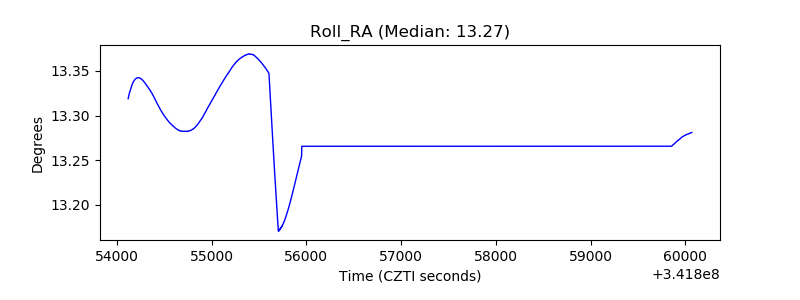 |
| Veto Counter |  |