| Param | Original file | Final file |
|---|---|---|
| Filename | modeM0/AS1A09_038T23_9000003944_27539cztM0_level2.evt | modeM0/AS1A09_038T23_9000003944_27539cztM0_level2_quad_clean.evt |
| Size (bytes) | 330,148,800 | 80,452,800 |
| Size | 314.9 MB | 76.7 MB |
| Events in quadrant A | 2,249,122 | 533,571 |
| Events in quadrant B | 2,577,994 | 536,765 |
| Events in quadrant C | 2,290,711 | 515,830 |
| Events in quadrant D | 2,543,758 | 503,573 |
| Mode M9 | |||
|---|---|---|---|
| Quadrant | BADHDUFLAG | Total packets | Discarded packets |
| A | 0 | 5 | 0 |
| B | 0 | 5 | 0 |
| C | 0 | 5 | 0 |
| D | 0 | 5 | 0 |
| Mode M0 | |||
|---|---|---|---|
| Quadrant | BADHDUFLAG | Total packets | Discarded packets |
| A | 0 | 10154 | 0 |
| B | 0 | 10944 | 0 |
| C | 0 | 10305 | 0 |
| D | 0 | 11080 | 0 |
| Quadrant | Total seconds | Saturated seconds | Saturation percentage |
|---|---|---|---|
| A | 4937 | 67 | 1.357099% |
| B | 4937 | 112 | 2.268584% |
| C | 4937 | 73 | 1.478631% |
| D | 4937 | 106 | 2.147053% |
Noise dominated data is calculated using 1-second bins in cleaned event files. If a bin has >2000 counts, and if more than 50% of those come from <1% of pixels, then it is considered to be noise-dominated and hence unusable.
| Quadrant | # 1 sec bins | Bins with >0 counts | Bins with >2000 counts | High rate bins dominated by noise | Noise dominated (total time) | Noise dominated (detector-on time) | Marked lightcurve |
|---|---|---|---|---|---|---|---|
| A | 5467 | 4937 | 0 | 0 | 0.00% | 0.00% | 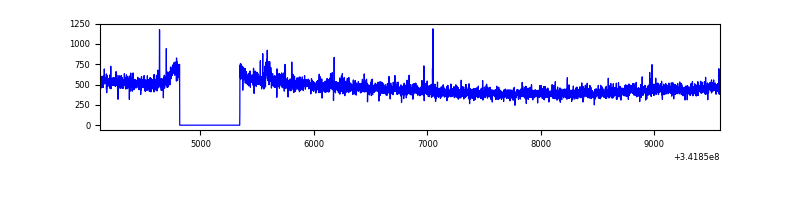 |
| B | 5467 | 4937 | 42 | 42 | 0.77% | 0.85% | 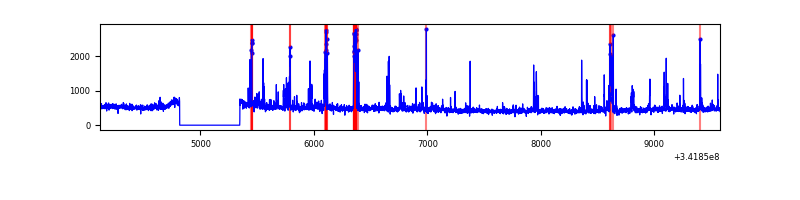 |
| C | 5467 | 4937 | 2 | 2 | 0.04% | 0.04% | 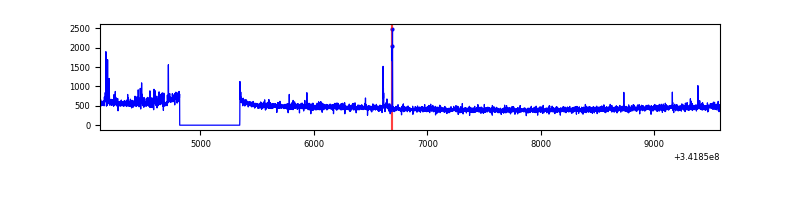 |
| D | 5467 | 4937 | 77 | 77 | 1.41% | 1.56% | 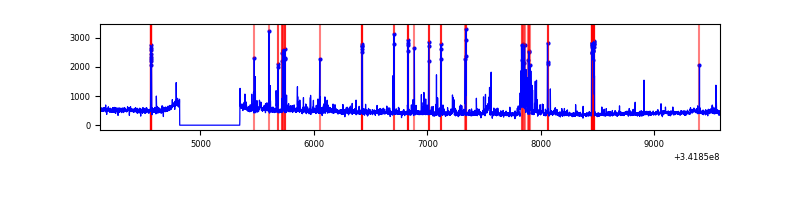 |
Top three noisy pixels from each quadrant. If the there are fewer than three noisy pixels in the level2.evt file, extra rows are filled as -1
| Pixel properties | Quadrant properties | ||||||
|---|---|---|---|---|---|---|---|
| Quadrant | DetID | PixID | Counts | Sigma | Mean | Median | Sigma |
| A | 0 | 13 | 14172 | 118.2 | 572 | 561 | 115.2 |
| A | 4 | 2 | 12023 | 99.54 | 572 | 561 | 115.2 |
| A | 15 | 174 | 9174 | 74.8 | 572 | 561 | 115.2 |
| B | 10 | 245 | 252249 | 2305.39 | 568 | 551 | 109.2 |
| B | 0 | 230 | 33222 | 299.24 | 568 | 551 | 109.2 |
| B | 4 | 200 | 24727 | 221.44 | 568 | 551 | 109.2 |
| C | 14 | 238 | 88987 | 682.35 | 548 | 549 | 129.6 |
| C | 7 | 221 | 51614 | 394.0 | 548 | 549 | 129.6 |
| C | 2 | 16 | 16214 | 120.86 | 548 | 549 | 129.6 |
| D | 1 | 52 | 291955 | 2213.28 | 546 | 529 | 131.7 |
| D | 2 | 250 | 77333 | 583.3 | 546 | 529 | 131.7 |
| D | 7 | 80 | 71459 | 538.69 | 546 | 529 | 131.7 |
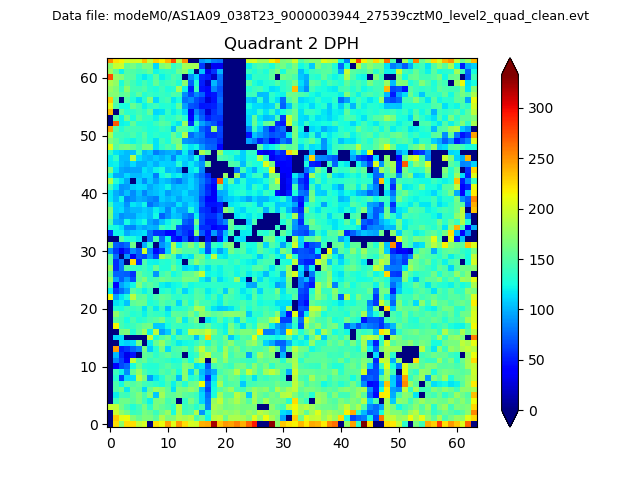
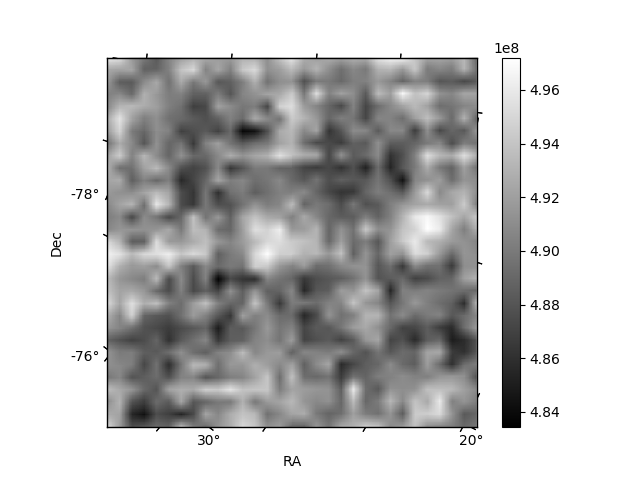
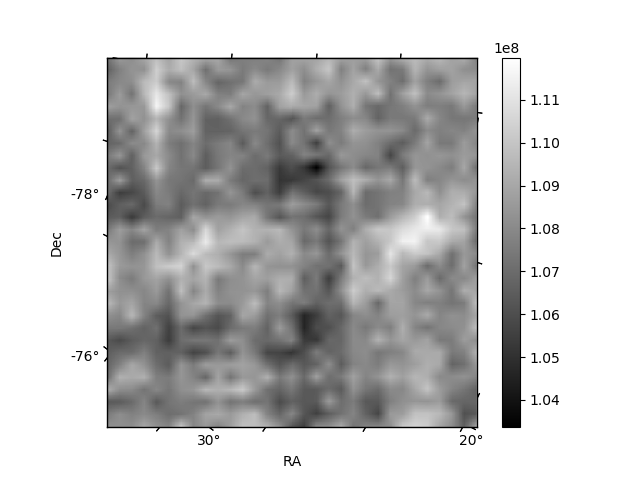
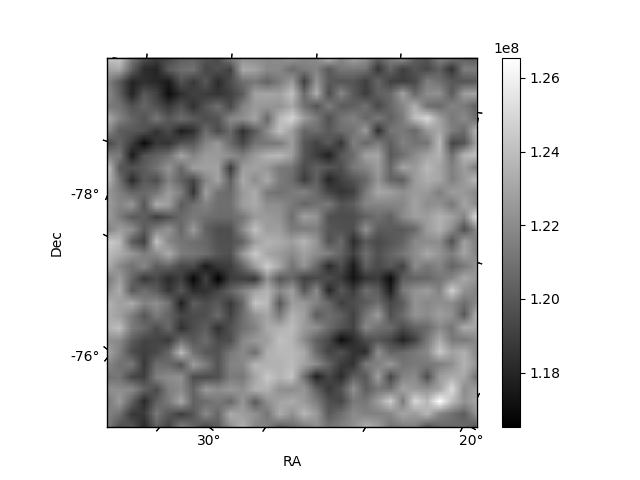
Histogram calculated using DETX and DETY for each event in the final _common_clean file
| Quadrant A | 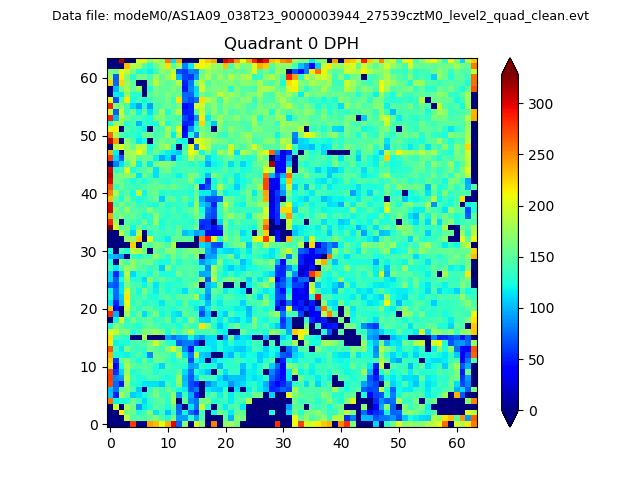 |
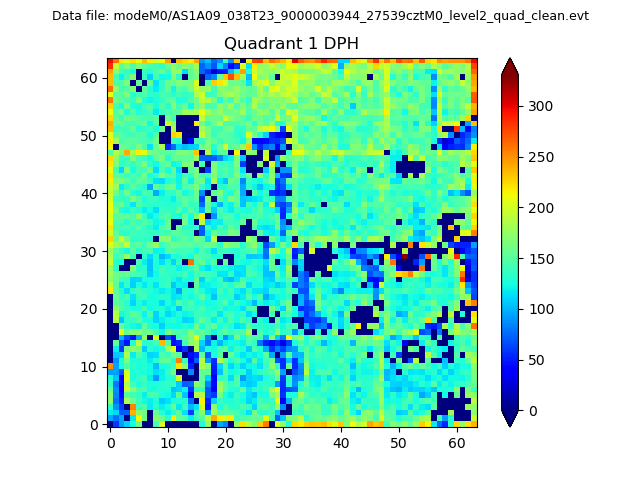 |
Quadrant B |
|---|---|---|---|
| Quadrant D | 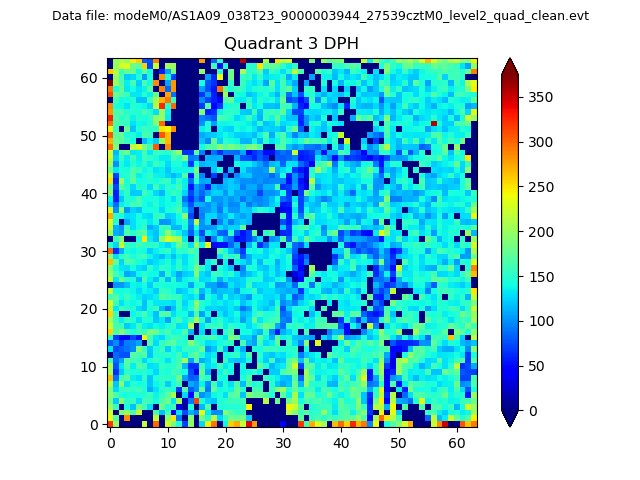 |
 |
Quadrant C |
| Plot type | Count rate plots | Images |
|---|---|---|
| Comparison with Poisson distribution Blue bars denote a histogram of data divided into 1 sec bins. Red curve is a Poisson curve with rate = median count rate of data. |
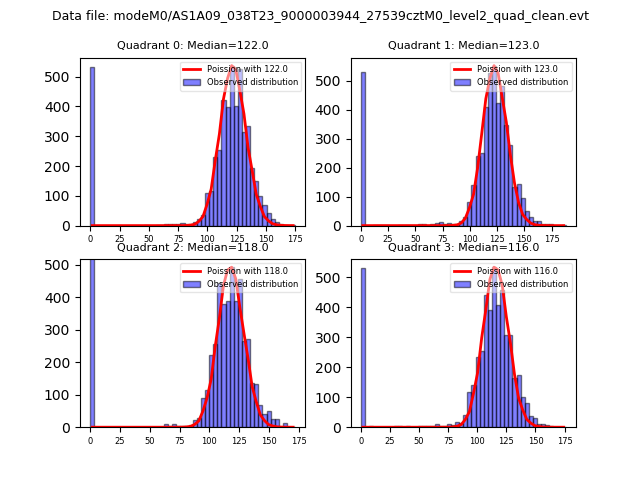 |
 |
| Quadrant-wise count rates Data is divided into 100 sec bins |
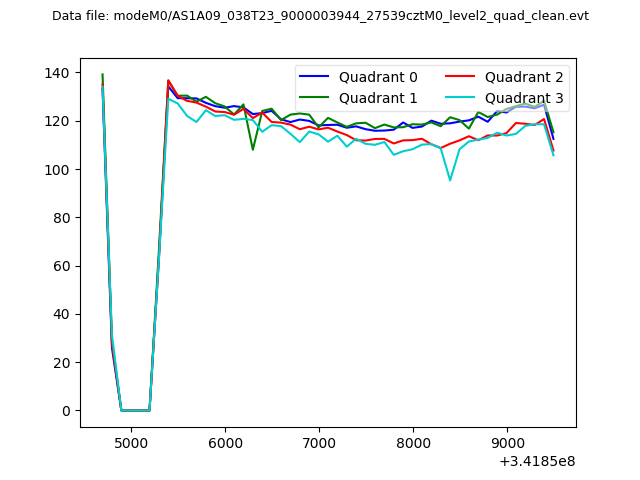 |
|
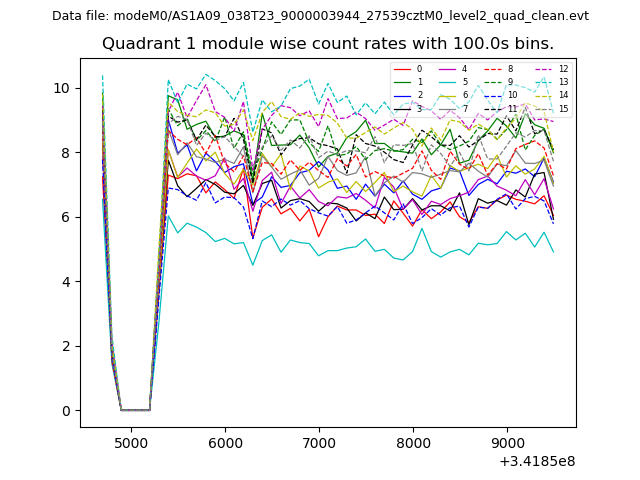
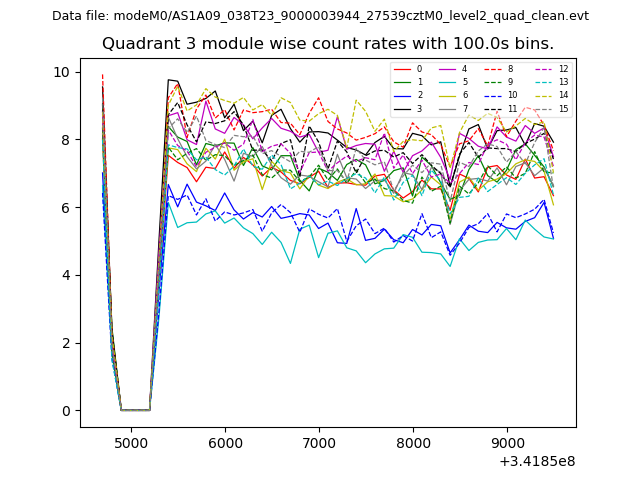
| Module-wise count rates for Quadrant A Data is divided into 100 sec bins |
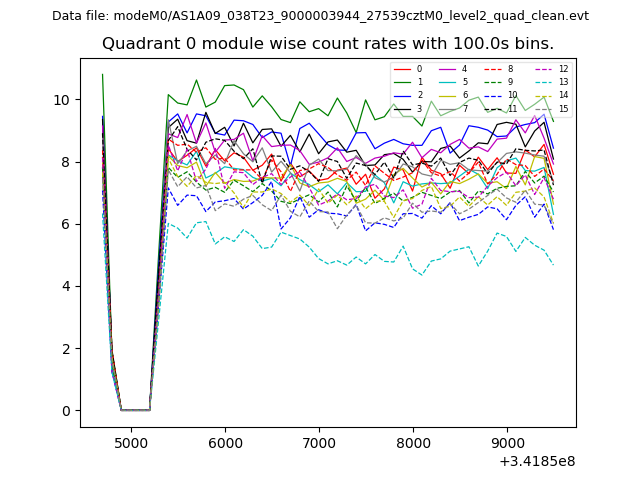 |
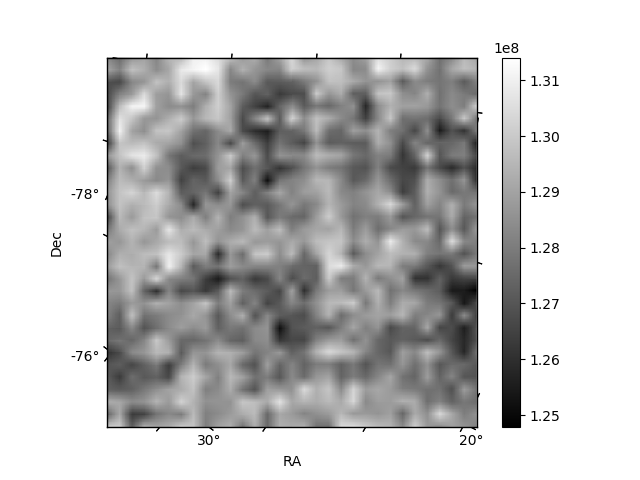 |
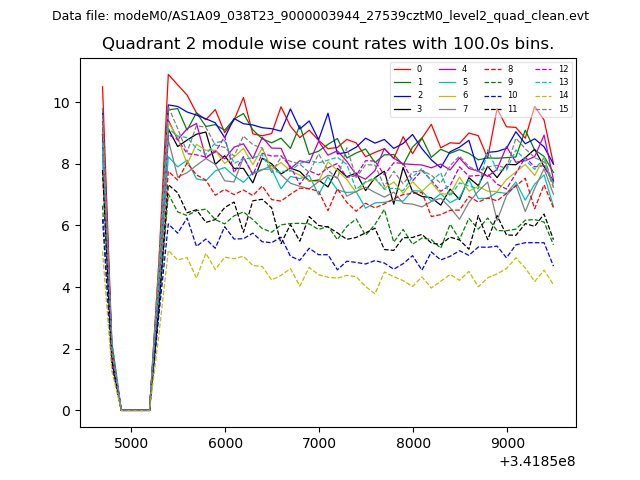
| Module-wise count rates for Quadrant B Data is divided into 100 sec bins |
 |
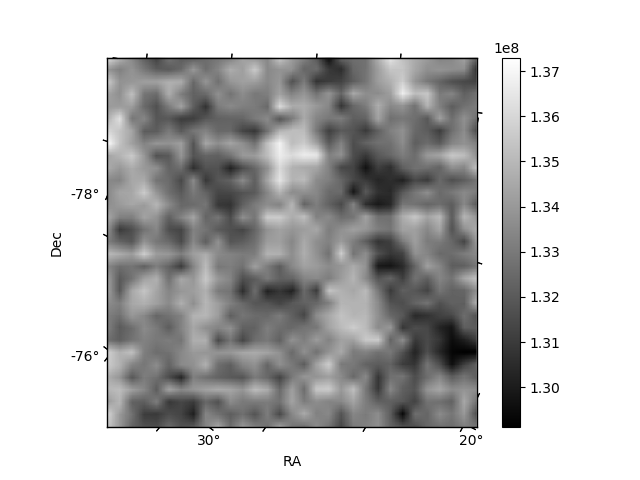 |
| Module-wise count rates for Quadrant C Data is divided into 100 sec bins |
 |
 |
| Module-wise count rates for Quadrant D Data is divided into 100 sec bins |
 |
 |
| Parameter | Plot |
|---|---|
| CZT HV Monitor | 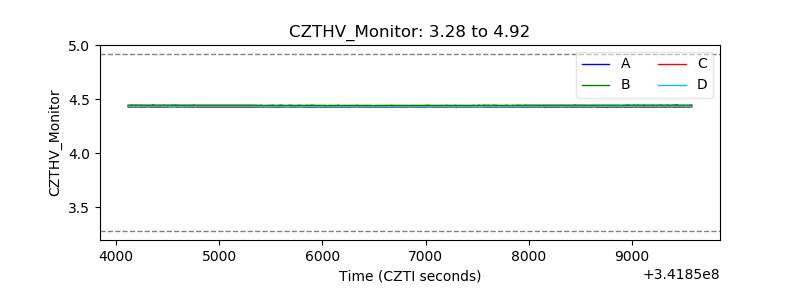 |
| D_VDD | 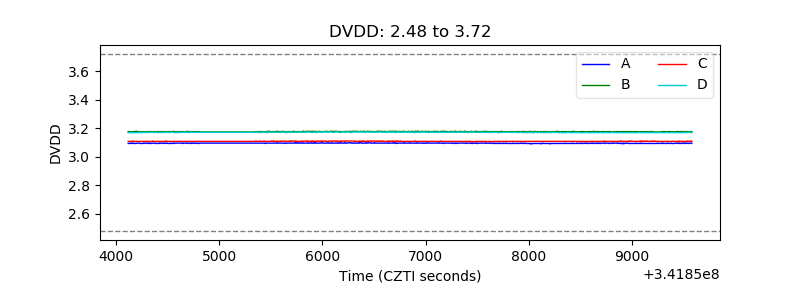 |
| Temperature 1 | 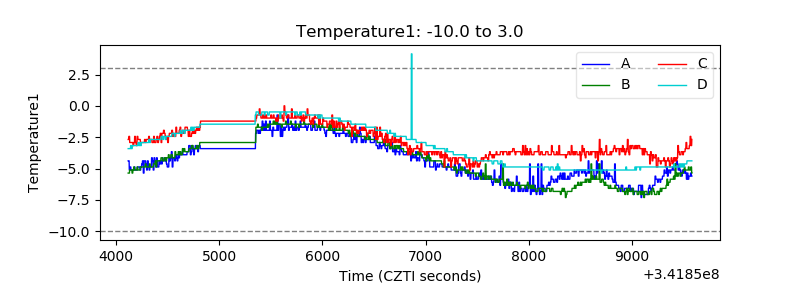 |
| Veto HV Monitor | 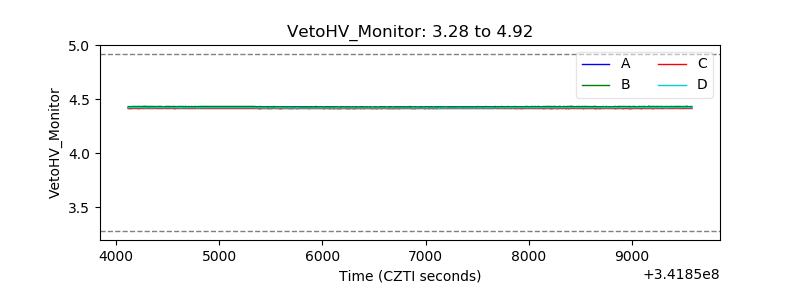 |
| Veto LLD | 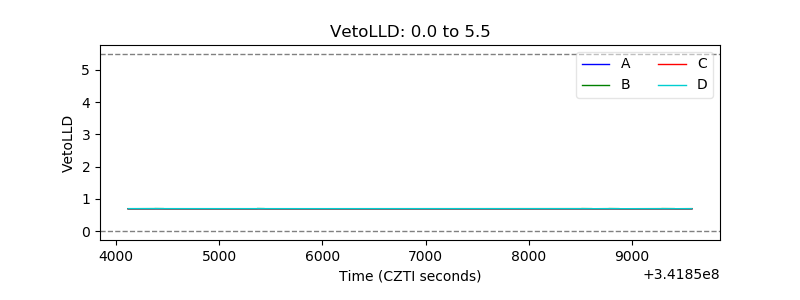 |
| Alpha Counter | 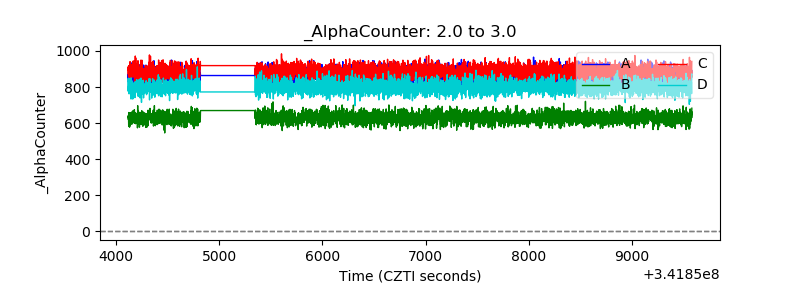 |
| _CPM_Rate | 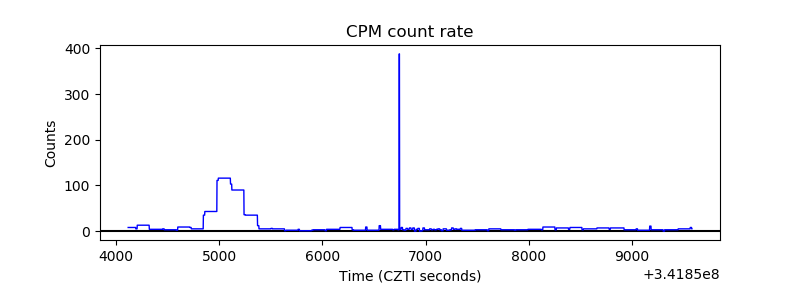 |
| CZT Counter | 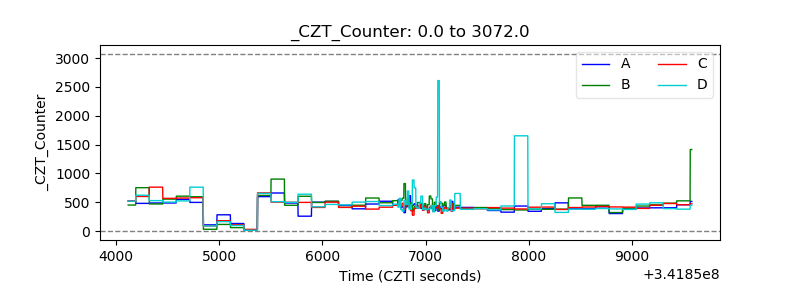 |
| +2.5 Volts monitor | 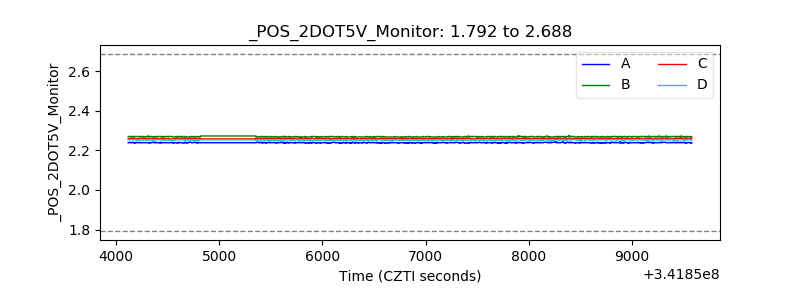 |
| +5 Volts monitor |  |
| _ROLL_ROT | 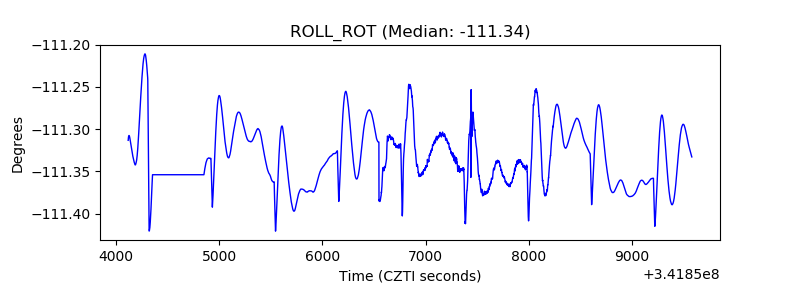 |
| _Roll_DEC | 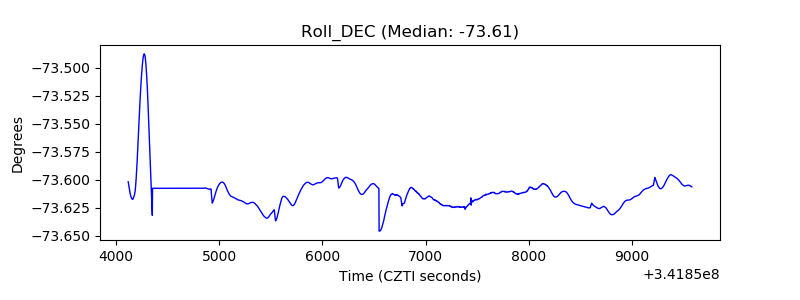 |
| _Roll_RA | 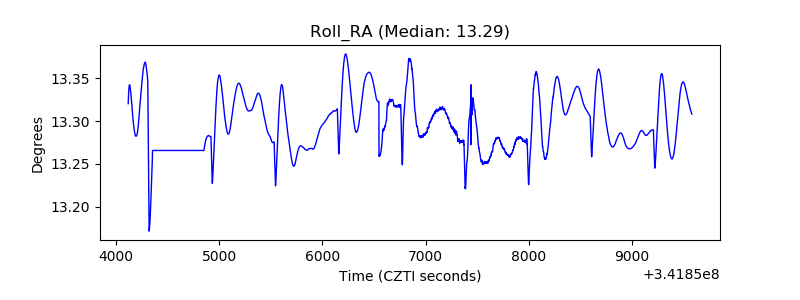 |
| Veto Counter | 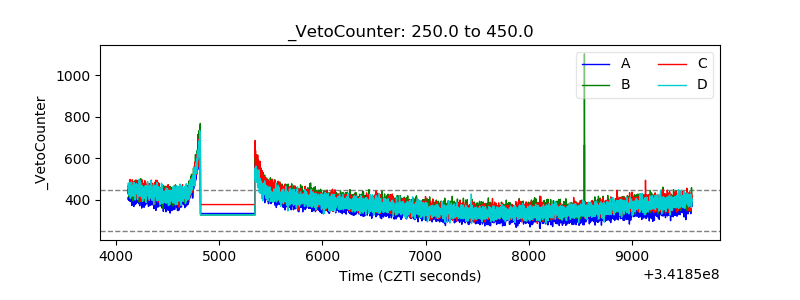 |