| Param | Original file | Final file |
|---|---|---|
| Filename | modeM0/AS1A09_038T23_9000003944_27540cztM0_level2.evt | modeM0/AS1A09_038T23_9000003944_27540cztM0_level2_quad_clean.evt |
| Size (bytes) | 51,791,040 | 6,989,760 |
| Size | 49.4 MB | 6.7 MB |
| Events in quadrant A | 359,916 | 38,523 |
| Events in quadrant B | 385,316 | 38,985 |
| Events in quadrant C | 377,153 | 36,607 |
| Events in quadrant D | 391,151 | 36,396 |
| Mode M0 | |||
|---|---|---|---|
| Quadrant | BADHDUFLAG | Total packets | Discarded packets |
| A | 0 | 1531 | 0 |
| B | 0 | 1578 | 0 |
| C | 0 | 1545 | 0 |
| D | 0 | 1626 | 0 |
| Quadrant | Total seconds | Saturated seconds | Saturation percentage |
|---|---|---|---|
| A | 761 | 2 | 0.262812% |
| B | 762 | 4 | 0.524934% |
| C | 762 | 9 | 1.181102% |
| D | 762 | 2 | 0.262467% |
Noise dominated data is calculated using 1-second bins in cleaned event files. If a bin has >2000 counts, and if more than 50% of those come from <1% of pixels, then it is considered to be noise-dominated and hence unusable.
| Quadrant | # 1 sec bins | Bins with >0 counts | Bins with >2000 counts | High rate bins dominated by noise | Noise dominated (total time) | Noise dominated (detector-on time) | Marked lightcurve |
|---|---|---|---|---|---|---|---|
| A | 761 | 761 | 0 | 0 | 0.00% | 0.00% | 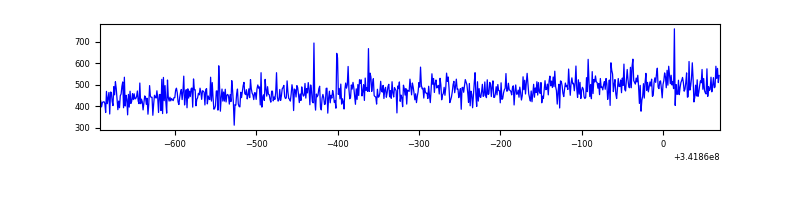 |
| B | 761 | 761 | 1 | 1 | 0.13% | 0.13% | 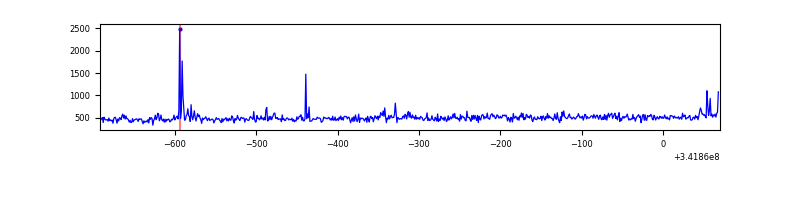 |
| C | 762 | 762 | 0 | 0 | 0.00% | 0.00% | 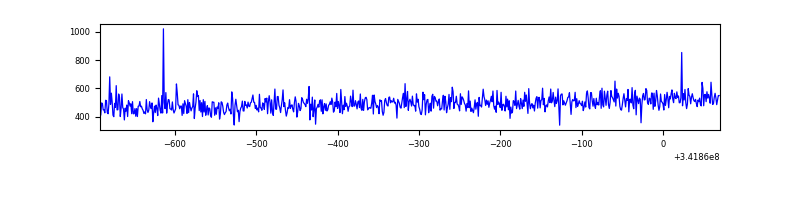 |
| D | 762 | 762 | 2 | 2 | 0.26% | 0.26% | 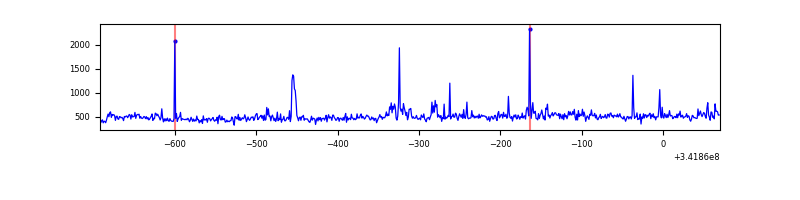 |
Top three noisy pixels from each quadrant. If the there are fewer than three noisy pixels in the level2.evt file, extra rows are filled as -1
| Pixel properties | Quadrant properties | ||||||
|---|---|---|---|---|---|---|---|
| Quadrant | DetID | PixID | Counts | Sigma | Mean | Median | Sigma |
| A | 13 | 254 | 1193 | 51.98 | 93 | 90 | 21.2 |
| A | 3 | 137 | 894 | 37.89 | 93 | 90 | 21.2 |
| A | 0 | 226 | 760 | 31.58 | 93 | 90 | 21.2 |
| B | 10 | 245 | 14208 | 707.32 | 93 | 90 | 20.0 |
| B | 0 | 190 | 2333 | 112.37 | 93 | 90 | 20.0 |
| B | 12 | 111 | 2180 | 104.71 | 93 | 90 | 20.0 |
| C | 14 | 238 | 15319 | 644.21 | 92 | 92 | 23.6 |
| C | 2 | 16 | 1556 | 61.94 | 92 | 92 | 23.6 |
| C | 13 | 61 | 639 | 23.14 | 92 | 92 | 23.6 |
| D | 1 | 52 | 42626 | 1754.72 | 92 | 89 | 24.2 |
| D | 2 | 234 | 2879 | 115.09 | 92 | 89 | 24.2 |
| D | 7 | 80 | 2107 | 83.25 | 92 | 89 | 24.2 |
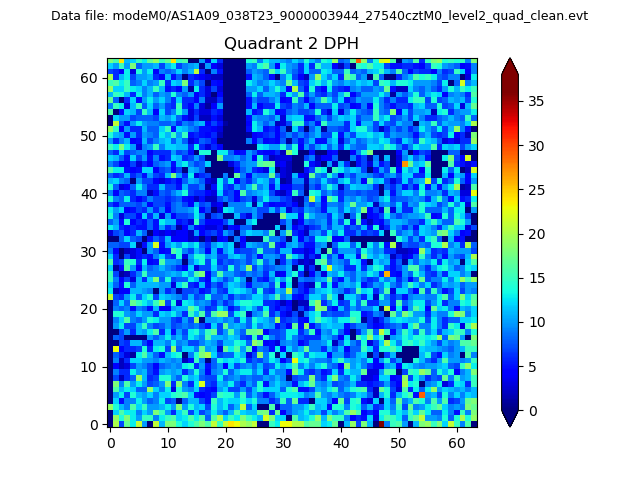
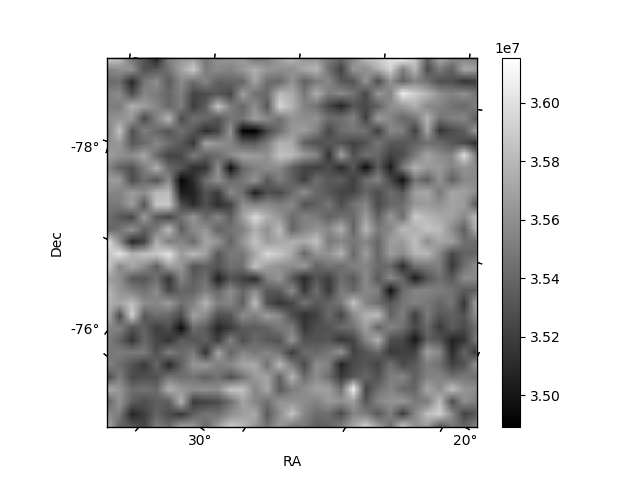
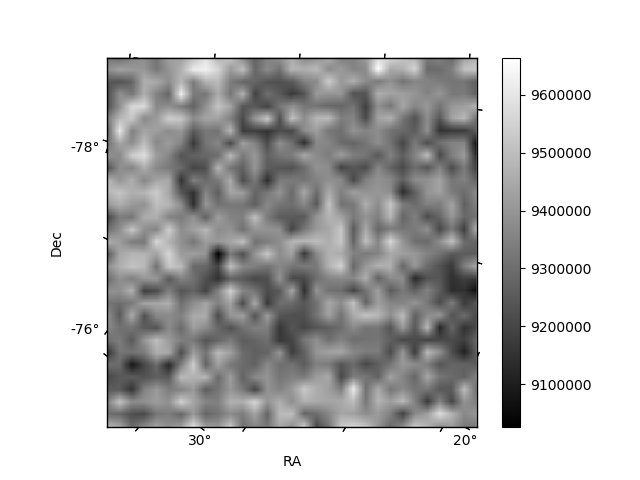
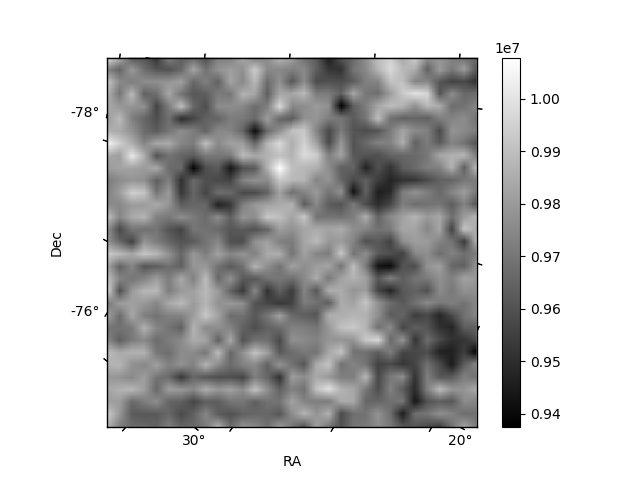
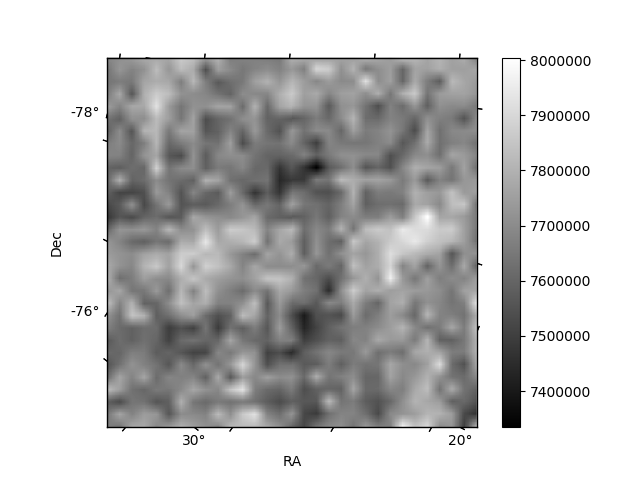
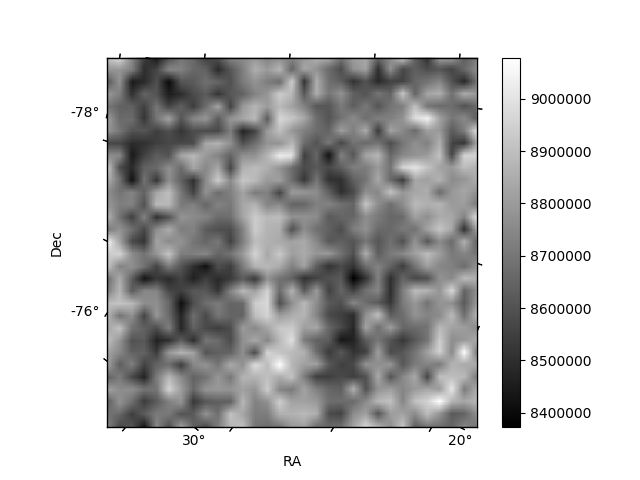
Histogram calculated using DETX and DETY for each event in the final _common_clean file
| Quadrant A | 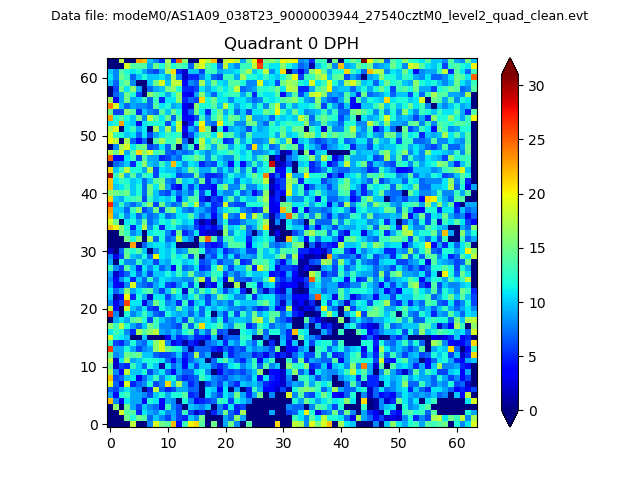 |
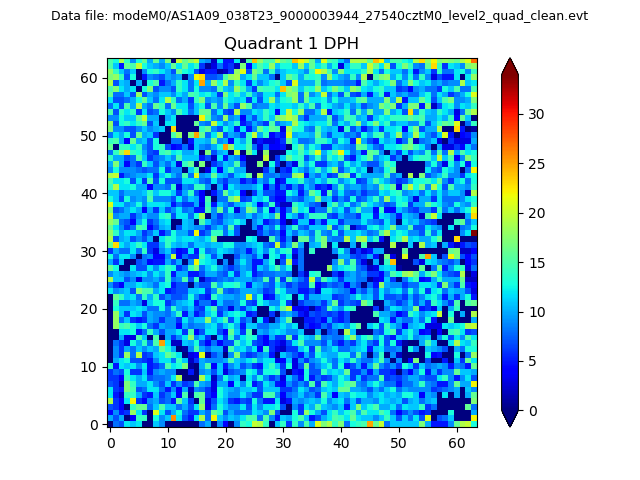 |
Quadrant B |
|---|---|---|---|
| Quadrant D | 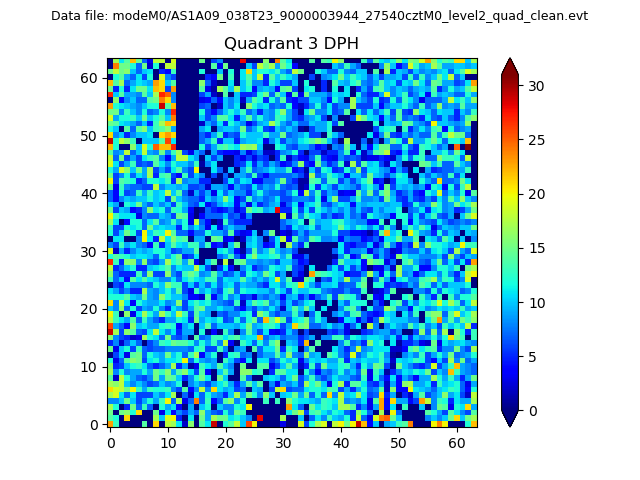 |
 |
Quadrant C |
| Plot type | Count rate plots | Images |
|---|---|---|
| Comparison with Poisson distribution Blue bars denote a histogram of data divided into 1 sec bins. Red curve is a Poisson curve with rate = median count rate of data. |
 |
 |
| Quadrant-wise count rates Data is divided into 100 sec bins |
 |
|
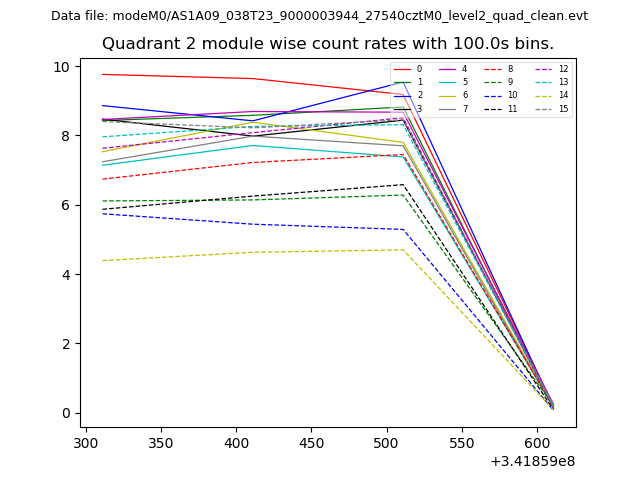
| Module-wise count rates for Quadrant A Data is divided into 100 sec bins |
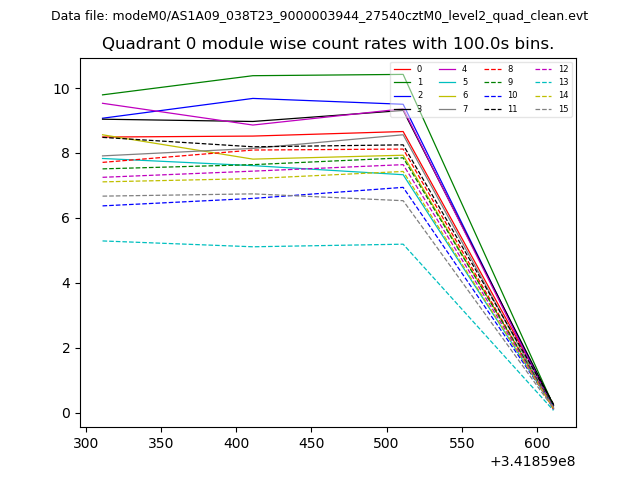 |
 |
| Module-wise count rates for Quadrant B Data is divided into 100 sec bins |
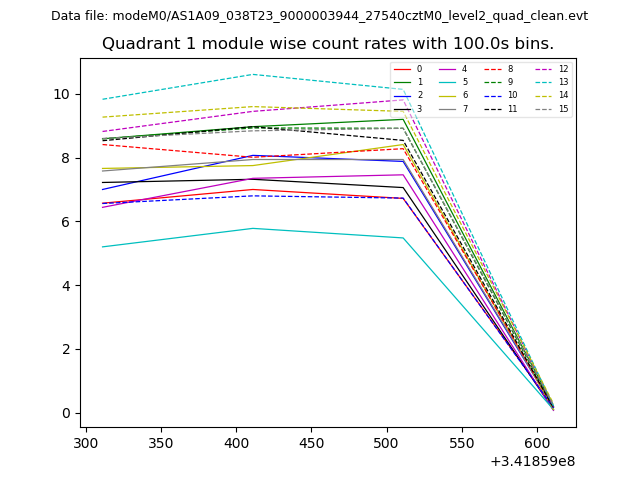 |
 |
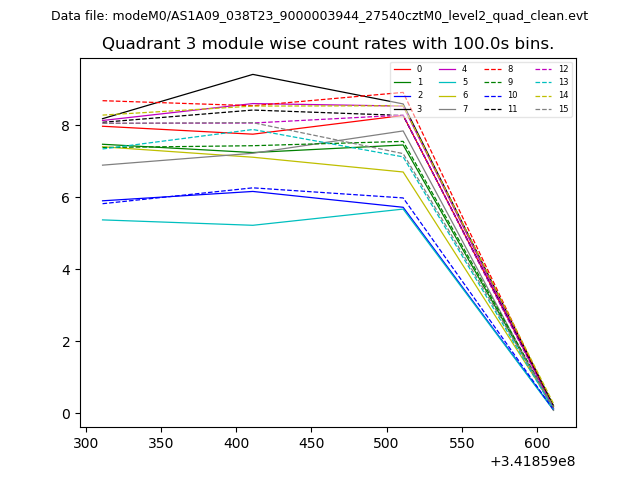
| Module-wise count rates for Quadrant C Data is divided into 100 sec bins |
 |
 |
| Module-wise count rates for Quadrant D Data is divided into 100 sec bins |
 |
 |
| Parameter | Plot |
|---|---|
| CZT HV Monitor | 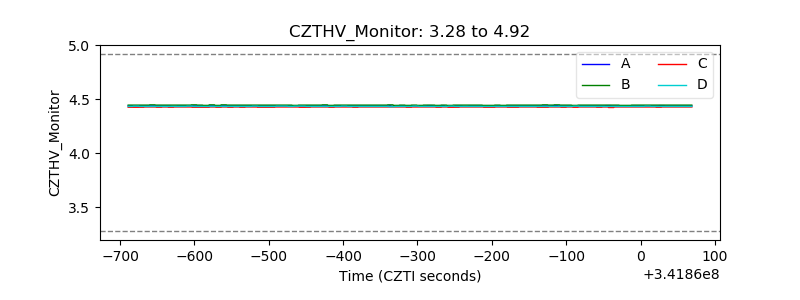 |
| D_VDD | 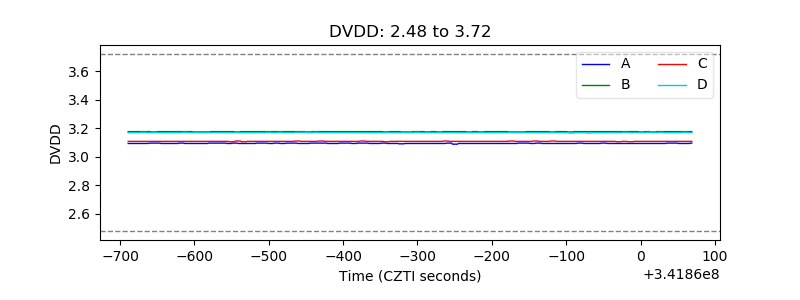 |
| Temperature 1 | 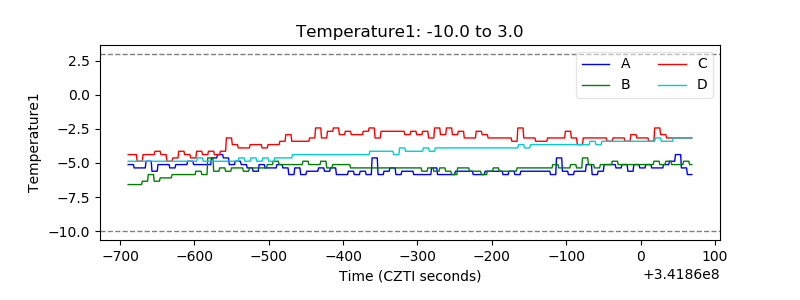 |
| Veto HV Monitor | 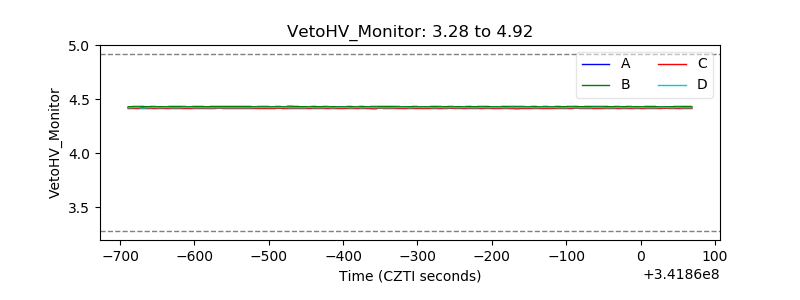 |
| Veto LLD | 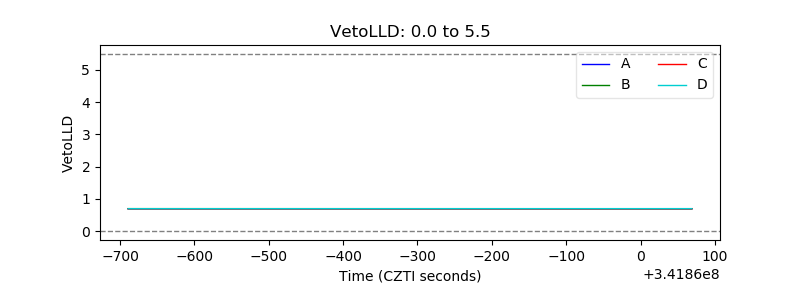 |
| Alpha Counter | 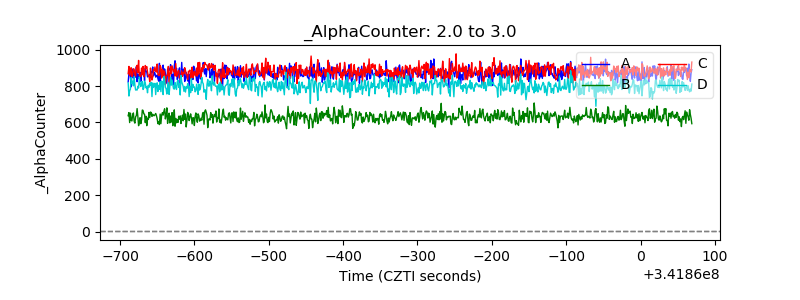 |
| _CPM_Rate | 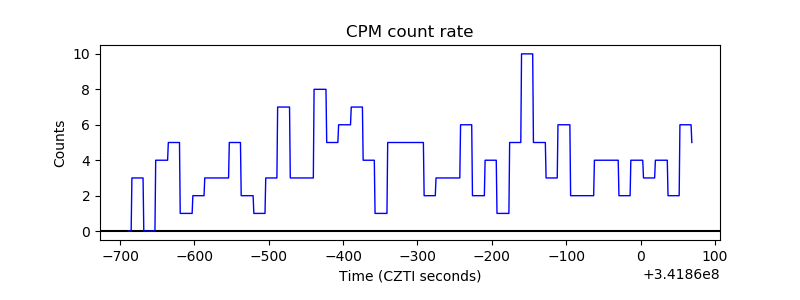 |
| CZT Counter | 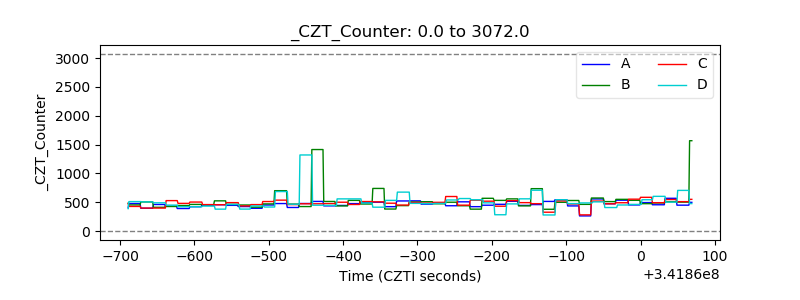 |
| +2.5 Volts monitor |  |
| +5 Volts monitor |  |
| _ROLL_ROT | 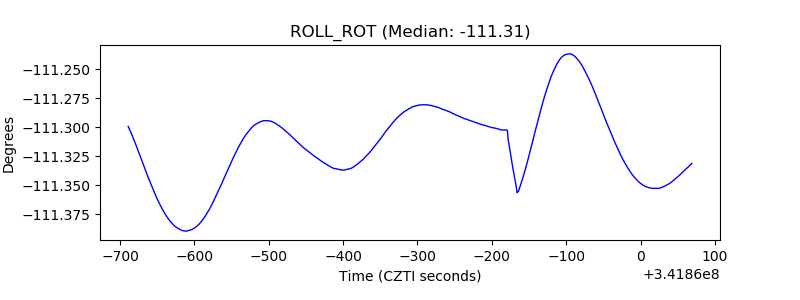 |
| _Roll_DEC | 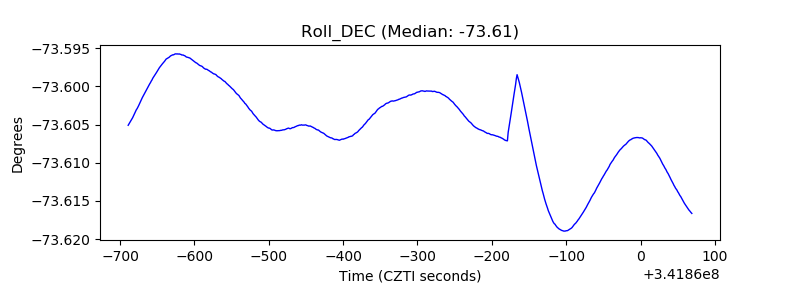 |
| _Roll_RA | 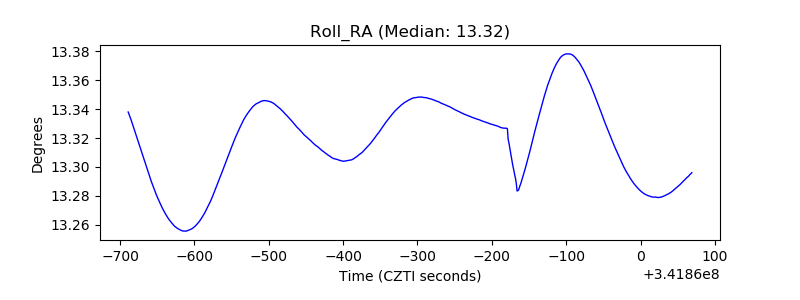 |
| Veto Counter | 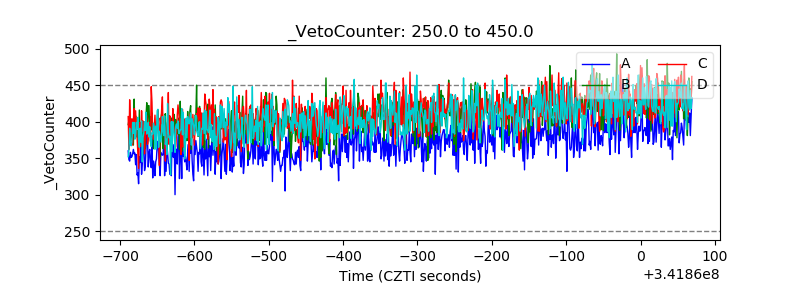 |