| Param | Original file | Final file |
|---|---|---|
| Filename | modeM0/AS1A09_038T25_9000003946cztM0_level2.fits | modeM0/AS1A09_038T25_9000003946cztM0_level2_quad_clean.evt |
| Size (bytes) | 38,678,400 | 48,539,520 |
| Size | 36.9 MB | 46.3 MB |
| Events in quadrant A | 233,768 | 313,778 |
| Events in quadrant B | 227,328 | 313,283 |
| Events in quadrant C | 227,396 | 292,579 |
| Events in quadrant D | 184,764 | 251,551 |
| Mode SS | |||
|---|---|---|---|
| Quadrant | BADHDUFLAG | Total packets | Discarded packets |
| A | 0 | 86 | 0 |
| B | 0 | 86 | 0 |
| C | 0 | 86 | 0 |
| D | 0 | 86 | 0 |
| Mode M0 | |||
|---|---|---|---|
| Quadrant | BADHDUFLAG | Total packets | Discarded packets |
| A | 0 | 8616 | 0 |
| B | 0 | 8873 | 0 |
| C | 0 | 8609 | 0 |
| D | 0 | 15625 | 0 |
| Mode M9 | |||
|---|---|---|---|
| Quadrant | BADHDUFLAG | Total packets | Discarded packets |
| A | 0 | 7 | 0 |
| B | 0 | 7 | 0 |
| C | 0 | 7 | 0 |
| D | 0 | 7 | 0 |
| Quadrant | Total seconds | Saturated seconds | Saturation percentage |
|---|---|---|---|
| A | 4233 | 28 | 0.661469% |
| B | 4233 | 42 | 0.992204% |
| C | 4233 | 36 | 0.850461% |
| D | 4233 | 603 | 14.245216% |
Noise dominated data is calculated using 1-second bins in cleaned event files. If a bin has >2000 counts, and if more than 50% of those come from <1% of pixels, then it is considered to be noise-dominated and hence unusable.
| Quadrant | # 1 sec bins | Bins with >0 counts | Bins with >2000 counts | High rate bins dominated by noise | Noise dominated (total time) | Noise dominated (detector-on time) | Marked lightcurve |
|---|---|---|---|---|---|---|---|
| A | 4973 | 4232 | 0 | 0 | 0.00% | 0.00% |  |
| B | 4973 | 4232 | 0 | 0 | 0.00% | 0.00% | 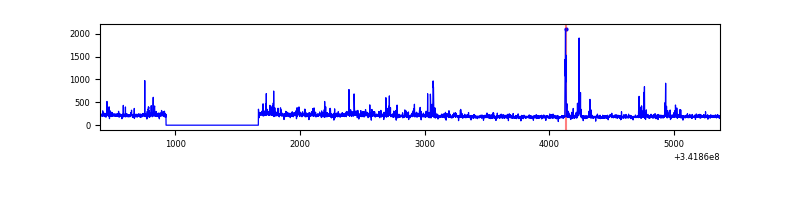 |
| C | 4973 | 4232 | 0 | 0 | 0.00% | 0.00% |  |
| D | 4972 | 4227 | 0 | 0 | 0.00% | 0.00% |  |
Top three noisy pixels from each quadrant. If the there are fewer than three noisy pixels in the level2.evt file, extra rows are filled as -1
| Pixel properties | Quadrant properties | ||||||
|---|---|---|---|---|---|---|---|
| Quadrant | DetID | PixID | Counts | Sigma | Mean | Median | Sigma |
| A | 14 | 188 | 270 | 12.76 | 60 | 57 | 16.7 |
| A | 0 | 29 | 263 | 12.34 | 60 | 57 | 16.7 |
| A | 14 | 204 | 241 | 11.03 | 60 | 57 | 16.7 |
| B | 2 | 9 | 179 | 8.64 | 60 | 57 | 14.1 |
| B | 14 | 254 | 161 | 7.36 | 60 | 57 | 14.1 |
| B | 5 | 225 | 156 | 7.01 | 60 | 57 | 14.1 |
| C | 3 | 234 | 176 | 6.9 | 60 | 56 | 17.4 |
| C | 9 | 209 | 165 | 6.26 | 60 | 56 | 17.4 |
| C | 3 | 202 | 161 | 6.04 | 60 | 56 | 17.4 |
| D | 10 | 113 | 142 | 5.96 | 52 | 47 | 15.9 |
| D | 3 | 14 | 140 | 5.84 | 52 | 47 | 15.9 |
| D | 4 | 12 | 138 | 5.71 | 52 | 47 | 15.9 |
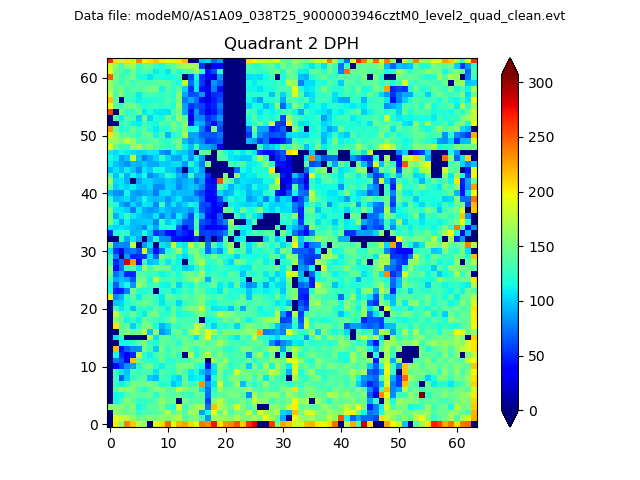
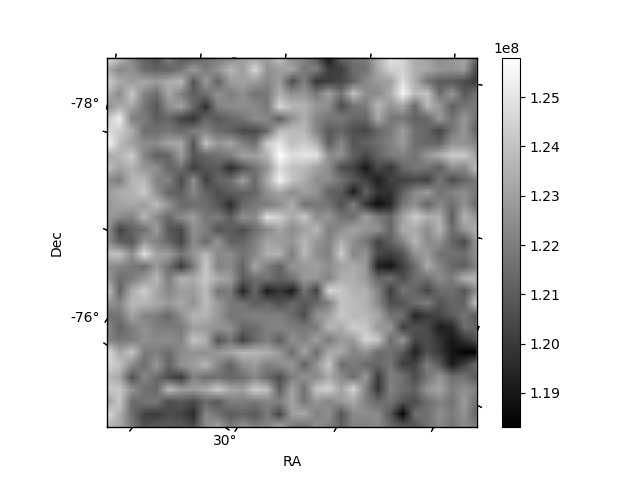
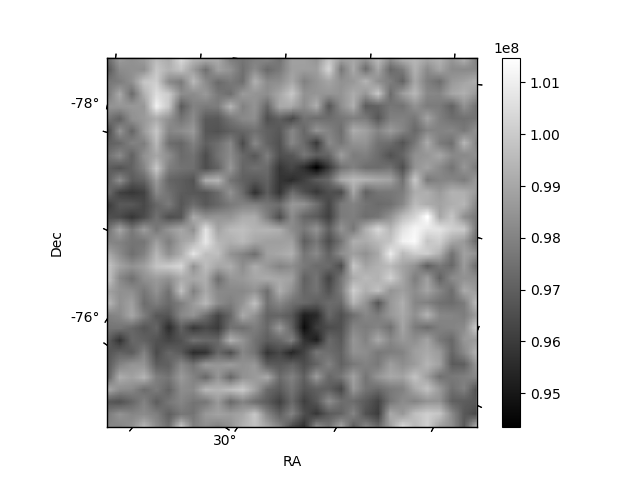
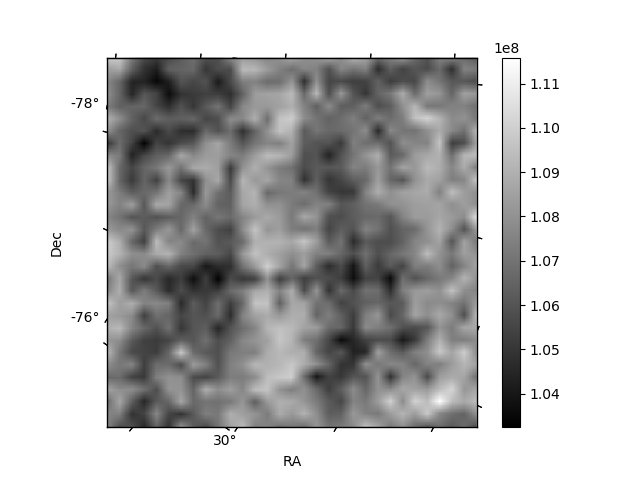
Histogram calculated using DETX and DETY for each event in the final _common_clean file
| Quadrant A | 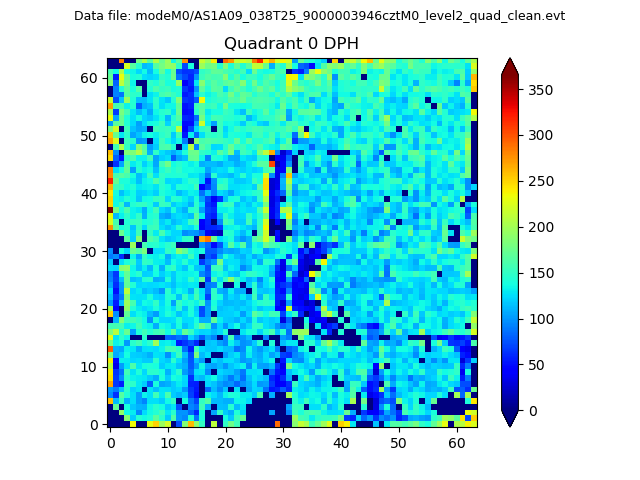 |
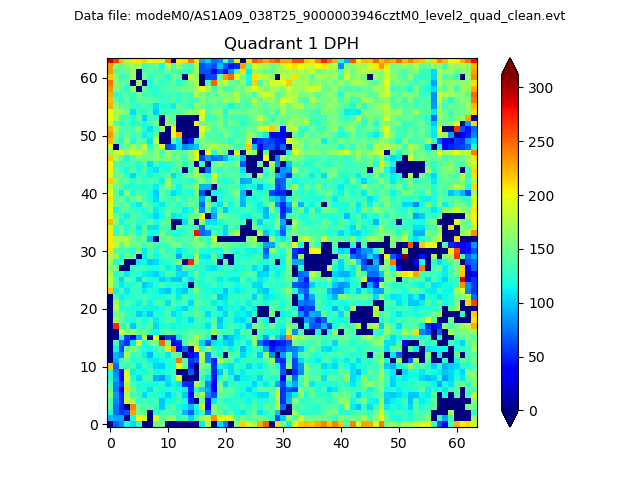 |
Quadrant B |
|---|---|---|---|
| Quadrant D | 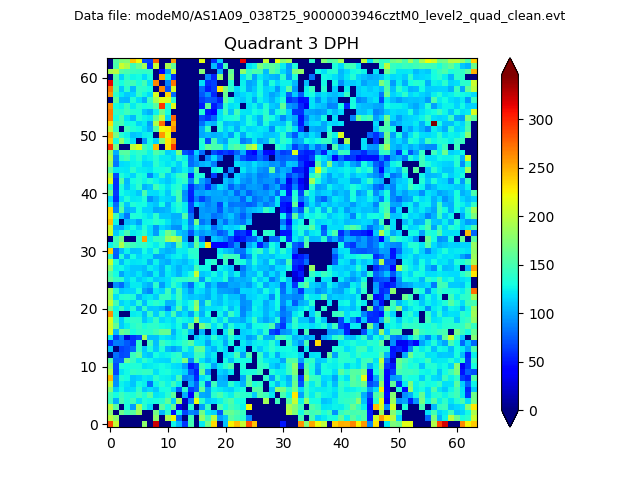 |
 |
Quadrant C |
| Plot type | Count rate plots | Images |
|---|---|---|
| Comparison with Poisson distribution Blue bars denote a histogram of data divided into 1 sec bins. Red curve is a Poisson curve with rate = median count rate of data. |
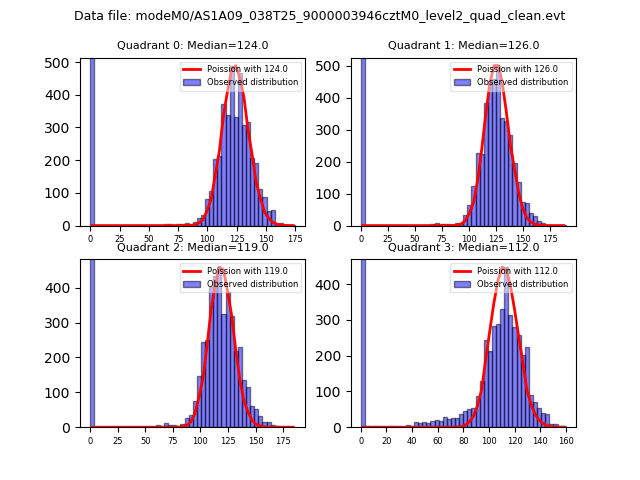 |
 |
| Quadrant-wise count rates Data is divided into 100 sec bins |
 |
|
| Module-wise count rates for Quadrant A Data is divided into 100 sec bins |
 |
 |
| Module-wise count rates for Quadrant B Data is divided into 100 sec bins |
 |
 |
| Module-wise count rates for Quadrant C Data is divided into 100 sec bins |
 |
 |
| Module-wise count rates for Quadrant D Data is divided into 100 sec bins |
 |
 |
| Parameter | Plot |
|---|---|
| CZT HV Monitor |  |
| D_VDD |  |
| Temperature 1 |  |
| Veto HV Monitor |  |
| Veto LLD |  |
| Alpha Counter |  |
| _CPM_Rate | 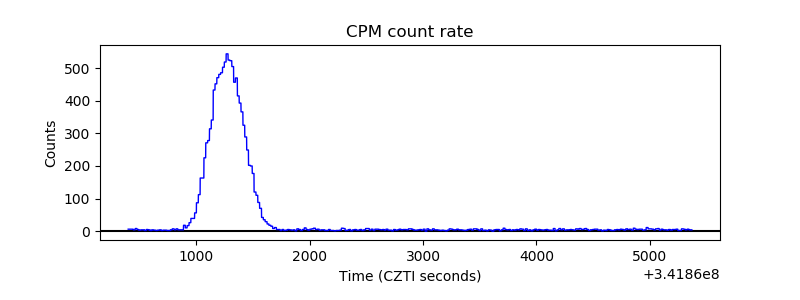 |
| CZT Counter | 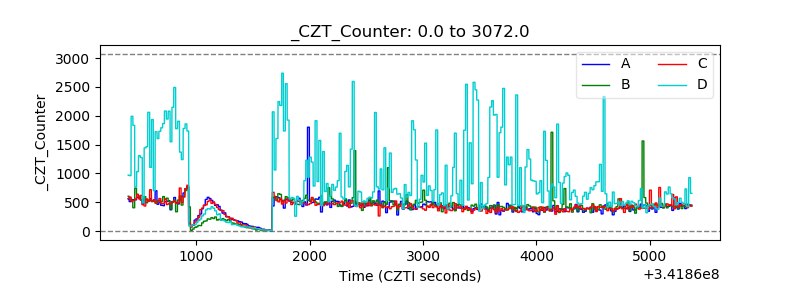 |
| +2.5 Volts monitor |  |
| +5 Volts monitor |  |
| _ROLL_ROT |  |
| _Roll_DEC |  |
| _Roll_RA |  |
| Veto Counter |  |