| Param | Original file | Final file |
|---|---|---|
| Filename | modeM0/AS1A09_038T25_9000003946_27540cztM0_level2.evt | modeM0/AS1A09_038T25_9000003946_27540cztM0_level2_quad_clean.evt |
| Size (bytes) | 342,627,840 | 73,575,360 |
| Size | 326.8 MB | 70.2 MB |
| Events in quadrant A | 1,888,846 | 499,334 |
| Events in quadrant B | 2,026,721 | 507,394 |
| Events in quadrant C | 1,896,951 | 481,236 |
| Events in quadrant D | 4,275,538 | 441,794 |
| Mode M0 | |||
|---|---|---|---|
| Quadrant | BADHDUFLAG | Total packets | Discarded packets |
| A | 0 | 8616 | 0 |
| B | 0 | 8873 | 0 |
| C | 0 | 8609 | 0 |
| D | 0 | 15625 | 0 |
| Mode M9 | |||
|---|---|---|---|
| Quadrant | BADHDUFLAG | Total packets | Discarded packets |
| A | 0 | 7 | 0 |
| B | 0 | 7 | 0 |
| C | 0 | 7 | 0 |
| D | 0 | 7 | 0 |
| Quadrant | Total seconds | Saturated seconds | Saturation percentage |
|---|---|---|---|
| A | 4233 | 28 | 0.661469% |
| B | 4233 | 42 | 0.992204% |
| C | 4233 | 36 | 0.850461% |
| D | 4233 | 603 | 14.245216% |
Noise dominated data is calculated using 1-second bins in cleaned event files. If a bin has >2000 counts, and if more than 50% of those come from <1% of pixels, then it is considered to be noise-dominated and hence unusable.
| Quadrant | # 1 sec bins | Bins with >0 counts | Bins with >2000 counts | High rate bins dominated by noise | Noise dominated (total time) | Noise dominated (detector-on time) | Marked lightcurve |
|---|---|---|---|---|---|---|---|
| A | 4973 | 4233 | 0 | 0 | 0.00% | 0.00% | 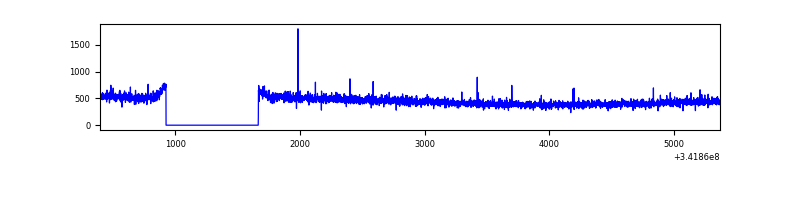 |
| B | 4973 | 4233 | 3 | 3 | 0.06% | 0.07% | 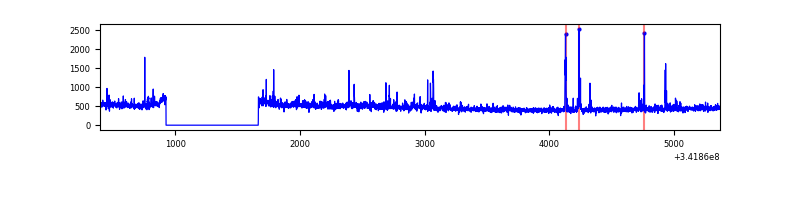 |
| C | 4973 | 4233 | 0 | 0 | 0.00% | 0.00% | 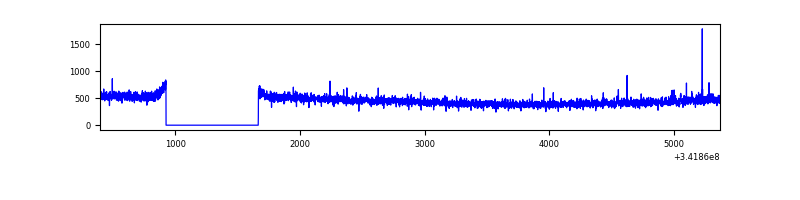 |
| D | 4973 | 4233 | 455 | 455 | 9.15% | 10.75% | 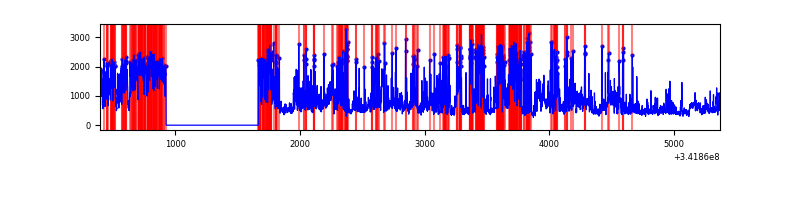 |
Top three noisy pixels from each quadrant. If the there are fewer than three noisy pixels in the level2.evt file, extra rows are filled as -1
| Pixel properties | Quadrant properties | ||||||
|---|---|---|---|---|---|---|---|
| Quadrant | DetID | PixID | Counts | Sigma | Mean | Median | Sigma |
| A | 13 | 254 | 7462 | 69.96 | 487 | 476 | 99.9 |
| A | 3 | 137 | 4838 | 43.68 | 487 | 476 | 99.9 |
| A | 0 | 226 | 4175 | 37.04 | 487 | 476 | 99.9 |
| B | 10 | 245 | 45336 | 477.22 | 487 | 474 | 94.0 |
| B | 0 | 230 | 31713 | 332.3 | 487 | 474 | 94.0 |
| B | 15 | 32 | 14083 | 144.77 | 487 | 474 | 94.0 |
| C | 14 | 238 | 75506 | 677.45 | 464 | 465 | 110.8 |
| C | 7 | 221 | 10547 | 91.02 | 464 | 465 | 110.8 |
| C | 2 | 16 | 3841 | 30.48 | 464 | 465 | 110.8 |
| D | 1 | 52 | 2470303 | 23184.02 | 442 | 428 | 106.5 |
| D | 7 | 80 | 53572 | 498.85 | 442 | 428 | 106.5 |
| D | 2 | 250 | 40864 | 379.56 | 442 | 428 | 106.5 |
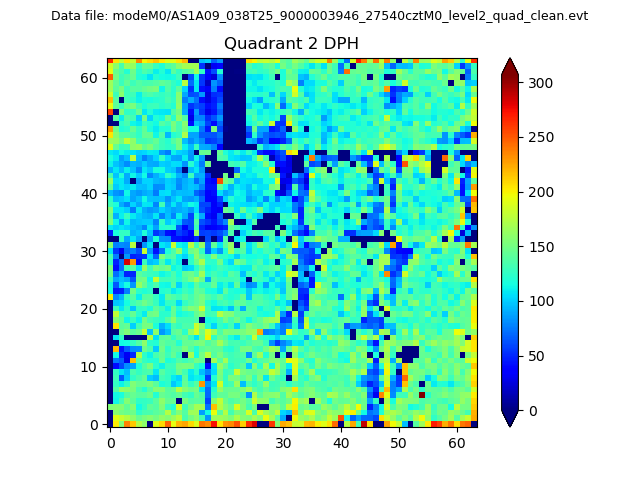
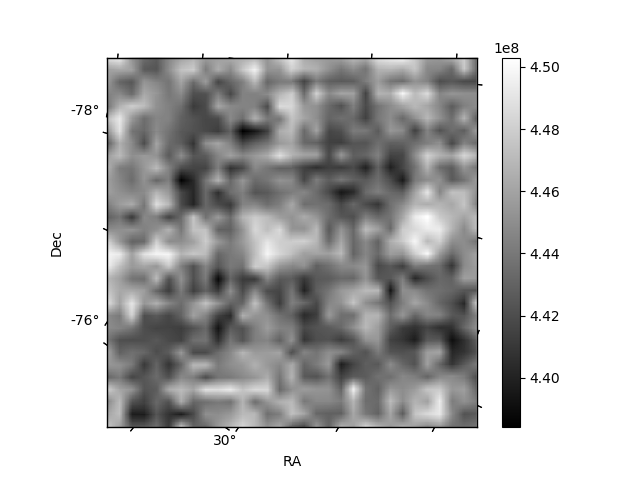
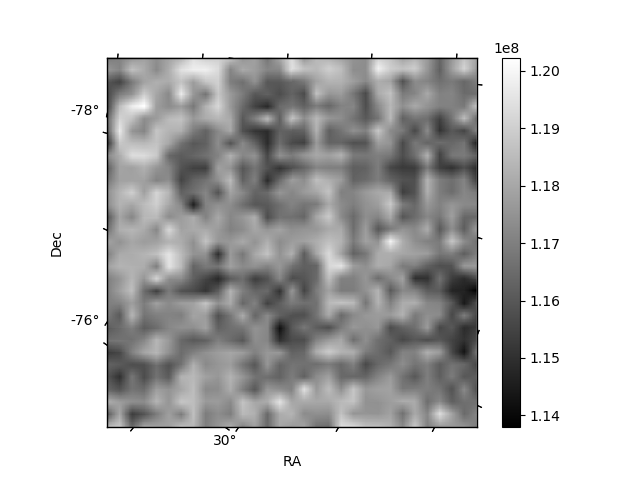
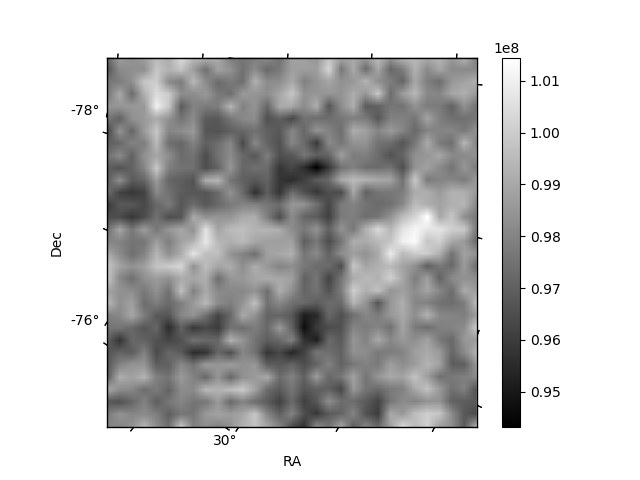
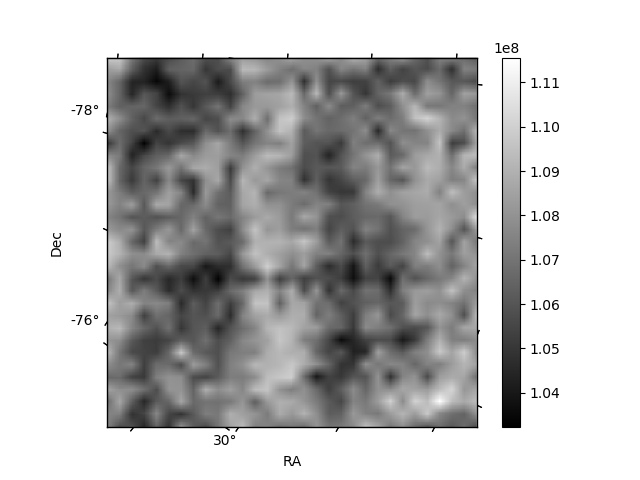
Histogram calculated using DETX and DETY for each event in the final _common_clean file
| Quadrant A | 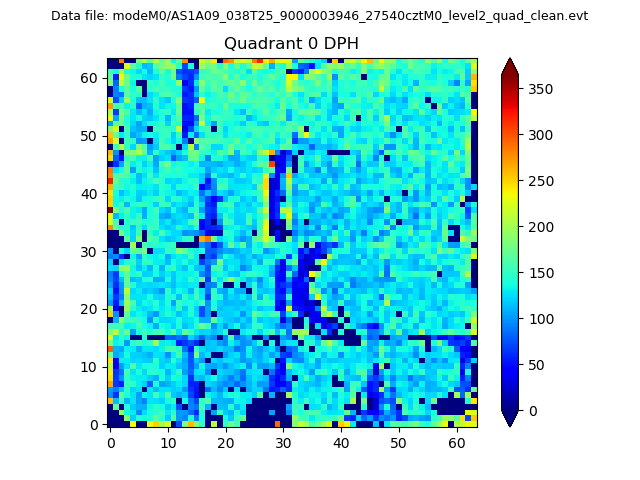 |
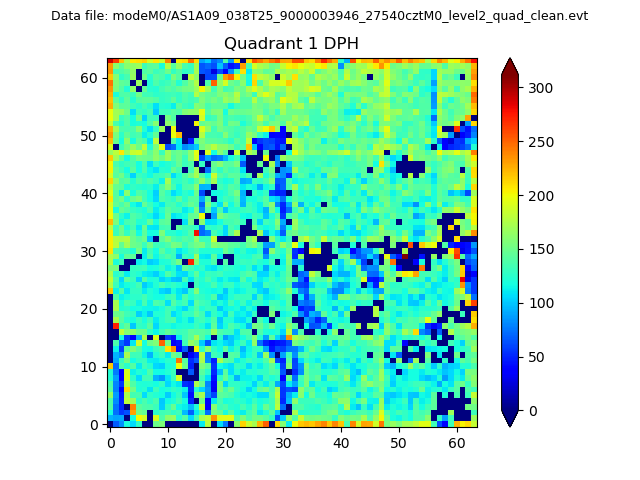 |
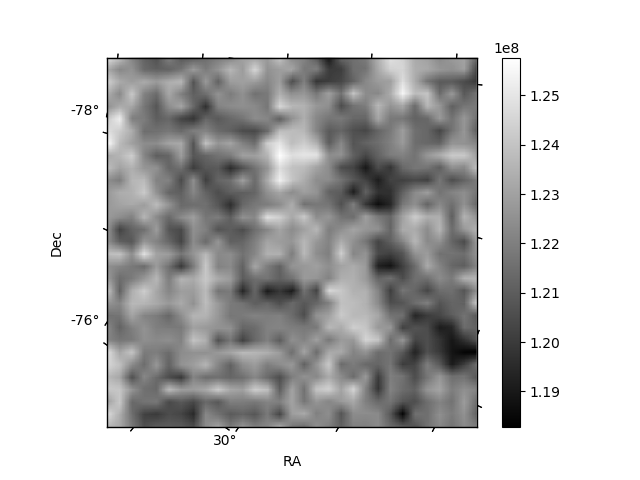
Quadrant B |
|---|---|---|---|
| Quadrant D | 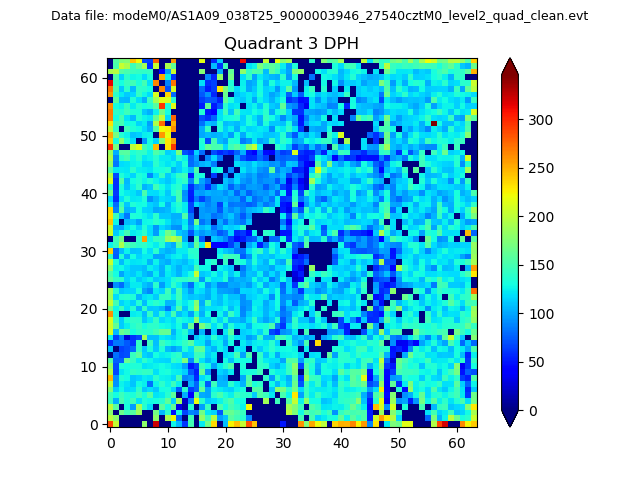 |
 |
Quadrant C |
| Plot type | Count rate plots | Images |
|---|---|---|
| Comparison with Poisson distribution Blue bars denote a histogram of data divided into 1 sec bins. Red curve is a Poisson curve with rate = median count rate of data. |
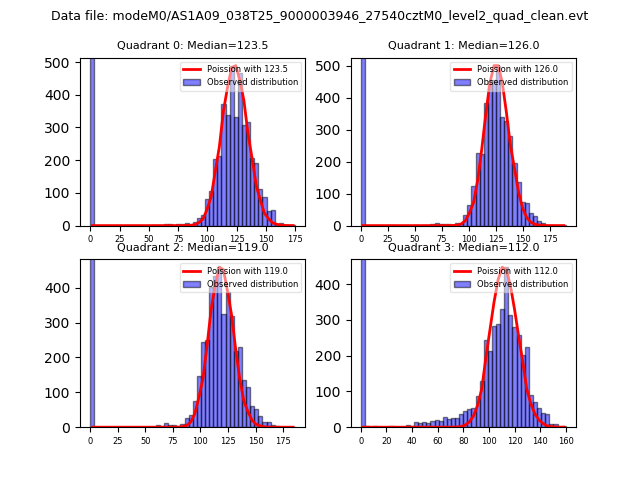 |
 |
| Quadrant-wise count rates Data is divided into 100 sec bins |
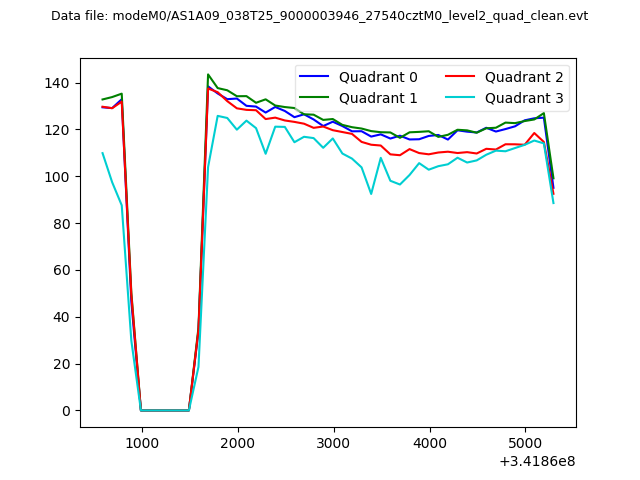 |
|
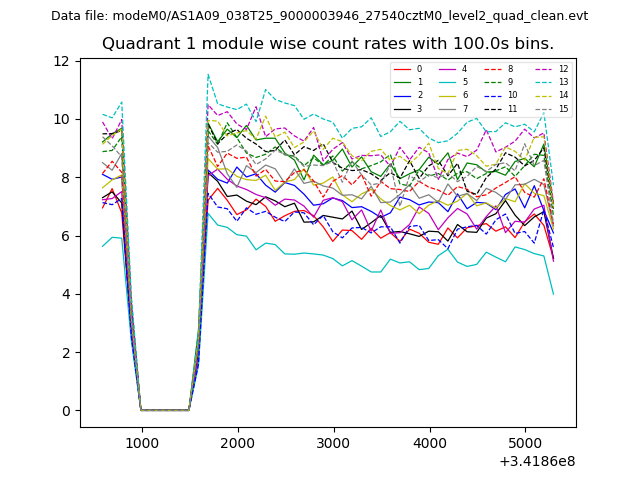
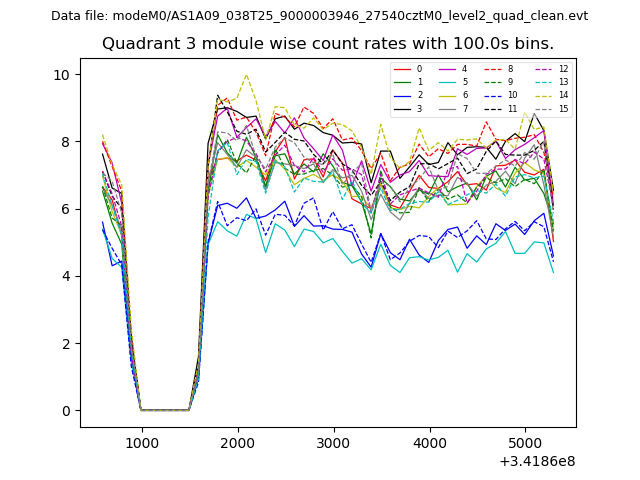
| Module-wise count rates for Quadrant A Data is divided into 100 sec bins |
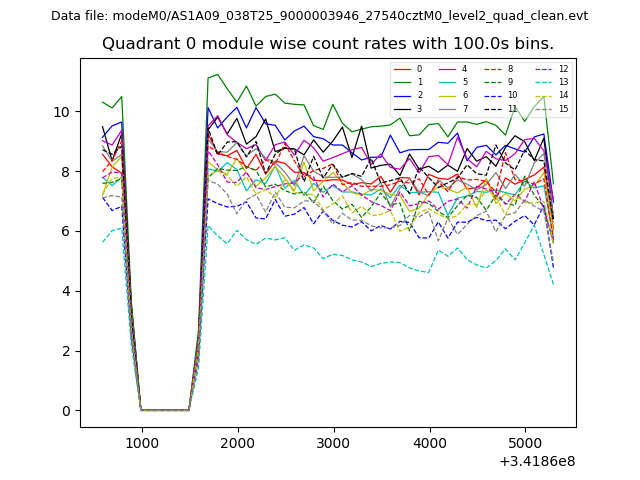 |
 |
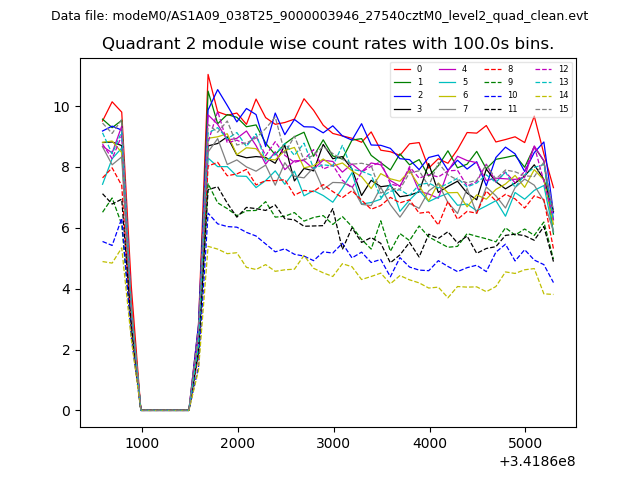
| Module-wise count rates for Quadrant B Data is divided into 100 sec bins |
 |
 |
| Module-wise count rates for Quadrant C Data is divided into 100 sec bins |
 |
 |
| Module-wise count rates for Quadrant D Data is divided into 100 sec bins |
 |
 |
| Parameter | Plot |
|---|---|
| CZT HV Monitor | 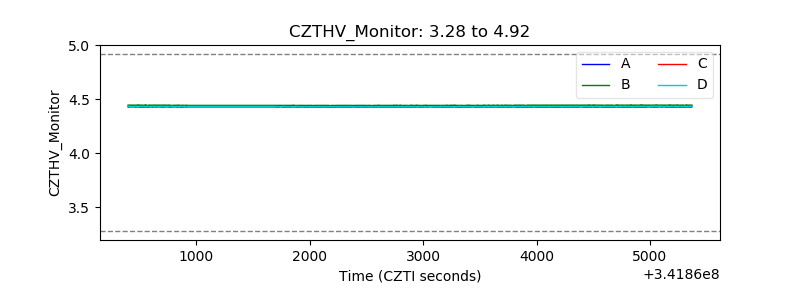 |
| D_VDD | 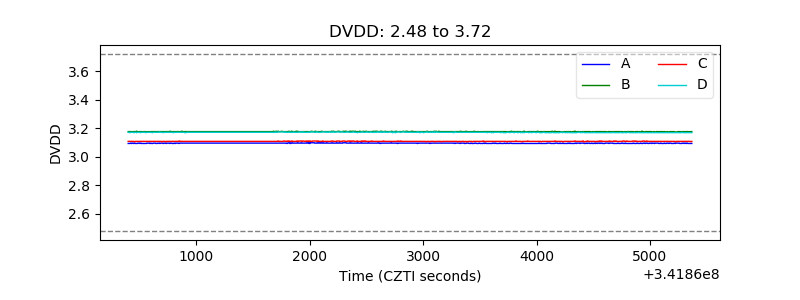 |
| Temperature 1 | 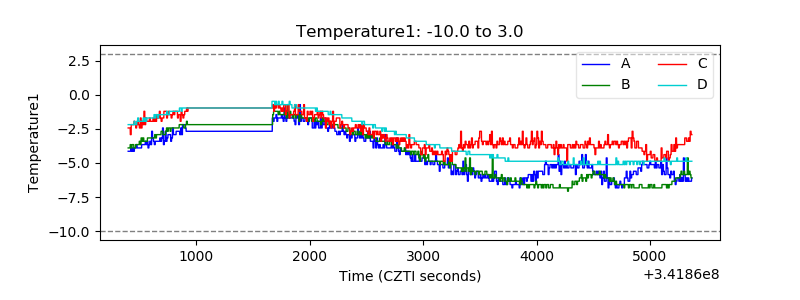 |
| Veto HV Monitor | 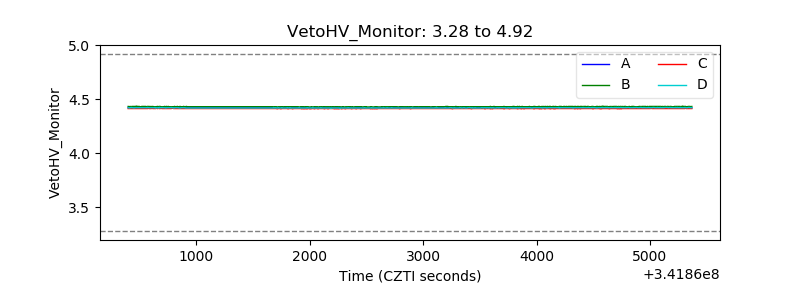 |
| Veto LLD | 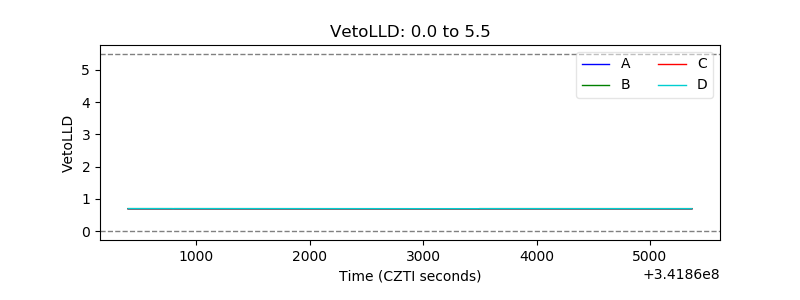 |
| Alpha Counter | 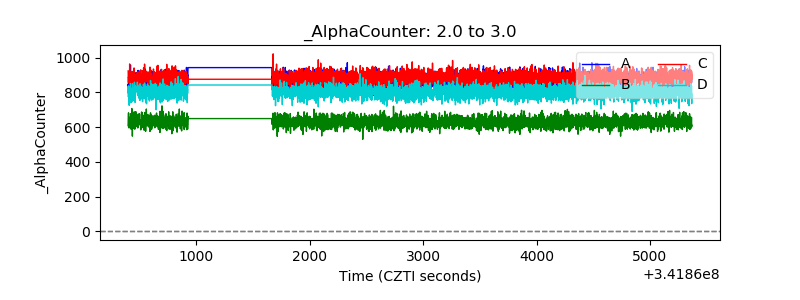 |
| _CPM_Rate | 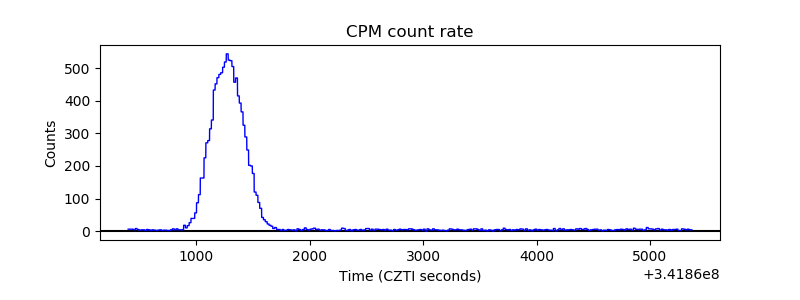 |
| CZT Counter | 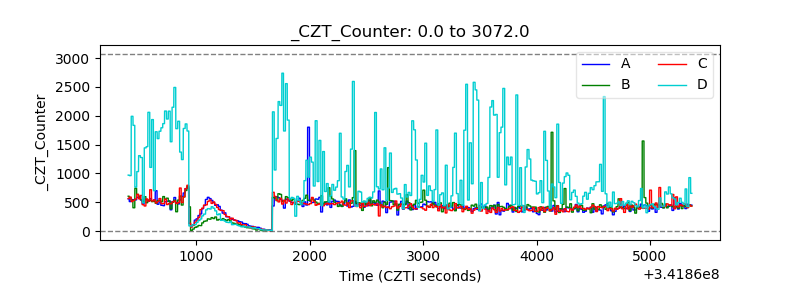 |
| +2.5 Volts monitor |  |
| +5 Volts monitor |  |
| _ROLL_ROT | 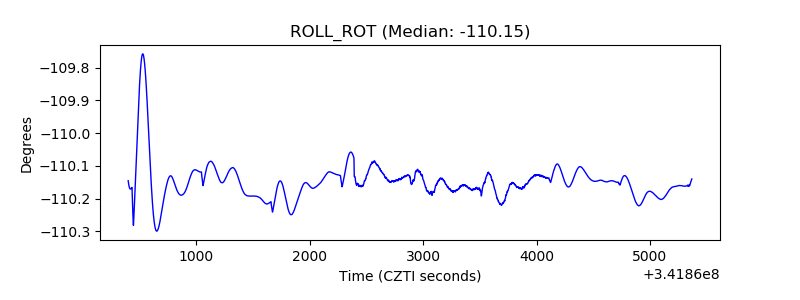 |
| _Roll_DEC | 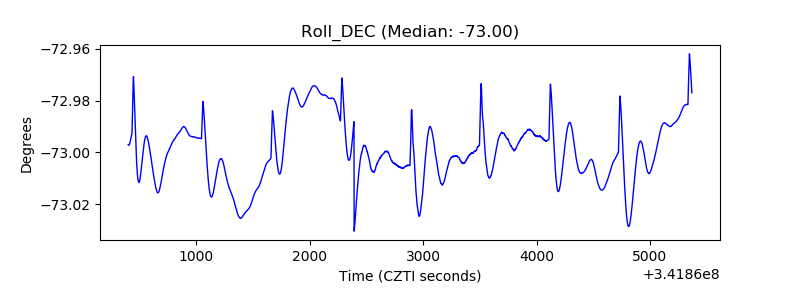 |
| _Roll_RA | 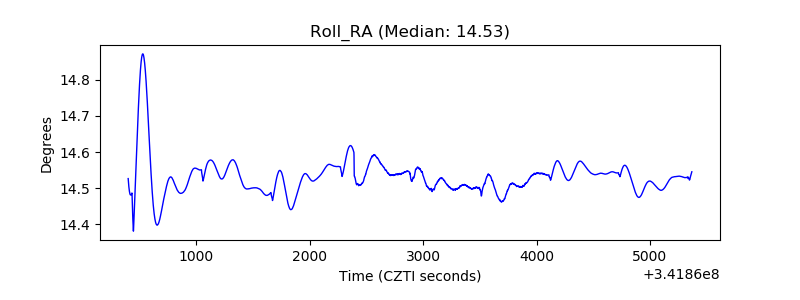 |
| Veto Counter | 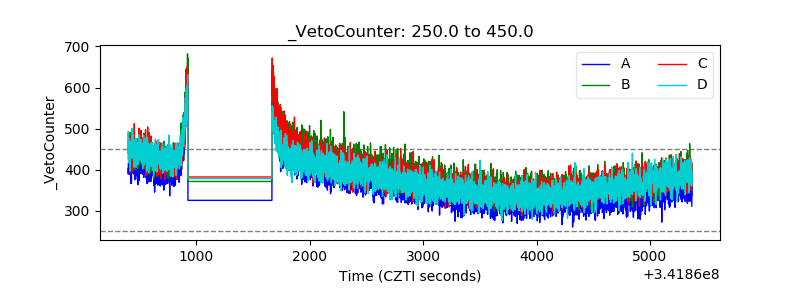 |