| Param | Original file | Final file |
|---|---|---|
| Filename | modeM0/AS1A09_038T26_9000003948cztM0_level2.fits | modeM0/AS1A09_038T26_9000003948cztM0_level2_quad_clean.evt |
| Size (bytes) | 30,107,520 | 23,400,000 |
| Size | 28.7 MB | 22.3 MB |
| Events in quadrant A | 185,970 | 129,821 |
| Events in quadrant B | 178,350 | 129,942 |
| Events in quadrant C | 177,272 | 120,750 |
| Events in quadrant D | 153,396 | 110,216 |
| Mode M0 | |||
|---|---|---|---|
| Quadrant | BADHDUFLAG | Total packets | Discarded packets |
| A | 0 | 6300 | 0 |
| B | 0 | 6598 | 0 |
| C | 0 | 7464 | 0 |
| D | 0 | 9192 | 0 |
| Mode SS | |||
|---|---|---|---|
| Quadrant | BADHDUFLAG | Total packets | Discarded packets |
| A | 0 | 60 | 0 |
| B | 0 | 60 | 0 |
| C | 0 | 60 | 0 |
| D | 0 | 60 | 0 |
| Mode M9 | |||
|---|---|---|---|
| Quadrant | BADHDUFLAG | Total packets | Discarded packets |
| A | 0 | 10 | 0 |
| B | 0 | 10 | 0 |
| C | 0 | 10 | 0 |
| D | 0 | 10 | 0 |
| Quadrant | Total seconds | Saturated seconds | Saturation percentage |
|---|---|---|---|
| A | 3056 | 20 | 0.654450% |
| B | 3056 | 39 | 1.276178% |
| C | 3056 | 93 | 3.043194% |
| D | 3056 | 238 | 7.787958% |
Noise dominated data is calculated using 1-second bins in cleaned event files. If a bin has >2000 counts, and if more than 50% of those come from <1% of pixels, then it is considered to be noise-dominated and hence unusable.
| Quadrant | # 1 sec bins | Bins with >0 counts | Bins with >2000 counts | High rate bins dominated by noise | Noise dominated (total time) | Noise dominated (detector-on time) | Marked lightcurve |
|---|---|---|---|---|---|---|---|
| A | 3981 | 3055 | 0 | 0 | 0.00% | 0.00% | 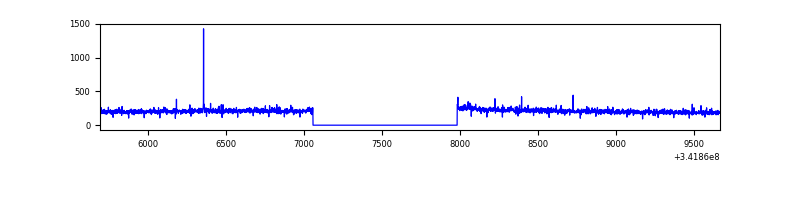 |
| B | 3981 | 3055 | 0 | 0 | 0.00% | 0.00% |  |
| C | 3980 | 3054 | 0 | 0 | 0.00% | 0.00% |  |
| D | 3980 | 3053 | 0 | 0 | 0.00% | 0.00% | 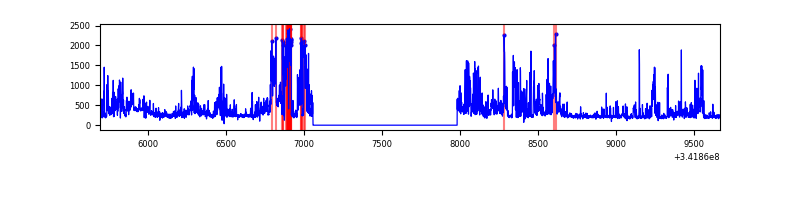 |
Top three noisy pixels from each quadrant. If the there are fewer than three noisy pixels in the level2.evt file, extra rows are filled as -1
| Pixel properties | Quadrant properties | ||||||
|---|---|---|---|---|---|---|---|
| Quadrant | DetID | PixID | Counts | Sigma | Mean | Median | Sigma |
| A | 0 | 29 | 207 | 11.57 | 48 | 46 | 13.9 |
| A | 0 | 30 | 164 | 8.48 | 48 | 46 | 13.9 |
| A | 9 | 19 | 148 | 7.33 | 48 | 46 | 13.9 |
| B | 5 | 128 | 133 | 7.63 | 47 | 44 | 11.7 |
| B | 14 | 254 | 130 | 7.37 | 47 | 44 | 11.7 |
| B | 2 | 9 | 127 | 7.11 | 47 | 44 | 11.7 |
| C | 3 | 202 | 134 | 6.68 | 46 | 44 | 13.5 |
| C | 3 | 203 | 132 | 6.53 | 46 | 44 | 13.5 |
| C | 9 | 209 | 125 | 6.01 | 46 | 44 | 13.5 |
| D | 4 | 160 | 126 | 6.73 | 43 | 39 | 12.9 |
| D | 3 | 14 | 119 | 6.19 | 43 | 39 | 12.9 |
| D | 1 | 31 | 115 | 5.88 | 43 | 39 | 12.9 |
Histogram calculated using DETX and DETY for each event in the final _common_clean file
| Quadrant A |  |
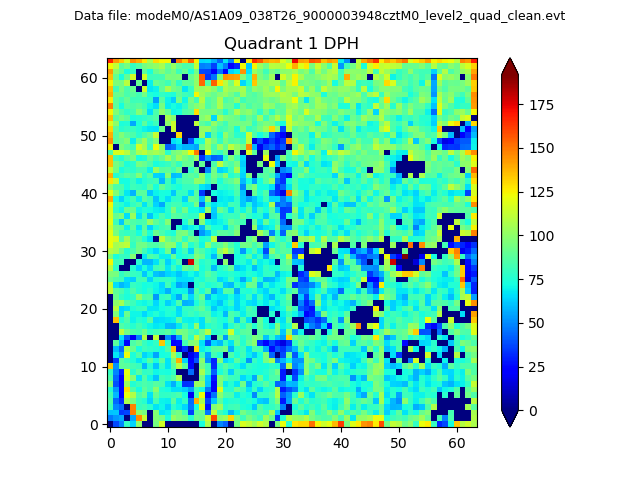 |
Quadrant B |
|---|---|---|---|
| Quadrant D | 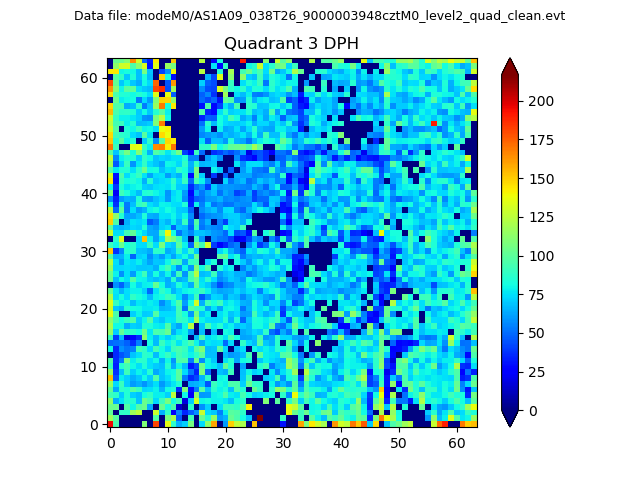 |
 |
Quadrant C |
| Plot type | Count rate plots | Images |
|---|---|---|
| Comparison with Poisson distribution Blue bars denote a histogram of data divided into 1 sec bins. Red curve is a Poisson curve with rate = median count rate of data. |
 |
 |
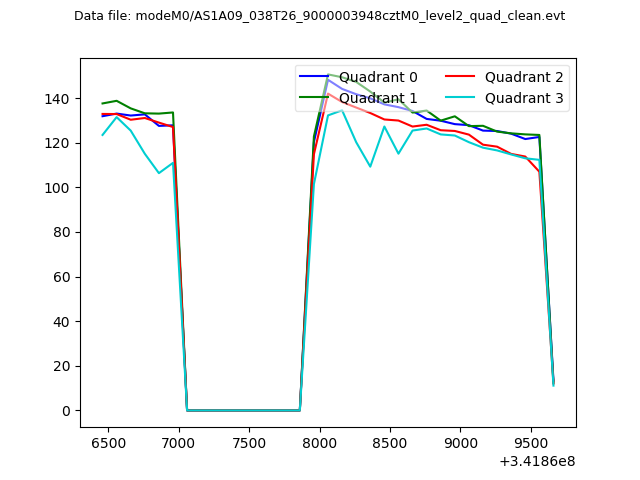
| Quadrant-wise count rates Data is divided into 100 sec bins |
 |
|
| Module-wise count rates for Quadrant A Data is divided into 100 sec bins |
 |
 |
| Module-wise count rates for Quadrant B Data is divided into 100 sec bins |
 |
 |
| Module-wise count rates for Quadrant C Data is divided into 100 sec bins |
 |
 |
| Module-wise count rates for Quadrant D Data is divided into 100 sec bins |
 |
 |
| Parameter | Plot |
|---|---|
| CZT HV Monitor |  |
| D_VDD |  |
| Temperature 1 |  |
| Veto HV Monitor |  |
| Veto LLD |  |
| Alpha Counter |  |
| _CPM_Rate |  |
| CZT Counter |  |
| +2.5 Volts monitor | 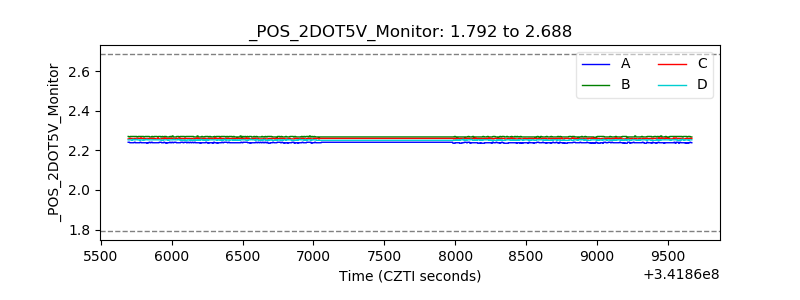 |
| +5 Volts monitor |  |
| _ROLL_ROT |  |
| _Roll_DEC |  |
| _Roll_RA |  |
| Veto Counter |  |