| Param | Original file | Final file |
|---|---|---|
| Filename | modeM0/AS1A09_038T26_9000003948_27540cztM0_level2.evt | modeM0/AS1A09_038T26_9000003948_27540cztM0_level2_quad_clean.evt |
| Size (bytes) | 223,392,960 | 39,991,680 |
| Size | 213.0 MB | 38.1 MB |
| Events in quadrant A | 1,356,008 | 261,421 |
| Events in quadrant B | 1,446,236 | 266,438 |
| Events in quadrant C | 1,589,069 | 253,089 |
| Events in quadrant D | 2,188,669 | 236,179 |
| Mode M0 | |||
|---|---|---|---|
| Quadrant | BADHDUFLAG | Total packets | Discarded packets |
| A | 0 | 5611 | 0 |
| B | 0 | 5879 | 0 |
| C | 0 | 6394 | 0 |
| D | 0 | 8362 | 0 |
| Mode M9 | |||
|---|---|---|---|
| Quadrant | BADHDUFLAG | Total packets | Discarded packets |
| A | 0 | 10 | 0 |
| B | 0 | 10 | 0 |
| C | 0 | 10 | 0 |
| D | 0 | 10 | 0 |
| Quadrant | Total seconds | Saturated seconds | Saturation percentage |
|---|---|---|---|
| A | 2711 | 20 | 0.737735% |
| B | 2711 | 38 | 1.401697% |
| C | 2710 | 79 | 2.915129% |
| D | 2710 | 233 | 8.597786% |
Noise dominated data is calculated using 1-second bins in cleaned event files. If a bin has >2000 counts, and if more than 50% of those come from <1% of pixels, then it is considered to be noise-dominated and hence unusable.
| Quadrant | # 1 sec bins | Bins with >0 counts | Bins with >2000 counts | High rate bins dominated by noise | Noise dominated (total time) | Noise dominated (detector-on time) | Marked lightcurve |
|---|---|---|---|---|---|---|---|
| A | 3636 | 2711 | 0 | 0 | 0.00% | 0.00% |  |
| B | 3636 | 2711 | 2 | 2 | 0.06% | 0.07% |  |
| C | 3635 | 2710 | 13 | 13 | 0.36% | 0.48% |  |
| D | 3635 | 2711 | 184 | 184 | 5.06% | 6.79% |  |
Top three noisy pixels from each quadrant. If the there are fewer than three noisy pixels in the level2.evt file, extra rows are filled as -1
| Pixel properties | Quadrant properties | ||||||
|---|---|---|---|---|---|---|---|
| Quadrant | DetID | PixID | Counts | Sigma | Mean | Median | Sigma |
| A | 13 | 254 | 4852 | 62.82 | 350 | 342 | 71.8 |
| A | 3 | 137 | 3541 | 44.56 | 350 | 342 | 71.8 |
| A | 0 | 226 | 2954 | 36.38 | 350 | 342 | 71.8 |
| B | 0 | 230 | 27175 | 389.62 | 348 | 340 | 68.9 |
| B | 10 | 245 | 23406 | 334.9 | 348 | 340 | 68.9 |
| B | 0 | 244 | 13167 | 186.24 | 348 | 340 | 68.9 |
| C | 7 | 221 | 233135 | 2923.44 | 331 | 331 | 79.6 |
| C | 14 | 238 | 53170 | 663.53 | 331 | 331 | 79.6 |
| C | 2 | 16 | 10964 | 133.52 | 331 | 331 | 79.6 |
| D | 1 | 52 | 881920 | 11119.29 | 326 | 315 | 79.3 |
| D | 2 | 250 | 41919 | 524.73 | 326 | 315 | 79.3 |
| D | 7 | 80 | 23232 | 289.04 | 326 | 315 | 79.3 |
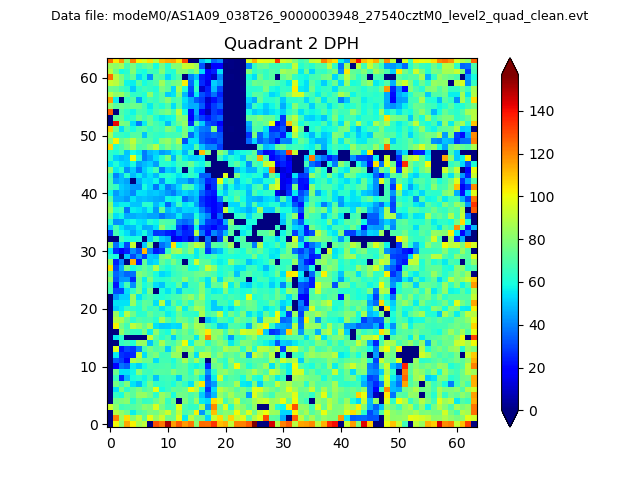
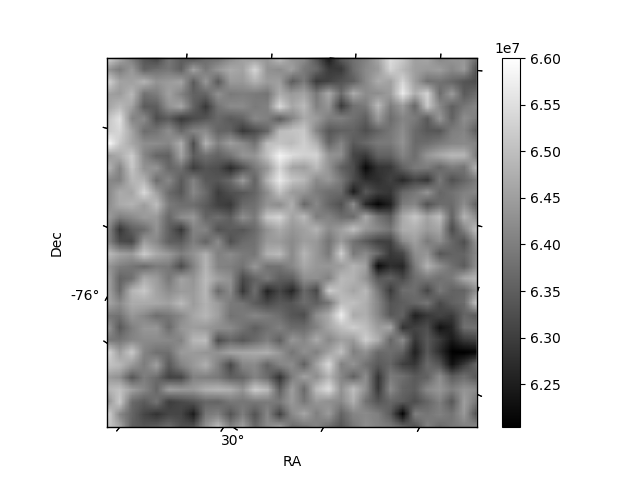
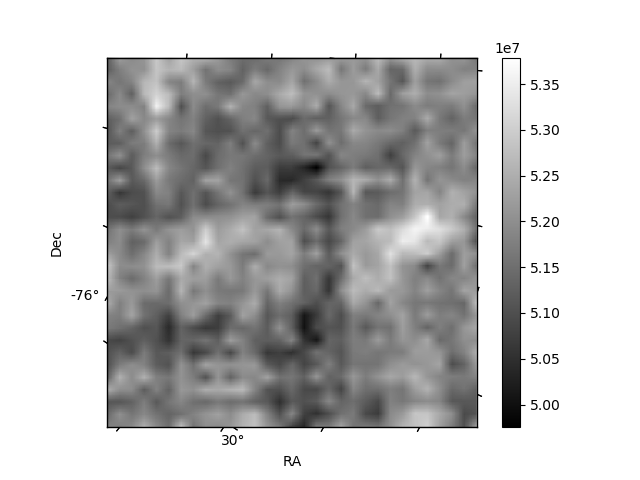
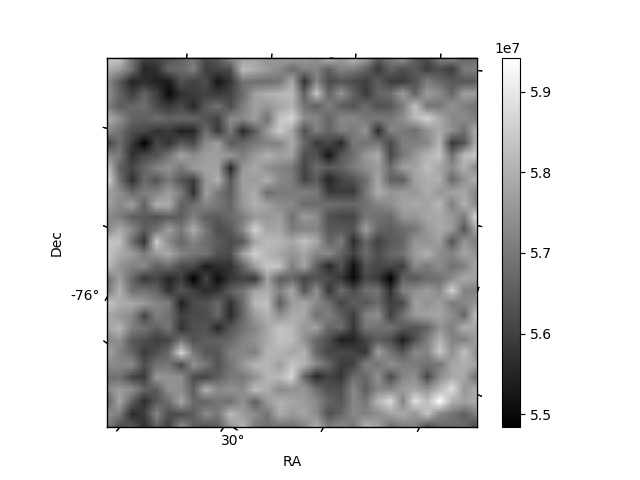
Histogram calculated using DETX and DETY for each event in the final _common_clean file
| Quadrant A | 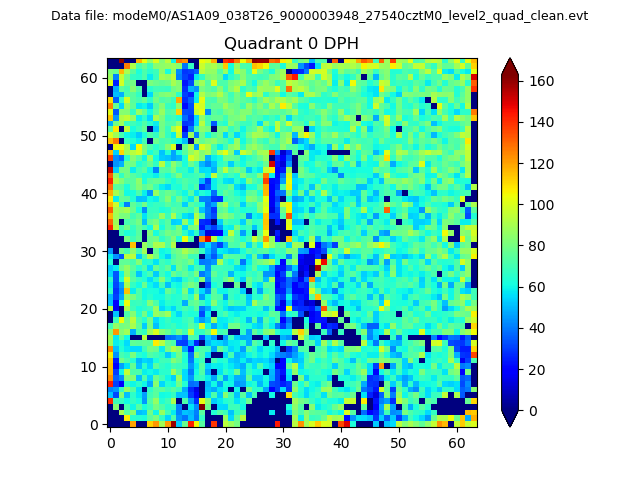 |
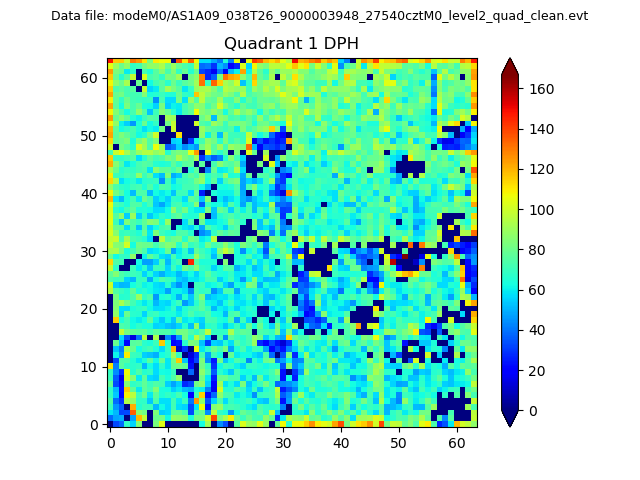 |
Quadrant B |
|---|---|---|---|
| Quadrant D | 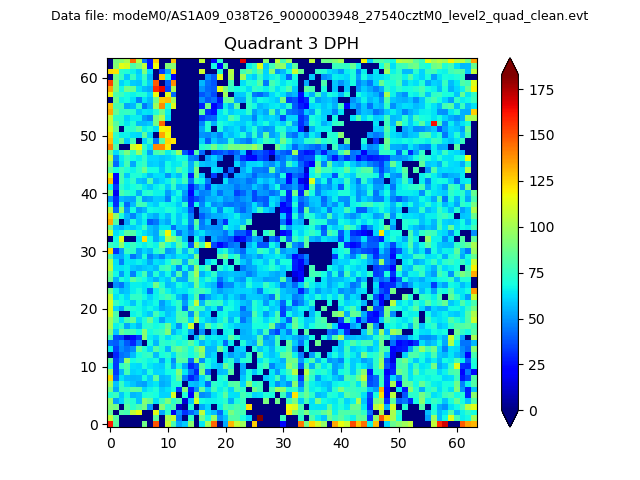 |
 |
Quadrant C |
| Plot type | Count rate plots | Images |
|---|---|---|
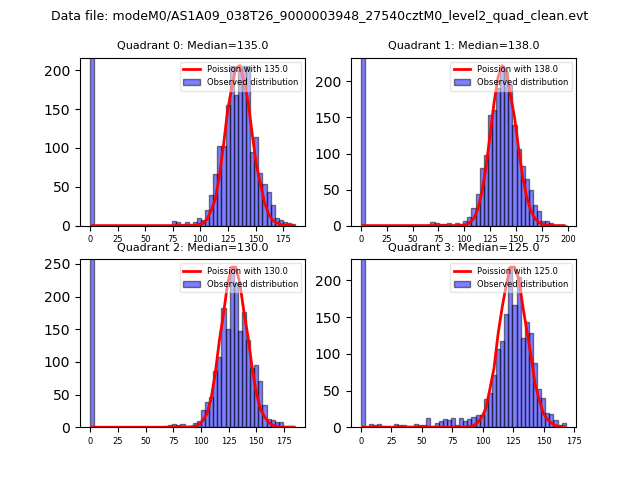
| Comparison with Poisson distribution Blue bars denote a histogram of data divided into 1 sec bins. Red curve is a Poisson curve with rate = median count rate of data. |
 |
 |
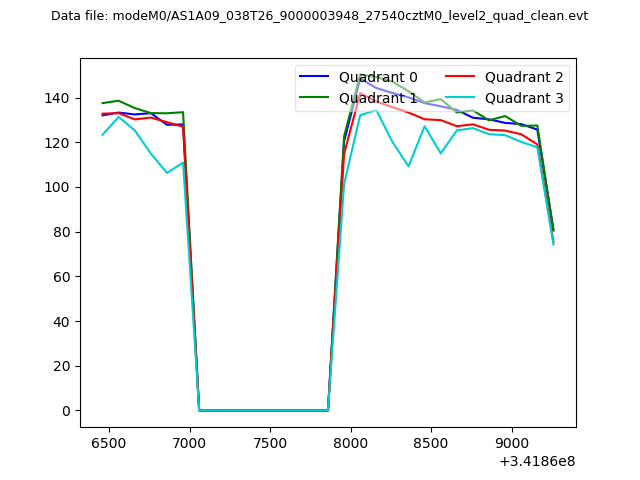
| Quadrant-wise count rates Data is divided into 100 sec bins |
 |
|
| Module-wise count rates for Quadrant A Data is divided into 100 sec bins |
 |
 |
| Module-wise count rates for Quadrant B Data is divided into 100 sec bins |
 |
 |
| Module-wise count rates for Quadrant C Data is divided into 100 sec bins |
 |
 |
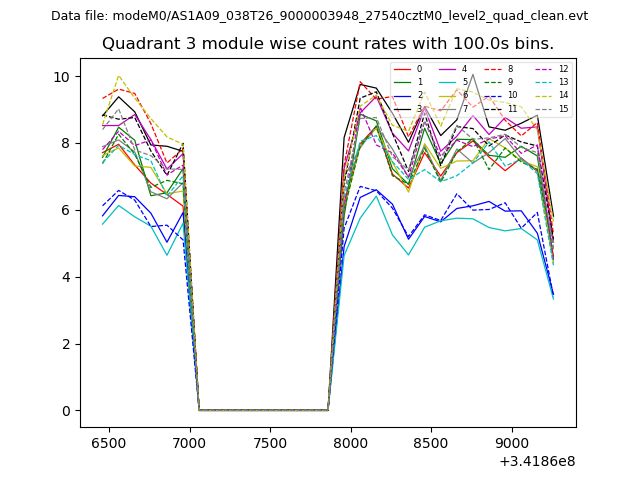
| Module-wise count rates for Quadrant D Data is divided into 100 sec bins |
 |
 |
| Parameter | Plot |
|---|---|
| CZT HV Monitor |  |
| D_VDD | 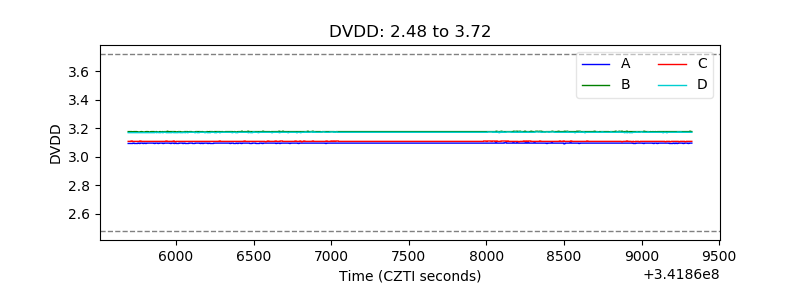 |
| Temperature 1 | 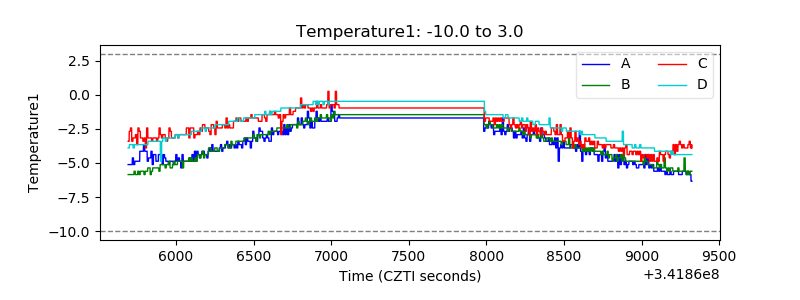 |
| Veto HV Monitor | 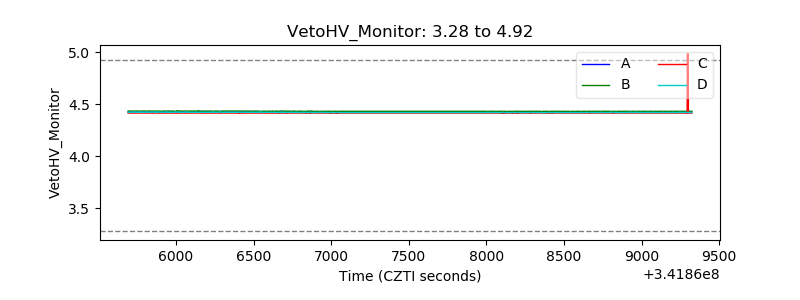 |
| Veto LLD | 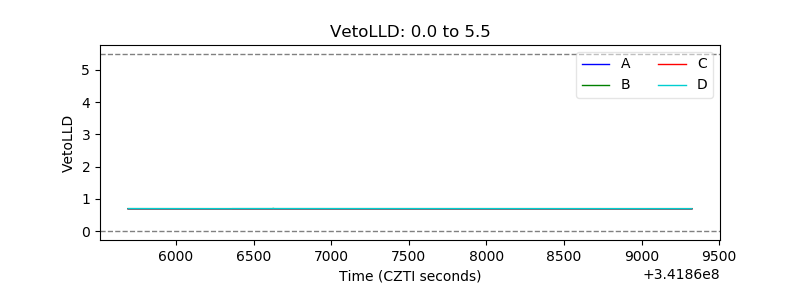 |
| Alpha Counter |  |
| _CPM_Rate | 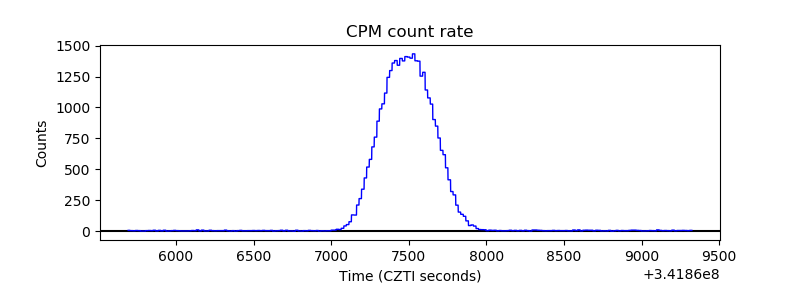 |
| CZT Counter | 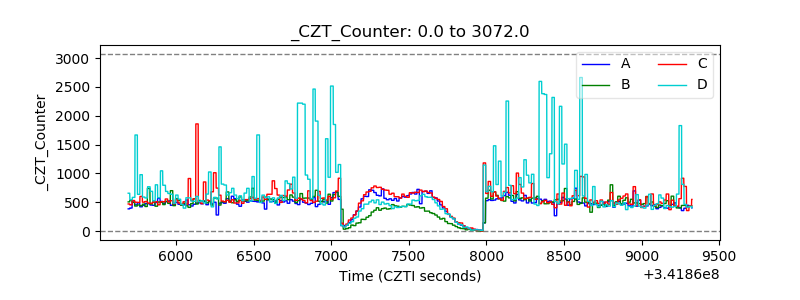 |
| +2.5 Volts monitor | 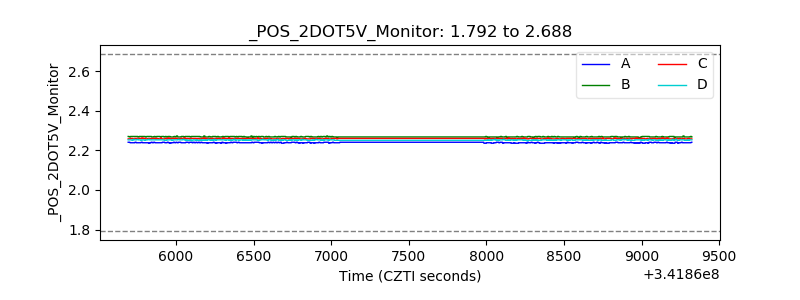 |
| +5 Volts monitor |  |
| _ROLL_ROT | 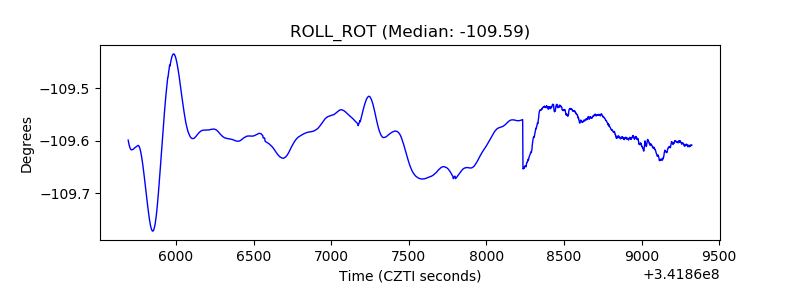 |
| _Roll_DEC |  |
| _Roll_RA | 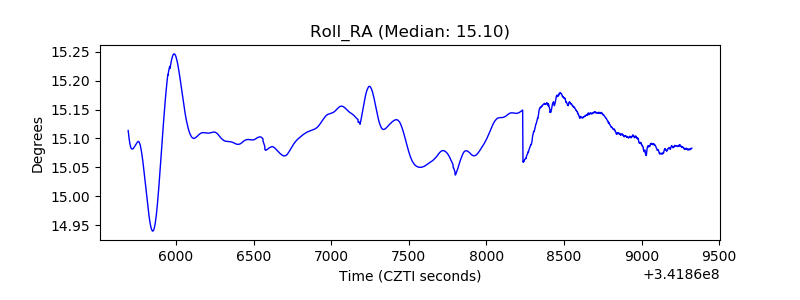 |
| Veto Counter |  |