| Param | Original file | Final file |
|---|---|---|
| Filename | modeM0/AS1A09_038T26_9000003948_27541cztM0_level2.evt | modeM0/AS1A09_038T26_9000003948_27541cztM0_level2_quad_clean.evt |
| Size (bytes) | 133,983,360 | 32,843,520 |
| Size | 127.8 MB | 31.3 MB |
| Events in quadrant A | 795,107 | 224,663 |
| Events in quadrant B | 874,698 | 227,903 |
| Events in quadrant C | 1,052,511 | 213,565 |
| Events in quadrant D | 1,218,492 | 204,350 |
| Mode M0 | |||
|---|---|---|---|
| Quadrant | BADHDUFLAG | Total packets | Discarded packets |
| A | 0 | 3472 | 0 |
| B | 0 | 3658 | 0 |
| C | 0 | 4263 | 0 |
| D | 0 | 4806 | 0 |
| Quadrant | Total seconds | Saturated seconds | Saturation percentage |
|---|---|---|---|
| A | 1687 | 2 | 0.118554% |
| B | 1688 | 9 | 0.533175% |
| C | 1688 | 30 | 1.777251% |
| D | 1688 | 110 | 6.516588% |
Noise dominated data is calculated using 1-second bins in cleaned event files. If a bin has >2000 counts, and if more than 50% of those come from <1% of pixels, then it is considered to be noise-dominated and hence unusable.
| Quadrant | # 1 sec bins | Bins with >0 counts | Bins with >2000 counts | High rate bins dominated by noise | Noise dominated (total time) | Noise dominated (detector-on time) | Marked lightcurve |
|---|---|---|---|---|---|---|---|
| A | 1687 | 1687 | 0 | 0 | 0.00% | 0.00% | 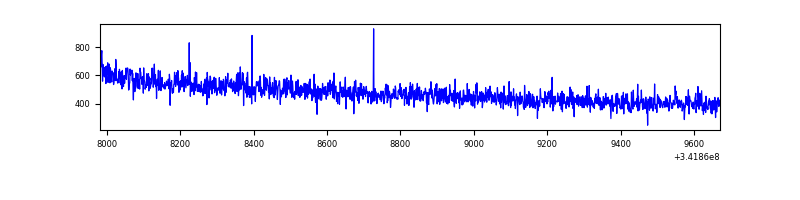 |
| B | 1688 | 1688 | 3 | 3 | 0.18% | 0.18% | 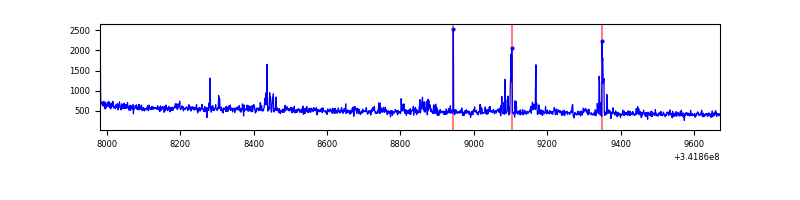 |
| C | 1688 | 1688 | 15 | 15 | 0.89% | 0.89% | 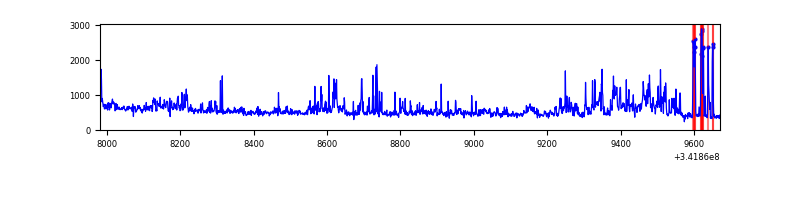 |
| D | 1688 | 1688 | 100 | 100 | 5.92% | 5.92% | 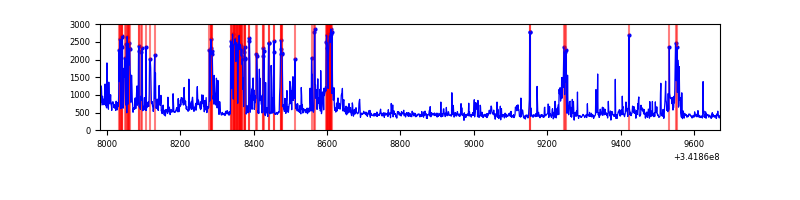 |
Top three noisy pixels from each quadrant. If the there are fewer than three noisy pixels in the level2.evt file, extra rows are filled as -1
| Pixel properties | Quadrant properties | ||||||
|---|---|---|---|---|---|---|---|
| Quadrant | DetID | PixID | Counts | Sigma | Mean | Median | Sigma |
| A | 13 | 254 | 3396 | 74.19 | 205 | 201 | 43.1 |
| A | 3 | 137 | 2032 | 42.52 | 205 | 201 | 43.1 |
| A | 0 | 226 | 1767 | 36.37 | 205 | 201 | 43.1 |
| B | 10 | 245 | 29690 | 706.19 | 207 | 202 | 41.8 |
| B | 0 | 244 | 13072 | 308.22 | 207 | 202 | 41.8 |
| B | 0 | 230 | 5931 | 137.2 | 207 | 202 | 41.8 |
| C | 7 | 221 | 222983 | 4765.42 | 190 | 190 | 46.8 |
| C | 2 | 16 | 56146 | 1196.87 | 190 | 190 | 46.8 |
| C | 14 | 238 | 30752 | 653.7 | 190 | 190 | 46.8 |
| D | 1 | 52 | 433749 | 9266.55 | 186 | 180 | 46.8 |
| D | 2 | 250 | 63332 | 1349.73 | 186 | 180 | 46.8 |
| D | 2 | 234 | 7700 | 160.72 | 186 | 180 | 46.8 |
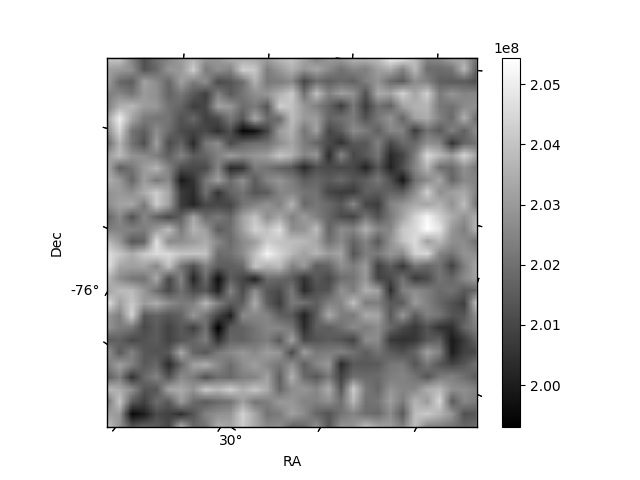
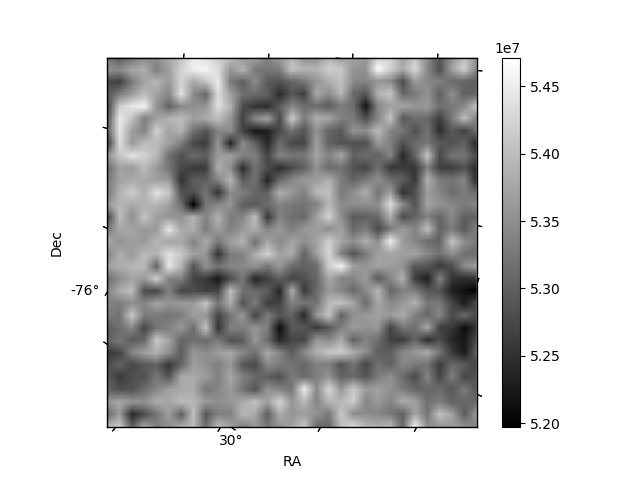
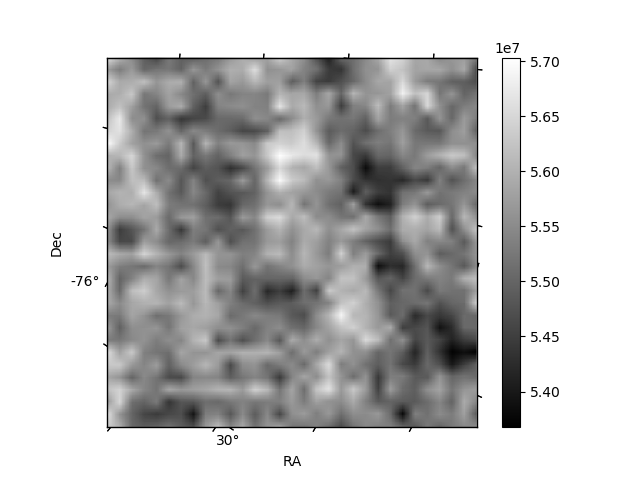
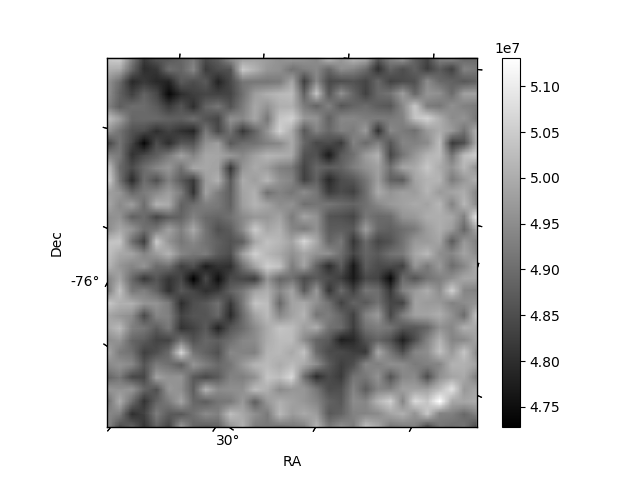
Histogram calculated using DETX and DETY for each event in the final _common_clean file
| Quadrant A | 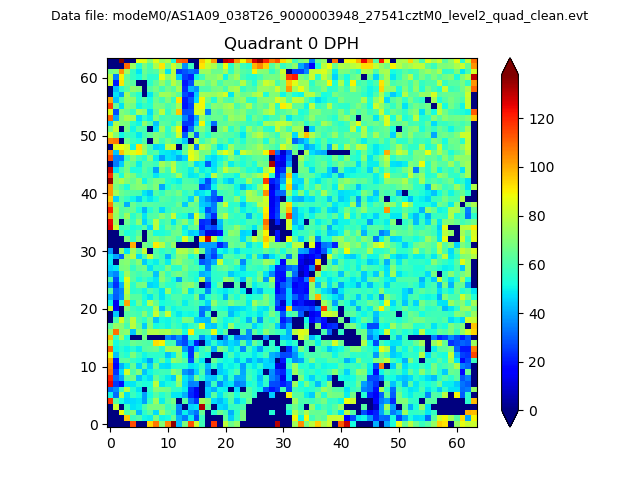 |
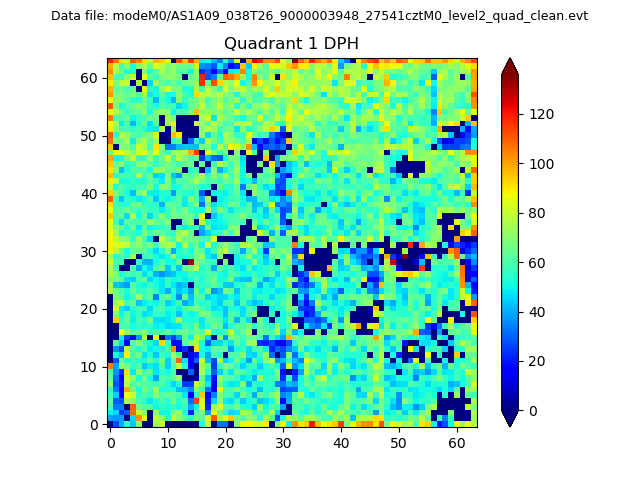 |
Quadrant B |
|---|---|---|---|
| Quadrant D | 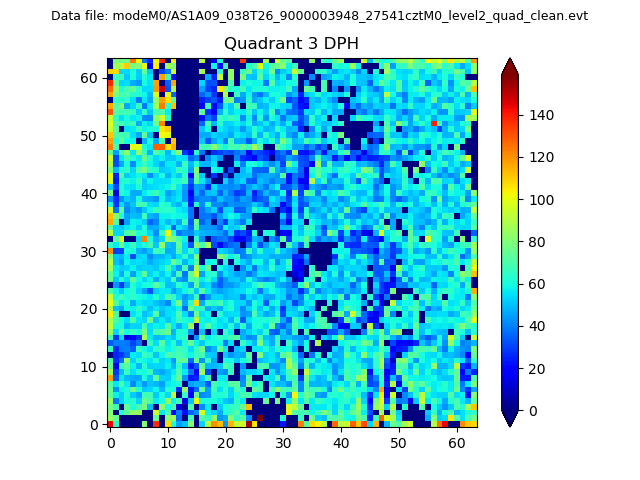 |
 |
Quadrant C |
| Plot type | Count rate plots | Images |
|---|---|---|
| Comparison with Poisson distribution Blue bars denote a histogram of data divided into 1 sec bins. Red curve is a Poisson curve with rate = median count rate of data. |
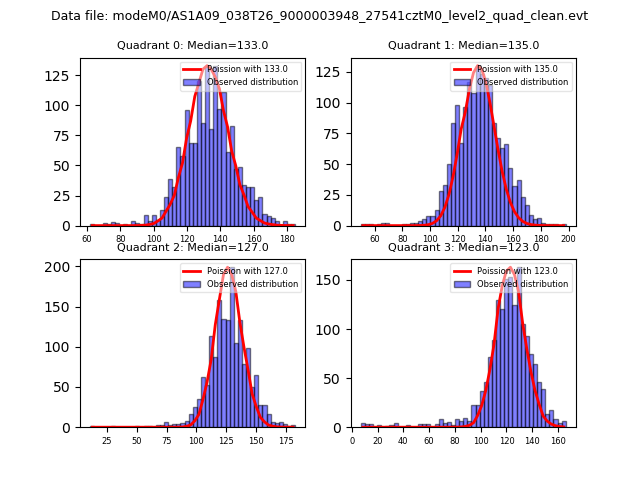 |
 |
| Quadrant-wise count rates Data is divided into 100 sec bins |
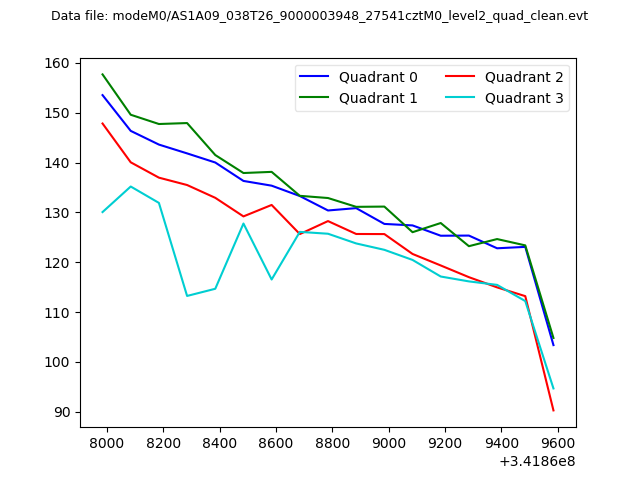 |
|
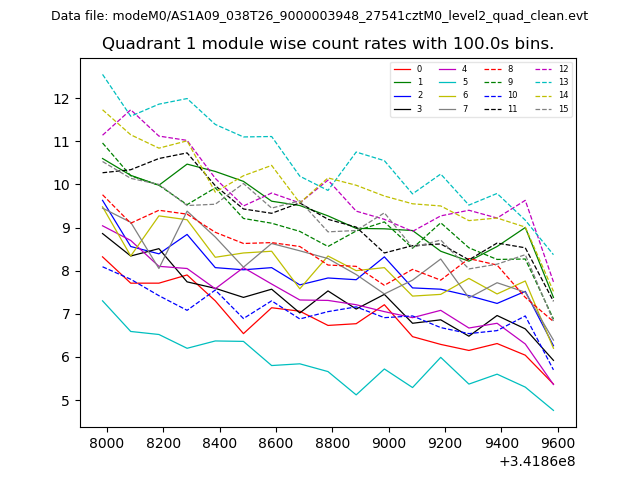
| Module-wise count rates for Quadrant A Data is divided into 100 sec bins |
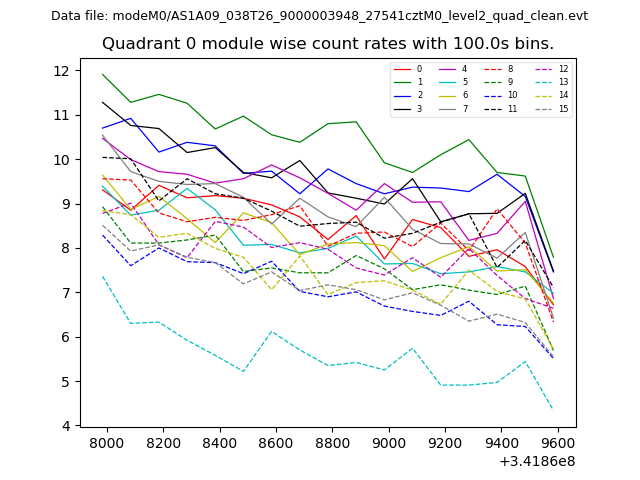 |
 |
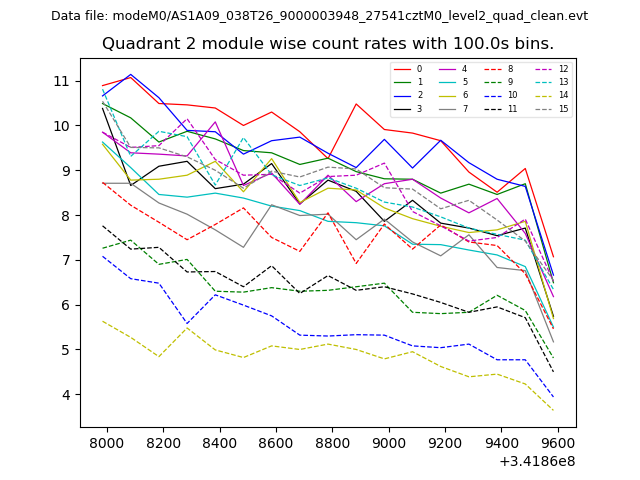
| Module-wise count rates for Quadrant B Data is divided into 100 sec bins |
 |
 |
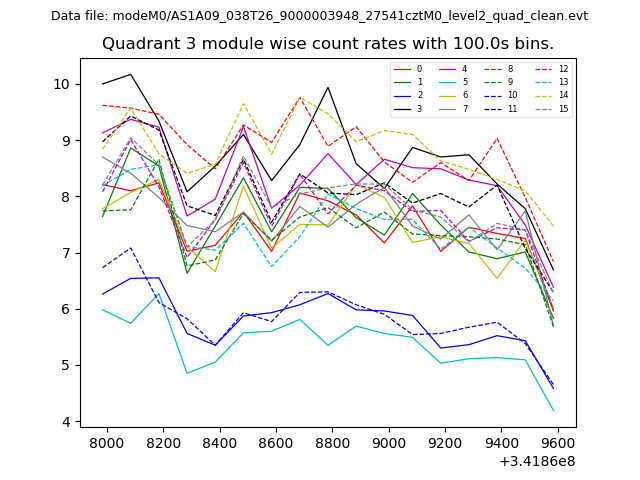
| Module-wise count rates for Quadrant C Data is divided into 100 sec bins |
 |
 |
| Module-wise count rates for Quadrant D Data is divided into 100 sec bins |
 |
 |
| Parameter | Plot |
|---|---|
| CZT HV Monitor | 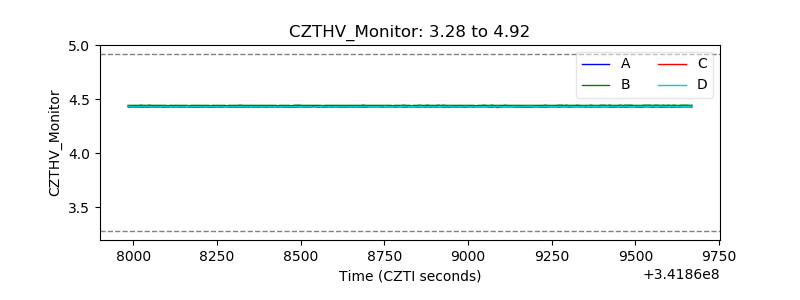 |
| D_VDD | 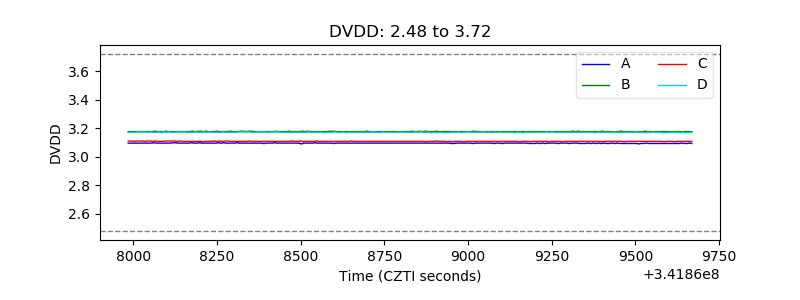 |
| Temperature 1 | 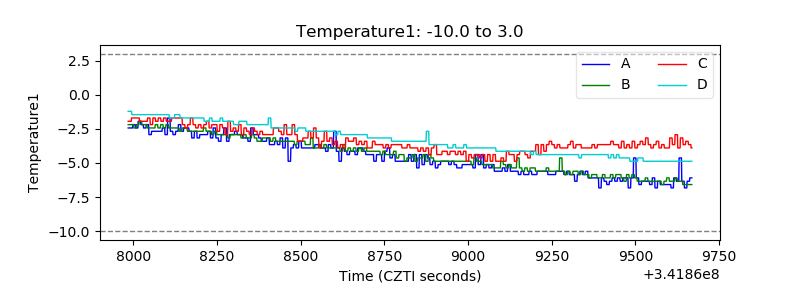 |
| Veto HV Monitor | 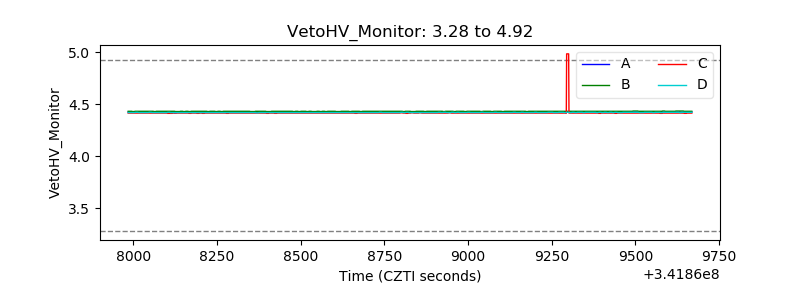 |
| Veto LLD | 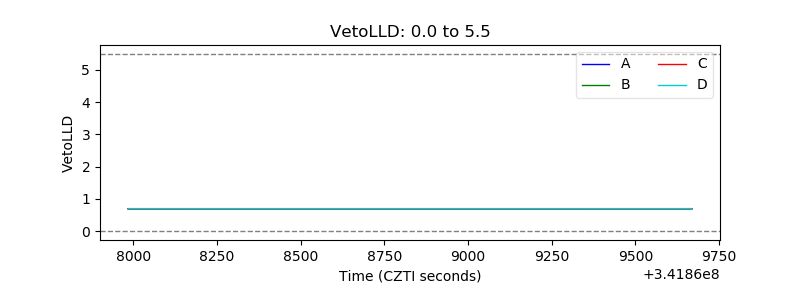 |
| Alpha Counter | 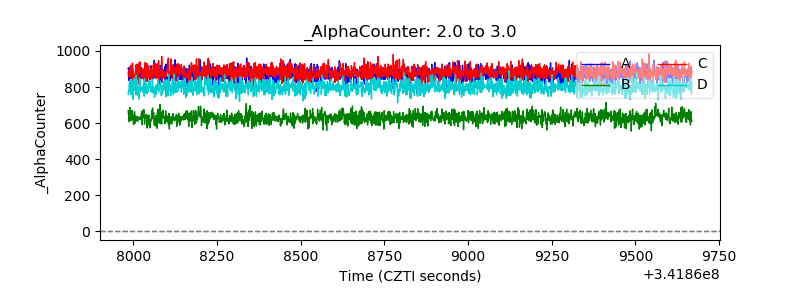 |
| _CPM_Rate | 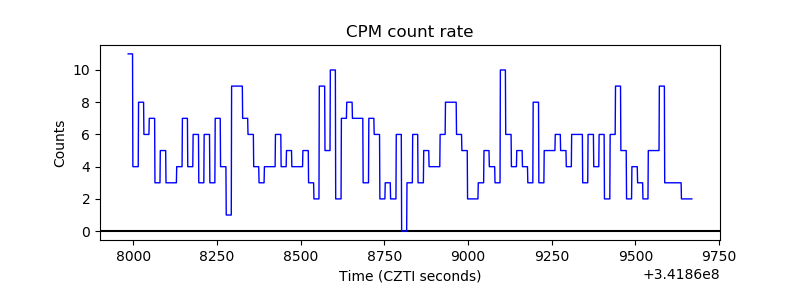 |
| CZT Counter | 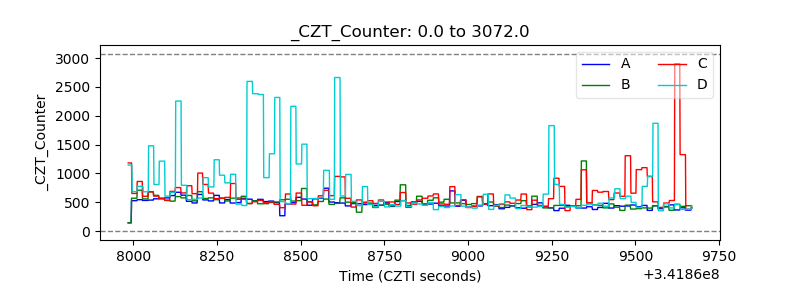 |
| +2.5 Volts monitor |  |
| +5 Volts monitor |  |
| _ROLL_ROT | 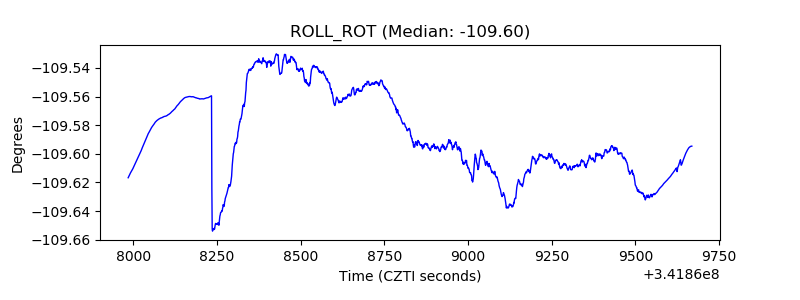 |
| _Roll_DEC | 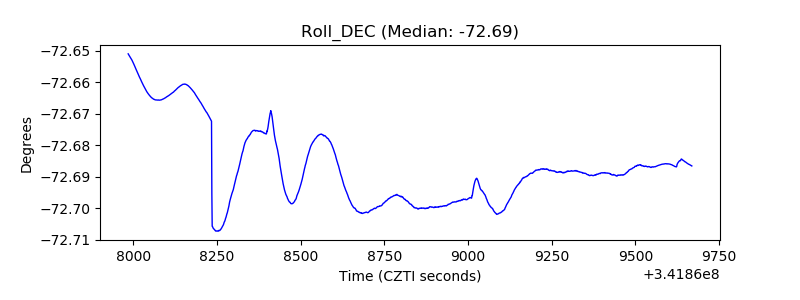 |
| _Roll_RA | 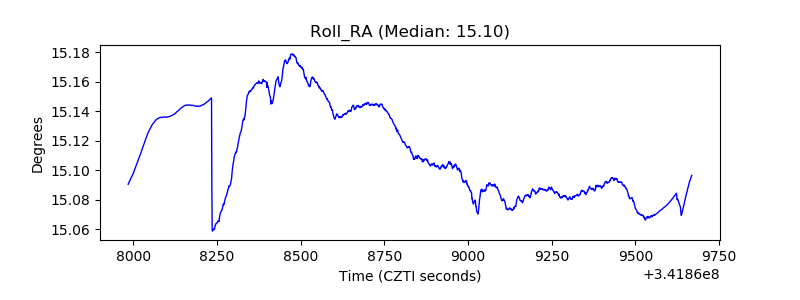 |
| Veto Counter | 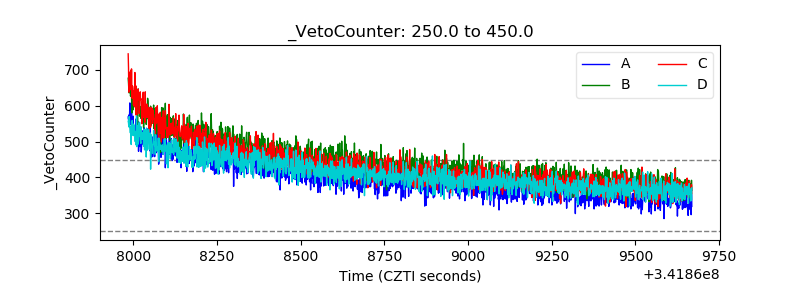 |