| Param | Original file | Final file |
|---|---|---|
| Filename | modeM0/AS1A09_038T27_9000003950cztM0_level2.fits | modeM0/AS1A09_038T27_9000003950cztM0_level2_quad_clean.evt |
| Size (bytes) | 46,146,240 | 36,843,840 |
| Size | 44.0 MB | 35.1 MB |
| Events in quadrant A | 282,800 | 207,324 |
| Events in quadrant B | 271,008 | 207,865 |
| Events in quadrant C | 275,040 | 195,233 |
| Events in quadrant D | 240,410 | 175,791 |
| Mode SS | |||
|---|---|---|---|
| Quadrant | BADHDUFLAG | Total packets | Discarded packets |
| A | 0 | 96 | 0 |
| B | 0 | 96 | 0 |
| C | 0 | 96 | 0 |
| D | 0 | 96 | 0 |
| Mode M9 | |||
|---|---|---|---|
| Quadrant | BADHDUFLAG | Total packets | Discarded packets |
| A | 0 | 10 | 0 |
| B | 0 | 10 | 0 |
| C | 0 | 10 | 0 |
| D | 0 | 10 | 0 |
| Mode M0 | |||
|---|---|---|---|
| Quadrant | BADHDUFLAG | Total packets | Discarded packets |
| A | 0 | 9585 | 0 |
| B | 0 | 10372 | 0 |
| C | 0 | 9656 | 0 |
| D | 0 | 11217 | 0 |
| Quadrant | Total seconds | Saturated seconds | Saturation percentage |
|---|---|---|---|
| A | 4675 | 27 | 0.577540% |
| B | 4675 | 84 | 1.796791% |
| C | 4675 | 41 | 0.877005% |
| D | 4675 | 114 | 2.438503% |
Noise dominated data is calculated using 1-second bins in cleaned event files. If a bin has >2000 counts, and if more than 50% of those come from <1% of pixels, then it is considered to be noise-dominated and hence unusable.
| Quadrant | # 1 sec bins | Bins with >0 counts | Bins with >2000 counts | High rate bins dominated by noise | Noise dominated (total time) | Noise dominated (detector-on time) | Marked lightcurve |
|---|---|---|---|---|---|---|---|
| A | 5739 | 4673 | 0 | 0 | 0.00% | 0.00% | 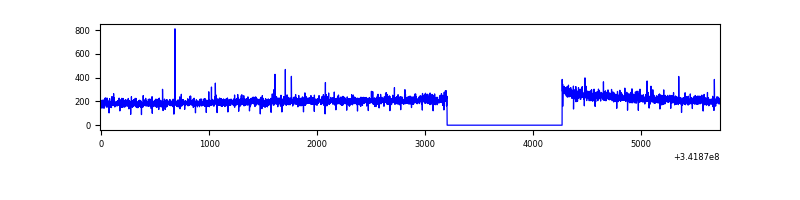 |
| B | 5739 | 4671 | 0 | 0 | 0.00% | 0.00% |  |
| C | 5739 | 4673 | 0 | 0 | 0.00% | 0.00% |  |
| D | 5740 | 4674 | 0 | 0 | 0.00% | 0.00% |  |
Top three noisy pixels from each quadrant. If the there are fewer than three noisy pixels in the level2.evt file, extra rows are filled as -1
| Pixel properties | Quadrant properties | ||||||
|---|---|---|---|---|---|---|---|
| Quadrant | DetID | PixID | Counts | Sigma | Mean | Median | Sigma |
| A | 0 | 29 | 288 | 10.95 | 73 | 69 | 20.0 |
| A | 0 | 30 | 228 | 7.95 | 73 | 69 | 20.0 |
| A | 15 | 236 | 226 | 7.85 | 73 | 69 | 20.0 |
| B | 2 | 9 | 249 | 11.07 | 71 | 68 | 16.4 |
| B | 2 | 8 | 200 | 8.07 | 71 | 68 | 16.4 |
| B | 3 | 17 | 187 | 7.28 | 71 | 68 | 16.4 |
| C | 3 | 203 | 202 | 6.69 | 72 | 68 | 20.0 |
| C | 3 | 202 | 199 | 6.54 | 72 | 68 | 20.0 |
| C | 7 | 233 | 191 | 6.14 | 72 | 68 | 20.0 |
| D | 15 | 46 | 178 | 5.78 | 68 | 62 | 20.1 |
| D | 10 | 189 | 178 | 5.78 | 68 | 62 | 20.1 |
| D | 4 | 160 | 177 | 5.73 | 68 | 62 | 20.1 |
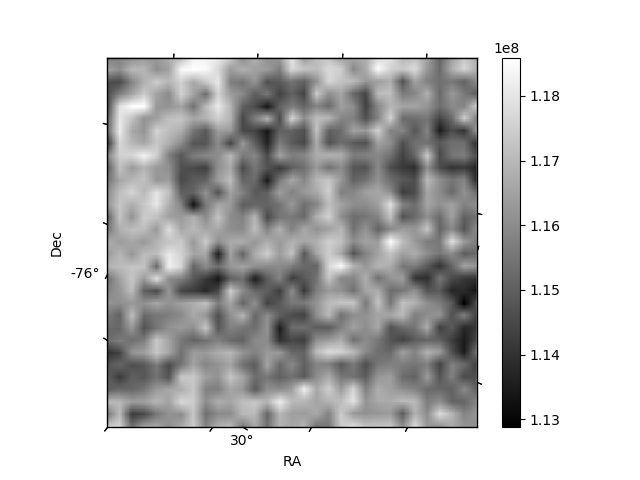
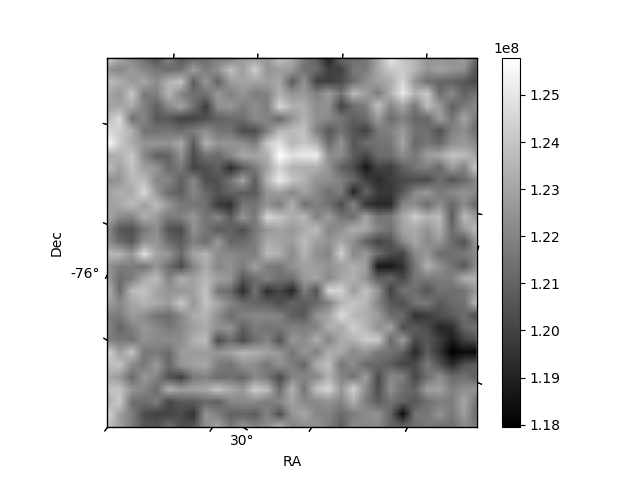
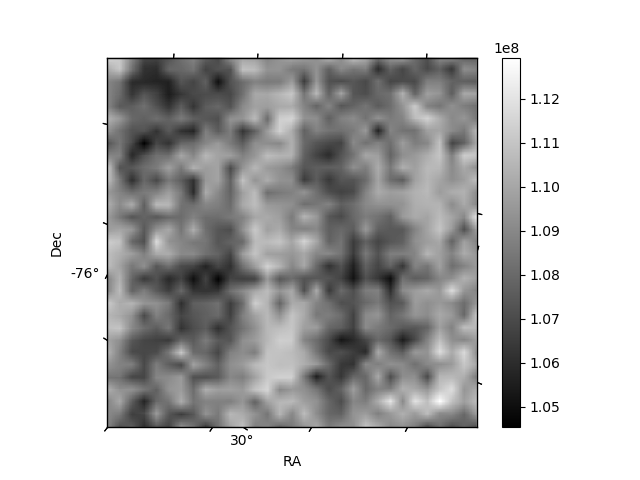
Histogram calculated using DETX and DETY for each event in the final _common_clean file
| Quadrant A |  |
 |
Quadrant B |
|---|---|---|---|
| Quadrant D | 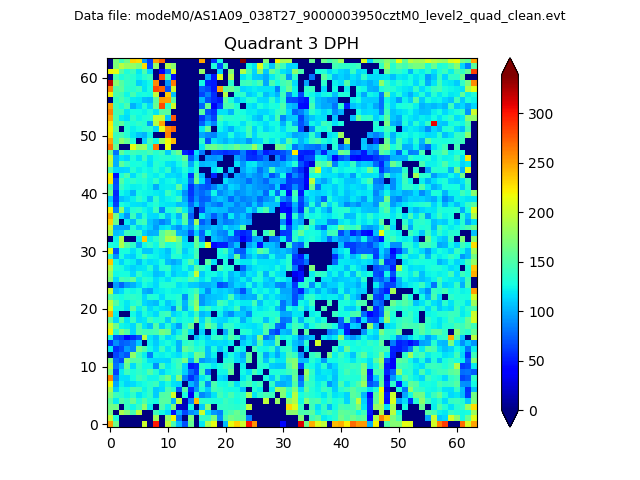 |
 |
Quadrant C |
| Plot type | Count rate plots | Images |
|---|---|---|
| Comparison with Poisson distribution Blue bars denote a histogram of data divided into 1 sec bins. Red curve is a Poisson curve with rate = median count rate of data. |
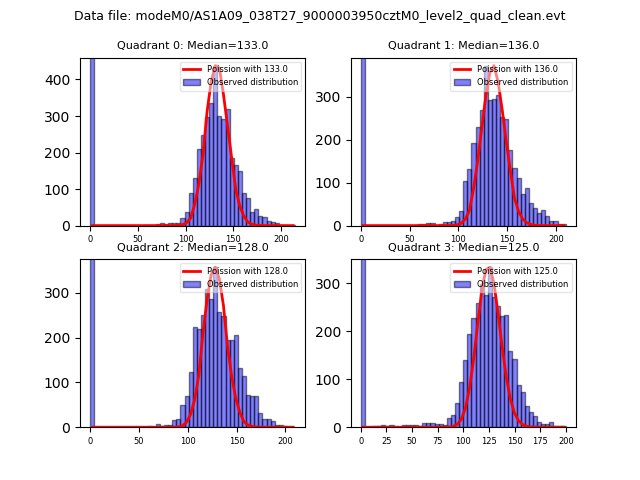 |
 |
| Quadrant-wise count rates Data is divided into 100 sec bins |
 |
|
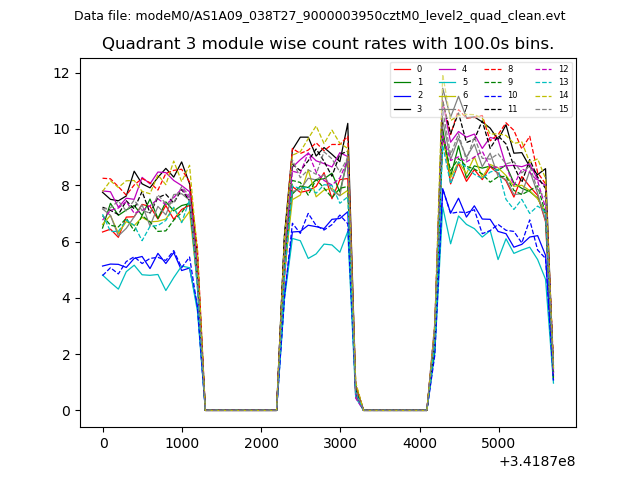
| Module-wise count rates for Quadrant A Data is divided into 100 sec bins |
 |
 |
| Module-wise count rates for Quadrant B Data is divided into 100 sec bins |
 |
 |
| Module-wise count rates for Quadrant C Data is divided into 100 sec bins |
 |
 |
| Module-wise count rates for Quadrant D Data is divided into 100 sec bins |
 |
 |
| Parameter | Plot |
|---|---|
| CZT HV Monitor | 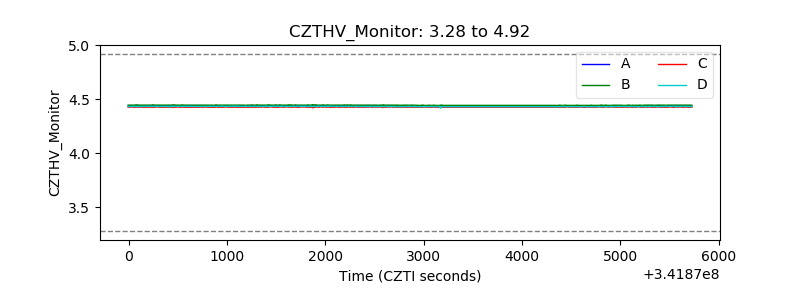 |
| D_VDD |  |
| Temperature 1 |  |
| Veto HV Monitor |  |
| Veto LLD | 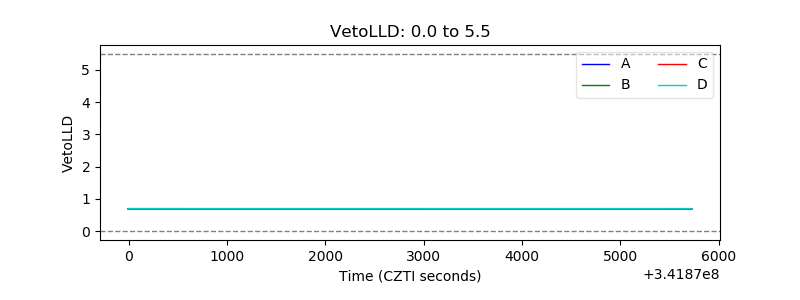 |
| Alpha Counter |  |
| _CPM_Rate |  |
| CZT Counter |  |
| +2.5 Volts monitor |  |
| +5 Volts monitor |  |
| _ROLL_ROT | 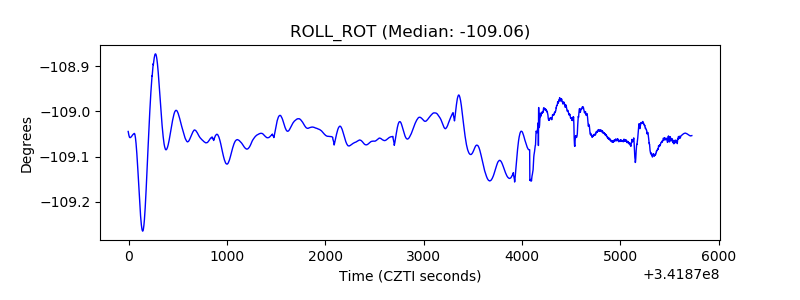 |
| _Roll_DEC |  |
| _Roll_RA |  |
| Veto Counter |  |