| Param | Original file | Final file |
|---|---|---|
| Filename | modeM0/AS1A09_038T27_9000003950_27543cztM0_level2.evt | modeM0/AS1A09_038T27_9000003950_27543cztM0_level2_quad_clean.evt |
| Size (bytes) | 115,272,000 | 31,334,400 |
| Size | 109.9 MB | 29.9 MB |
| Events in quadrant A | 722,900 | 213,364 |
| Events in quadrant B | 787,499 | 221,598 |
| Events in quadrant C | 737,685 | 209,454 |
| Events in quadrant D | 1,140,599 | 195,363 |
| Mode M9 | |||
|---|---|---|---|
| Quadrant | BADHDUFLAG | Total packets | Discarded packets |
| A | 0 | 3 | 0 |
| B | 0 | 4 | 0 |
| C | 0 | 4 | 0 |
| D | 0 | 4 | 0 |
| Mode M0 | |||
|---|---|---|---|
| Quadrant | BADHDUFLAG | Total packets | Discarded packets |
| A | 0 | 3067 | 0 |
| B | 0 | 3253 | 0 |
| C | 0 | 3072 | 0 |
| D | 0 | 4347 | 0 |
| Quadrant | Total seconds | Saturated seconds | Saturation percentage |
|---|---|---|---|
| A | 1462 | 2 | 0.136799% |
| B | 1462 | 6 | 0.410397% |
| C | 1462 | 8 | 0.547196% |
| D | 1462 | 96 | 6.566347% |
Noise dominated data is calculated using 1-second bins in cleaned event files. If a bin has >2000 counts, and if more than 50% of those come from <1% of pixels, then it is considered to be noise-dominated and hence unusable.
| Quadrant | # 1 sec bins | Bins with >0 counts | Bins with >2000 counts | High rate bins dominated by noise | Noise dominated (total time) | Noise dominated (detector-on time) | Marked lightcurve |
|---|---|---|---|---|---|---|---|
| A | 1462 | 1462 | 0 | 0 | 0.00% | 0.00% | 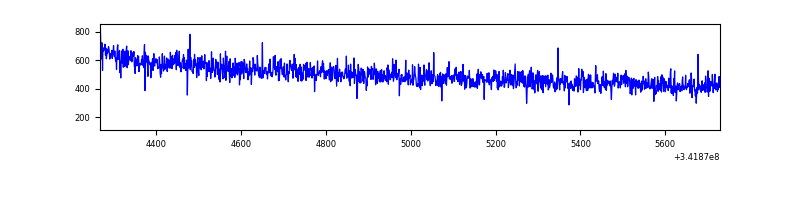 |
| B | 1462 | 1462 | 4 | 4 | 0.27% | 0.27% | 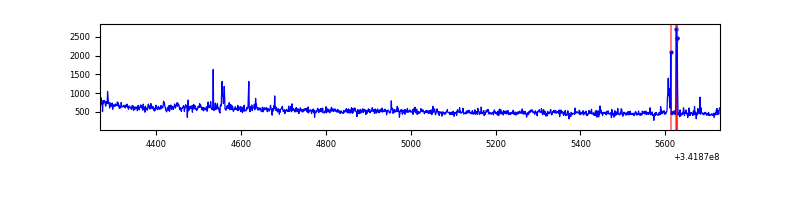 |
| C | 1462 | 1462 | 0 | 0 | 0.00% | 0.00% | 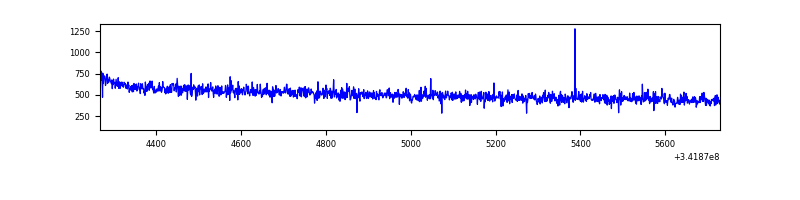 |
| D | 1462 | 1462 | 104 | 104 | 7.11% | 7.11% | 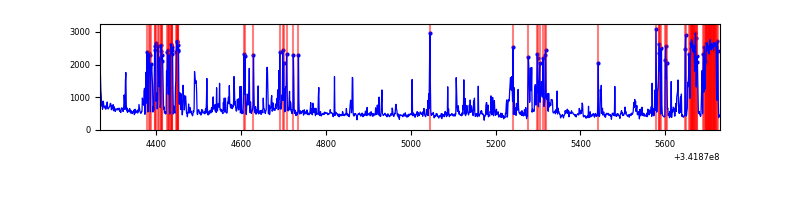 |
Top three noisy pixels from each quadrant. If the there are fewer than three noisy pixels in the level2.evt file, extra rows are filled as -1
| Pixel properties | Quadrant properties | ||||||
|---|---|---|---|---|---|---|---|
| Quadrant | DetID | PixID | Counts | Sigma | Mean | Median | Sigma |
| A | 13 | 254 | 2910 | 69.38 | 187 | 184 | 39.3 |
| A | 3 | 137 | 1819 | 41.61 | 187 | 184 | 39.3 |
| A | 0 | 226 | 1602 | 36.09 | 187 | 184 | 39.3 |
| B | 15 | 33 | 13580 | 352.82 | 190 | 185 | 38.0 |
| B | 15 | 32 | 9774 | 252.57 | 190 | 185 | 38.0 |
| B | 10 | 245 | 7420 | 190.57 | 190 | 185 | 38.0 |
| C | 14 | 238 | 29260 | 674.71 | 179 | 181 | 43.1 |
| C | 8 | 128 | 4194 | 93.11 | 179 | 181 | 43.1 |
| C | 7 | 221 | 2142 | 45.5 | 179 | 181 | 43.1 |
| D | 1 | 52 | 432298 | 10178.66 | 172 | 167 | 42.5 |
| D | 2 | 250 | 50131 | 1176.88 | 172 | 167 | 42.5 |
| D | 2 | 234 | 5982 | 136.97 | 172 | 167 | 42.5 |
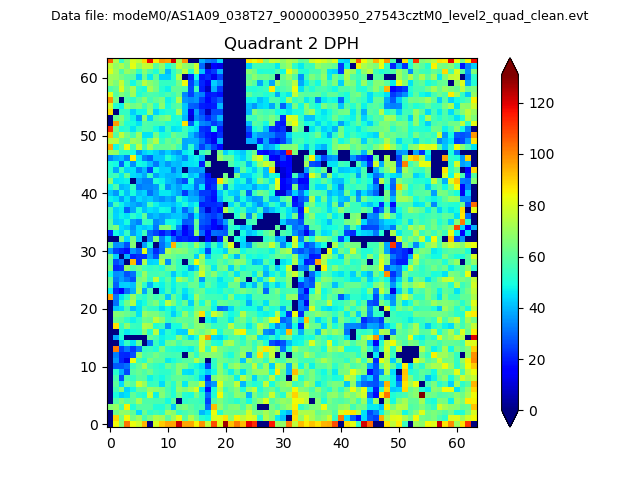
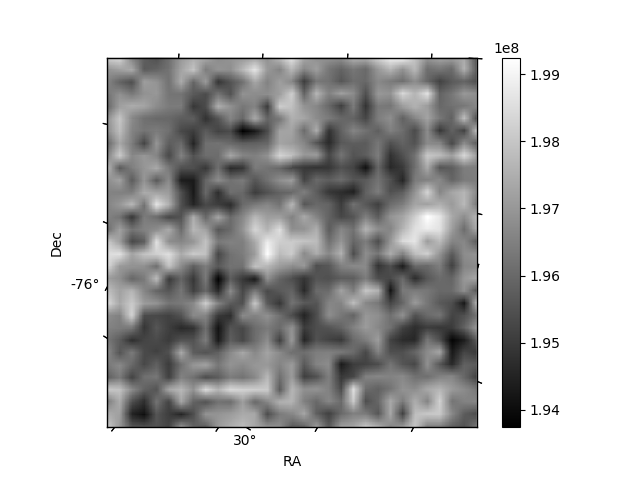
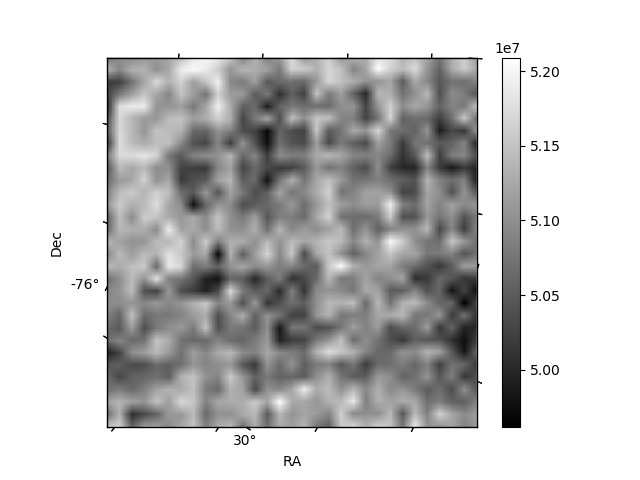
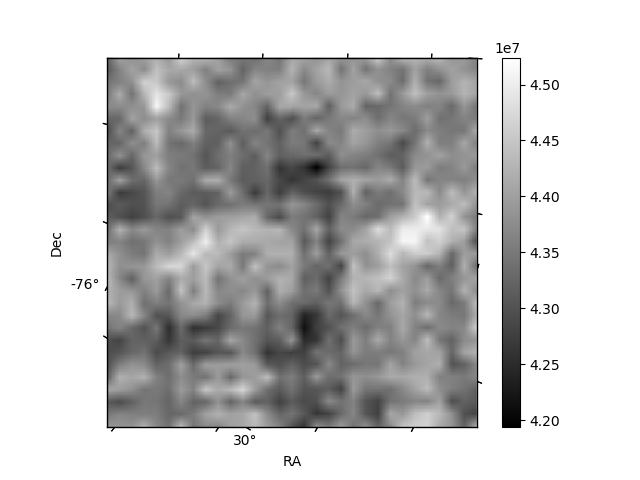
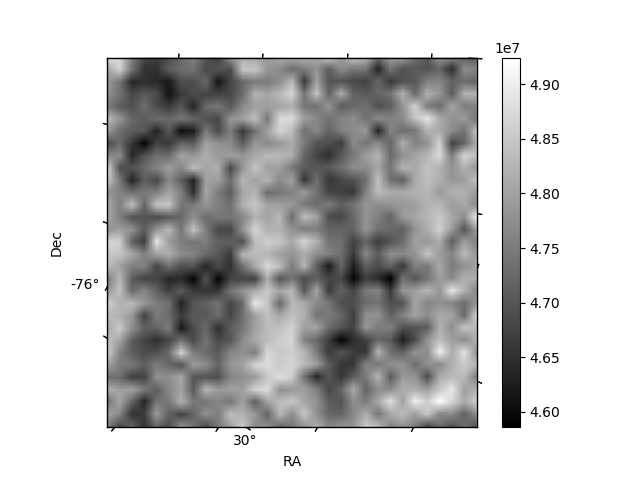
Histogram calculated using DETX and DETY for each event in the final _common_clean file
| Quadrant A | 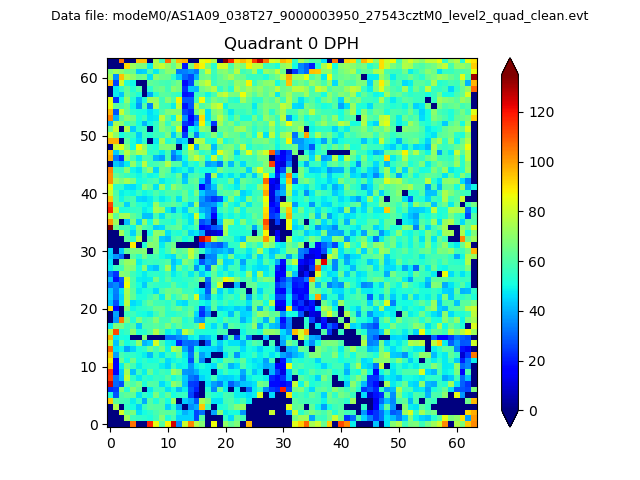 |
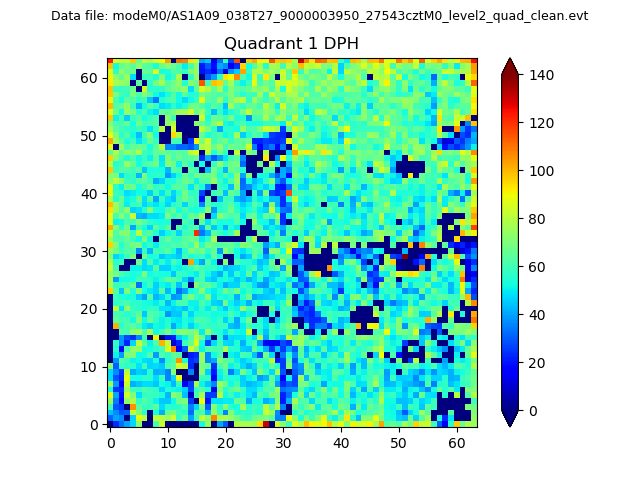 |
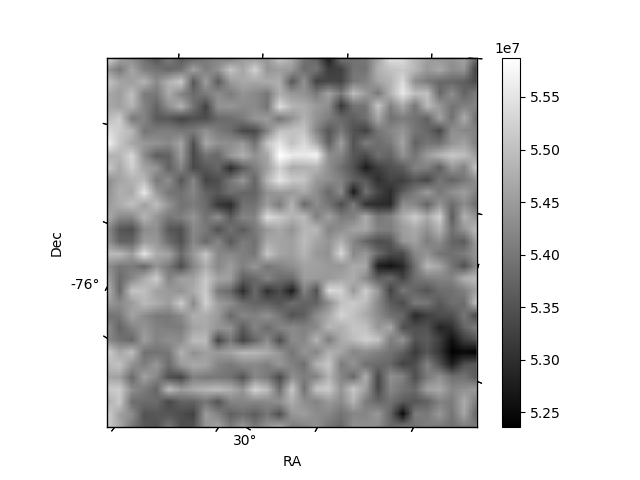
Quadrant B |
|---|---|---|---|
| Quadrant D | 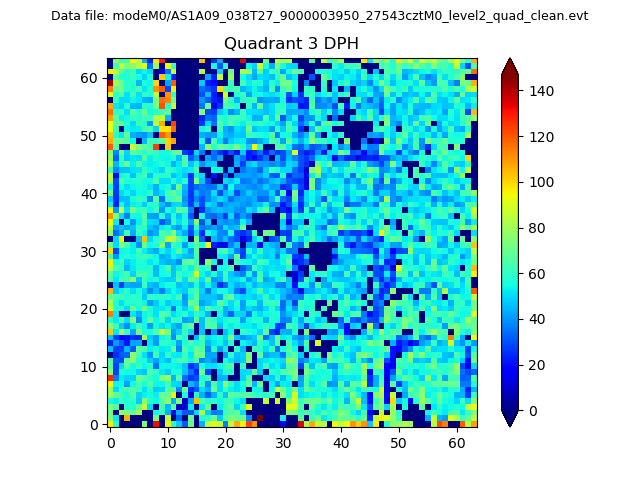 |
 |
Quadrant C |
| Plot type | Count rate plots | Images |
|---|---|---|
| Comparison with Poisson distribution Blue bars denote a histogram of data divided into 1 sec bins. Red curve is a Poisson curve with rate = median count rate of data. |
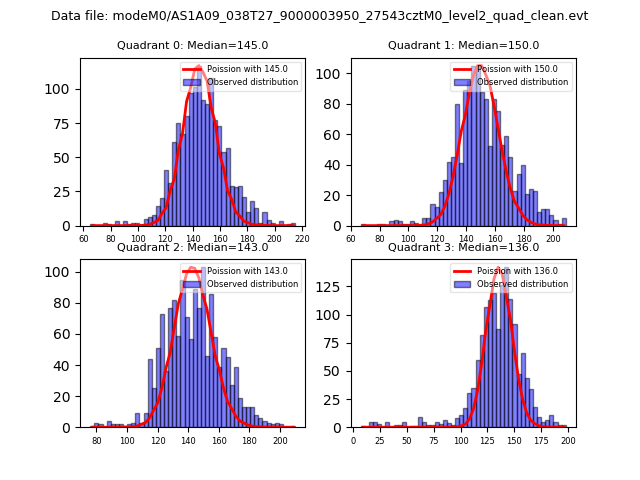 |
 |
| Quadrant-wise count rates Data is divided into 100 sec bins |
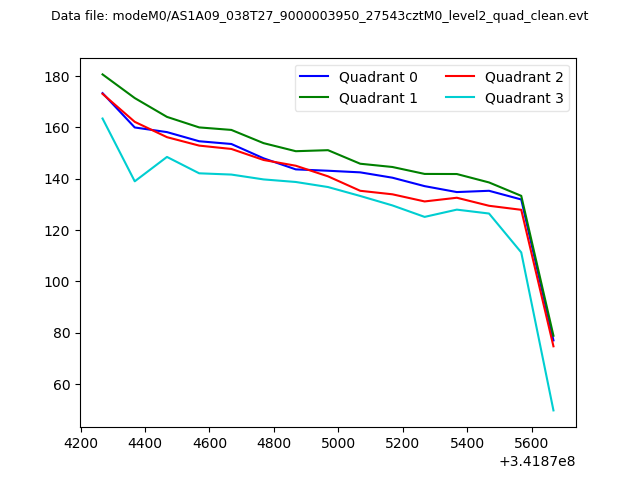 |
|
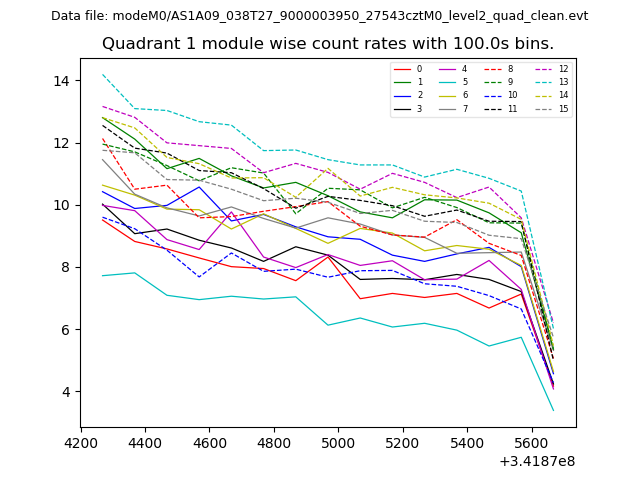
| Module-wise count rates for Quadrant A Data is divided into 100 sec bins |
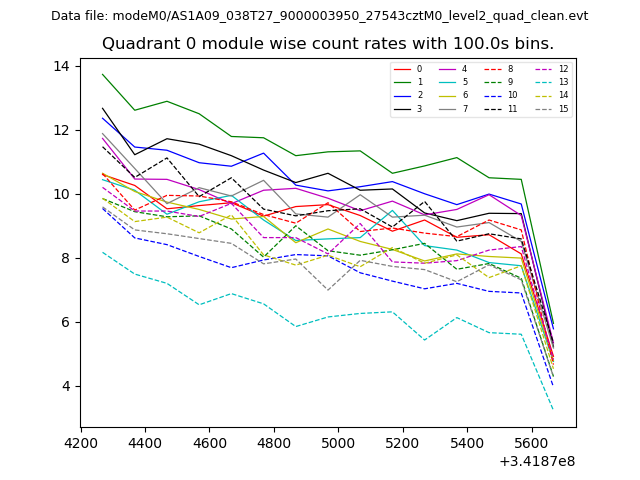 |
 |
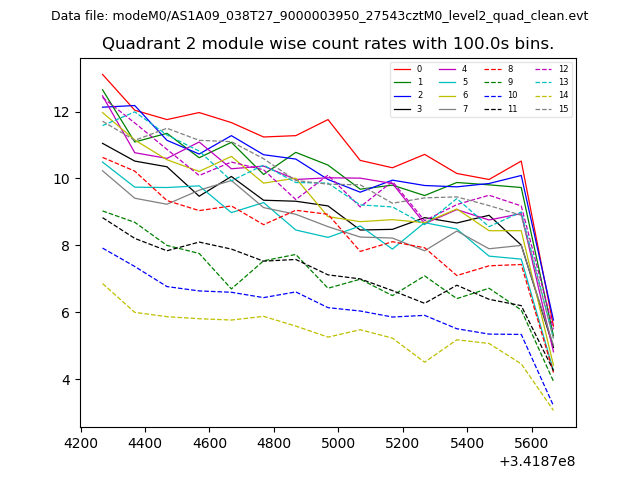
| Module-wise count rates for Quadrant B Data is divided into 100 sec bins |
 |
 |
| Module-wise count rates for Quadrant C Data is divided into 100 sec bins |
 |
 |
| Module-wise count rates for Quadrant D Data is divided into 100 sec bins |
 |
 |
| Parameter | Plot |
|---|---|
| CZT HV Monitor | 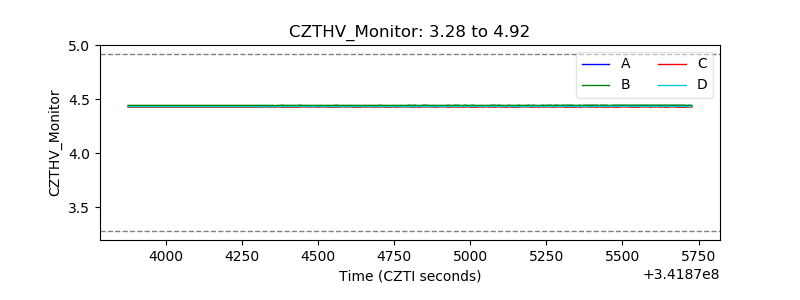 |
| D_VDD | 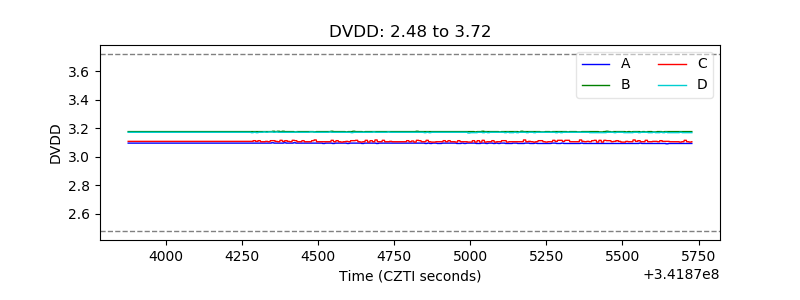 |
| Temperature 1 | 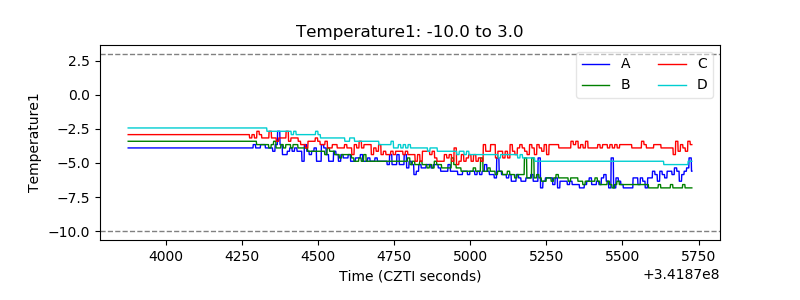 |
| Veto HV Monitor | 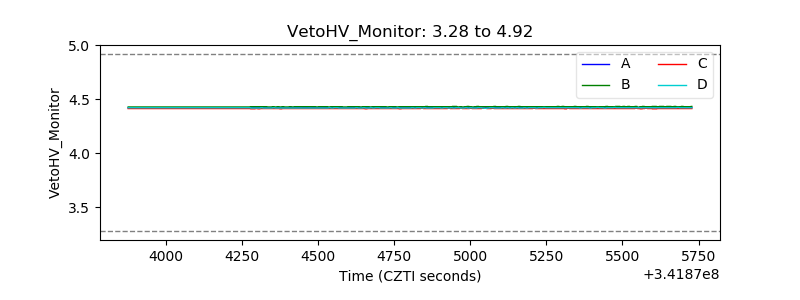 |
| Veto LLD | 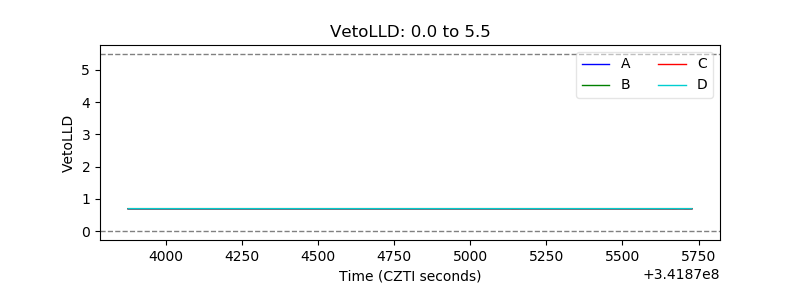 |
| Alpha Counter | 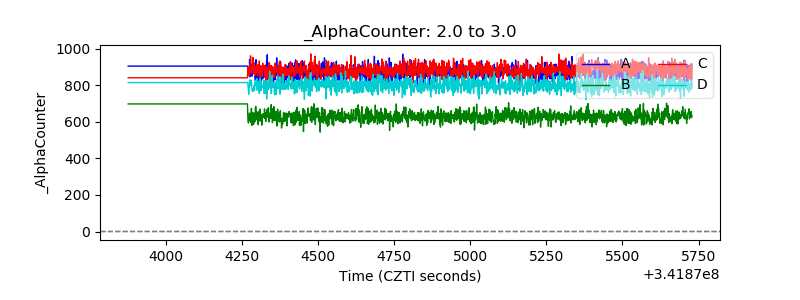 |
| _CPM_Rate | 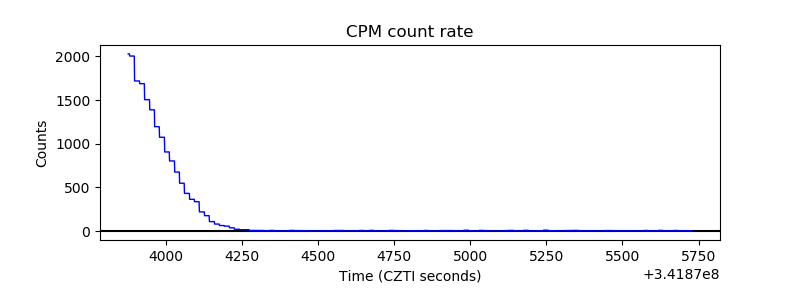 |
| CZT Counter | 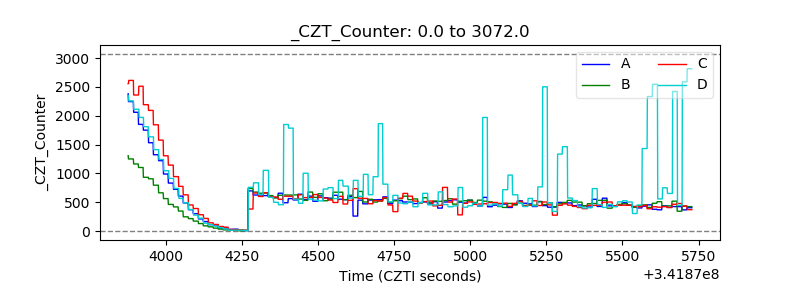 |
| +2.5 Volts monitor |  |
| +5 Volts monitor | 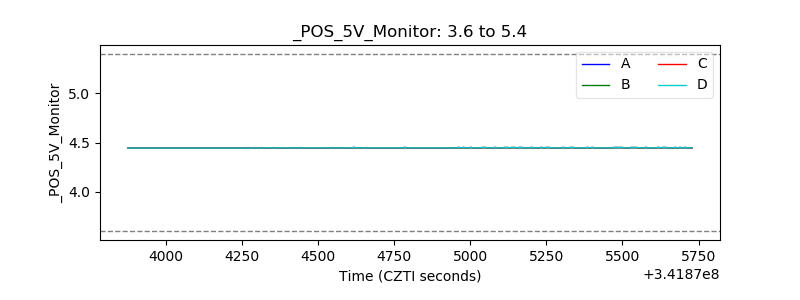 |
| _ROLL_ROT | 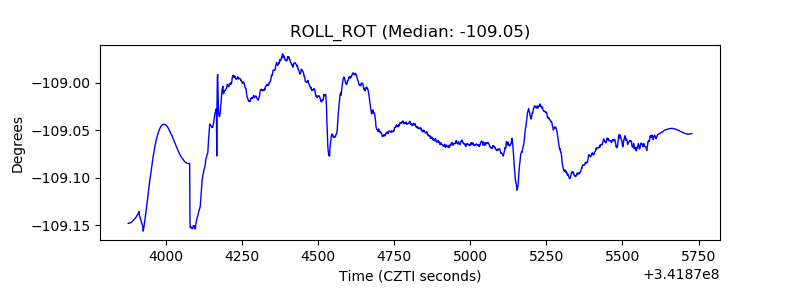 |
| _Roll_DEC | 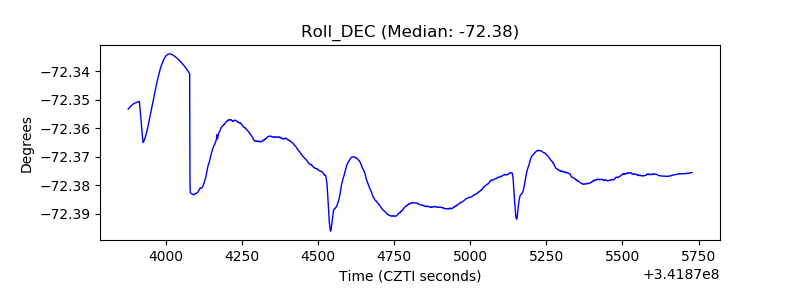 |
| _Roll_RA | 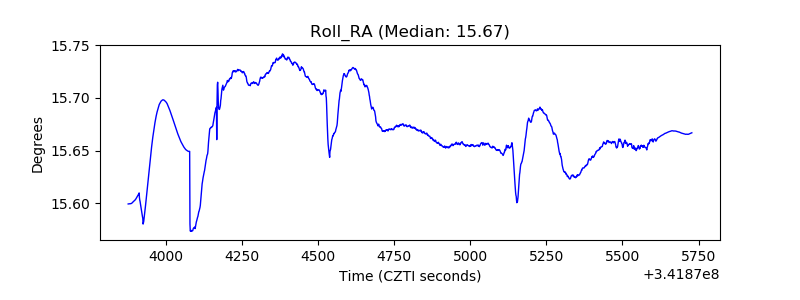 |
| Veto Counter |  |