| Param | Original file | Final file |
|---|---|---|
| Filename | modeM0/AS1A09_038T28_9000003952cztM0_level2.fits | modeM0/AS1A09_038T28_9000003952cztM0_level2_quad_clean.evt |
| Size (bytes) | 49,656,960 | 31,593,600 |
| Size | 47.4 MB | 30.1 MB |
| Events in quadrant A | 307,840 | 165,103 |
| Events in quadrant B | 300,314 | 167,695 |
| Events in quadrant C | 307,374 | 156,426 |
| Events in quadrant D | 251,306 | 129,416 |
| Mode M9 | |||
|---|---|---|---|
| Quadrant | BADHDUFLAG | Total packets | Discarded packets |
| A | 0 | 12 | 0 |
| B | 0 | 12 | 0 |
| C | 0 | 12 | 0 |
| D | 0 | 12 | 0 |
| Mode SS | |||
|---|---|---|---|
| Quadrant | BADHDUFLAG | Total packets | Discarded packets |
| A | 0 | 98 | 0 |
| B | 0 | 98 | 0 |
| C | 0 | 98 | 0 |
| D | 0 | 98 | 0 |
| Mode M0 | |||
|---|---|---|---|
| Quadrant | BADHDUFLAG | Total packets | Discarded packets |
| A | 0 | 10080 | 0 |
| B | 0 | 10593 | 0 |
| C | 0 | 10166 | 0 |
| D | 0 | 17411 | 0 |
| Quadrant | Total seconds | Saturated seconds | Saturation percentage |
|---|---|---|---|
| A | 4801 | 36 | 0.749844% |
| B | 4801 | 76 | 1.583004% |
| C | 4801 | 68 | 1.416372% |
| D | 4801 | 608 | 12.664028% |
Noise dominated data is calculated using 1-second bins in cleaned event files. If a bin has >2000 counts, and if more than 50% of those come from <1% of pixels, then it is considered to be noise-dominated and hence unusable.
| Quadrant | # 1 sec bins | Bins with >0 counts | Bins with >2000 counts | High rate bins dominated by noise | Noise dominated (total time) | Noise dominated (detector-on time) | Marked lightcurve |
|---|---|---|---|---|---|---|---|
| A | 5981 | 4800 | 0 | 0 | 0.00% | 0.00% | 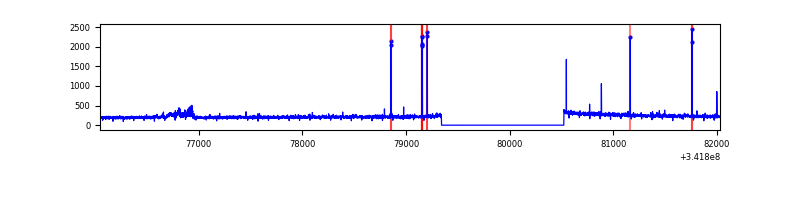 |
| B | 5980 | 4799 | 0 | 0 | 0.00% | 0.00% | 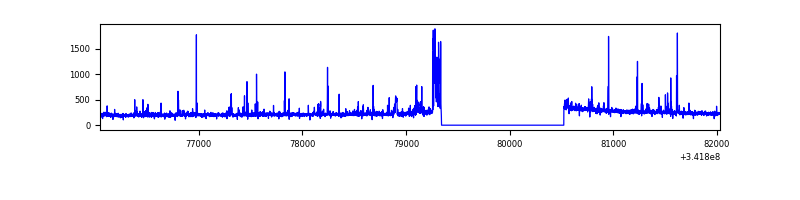 |
| C | 5980 | 4799 | 0 | 0 | 0.00% | 0.00% | 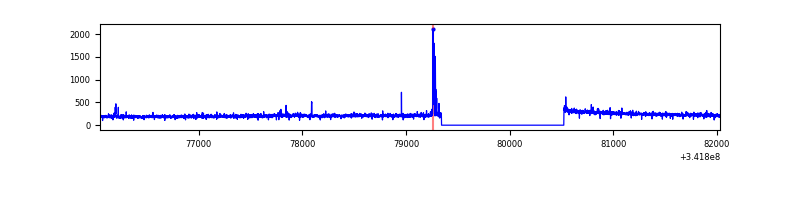 |
| D | 5981 | 4793 | 0 | 0 | 0.00% | 0.00% | 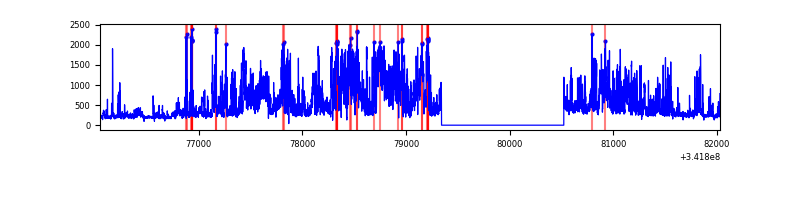 |
Top three noisy pixels from each quadrant. If the there are fewer than three noisy pixels in the level2.evt file, extra rows are filled as -1
| Pixel properties | Quadrant properties | ||||||
|---|---|---|---|---|---|---|---|
| Quadrant | DetID | PixID | Counts | Sigma | Mean | Median | Sigma |
| A | 0 | 29 | 323 | 11.39 | 80 | 76 | 21.7 |
| A | 7 | 110 | 242 | 7.66 | 80 | 76 | 21.7 |
| A | 9 | 19 | 241 | 7.61 | 80 | 76 | 21.7 |
| B | 2 | 9 | 259 | 10.36 | 79 | 76 | 17.7 |
| B | 2 | 8 | 239 | 9.23 | 79 | 76 | 17.7 |
| B | 5 | 128 | 220 | 8.15 | 79 | 76 | 17.7 |
| C | 1 | 81 | 246 | 7.68 | 81 | 76 | 22.1 |
| C | 3 | 234 | 230 | 6.96 | 81 | 76 | 22.1 |
| C | 1 | 80 | 224 | 6.69 | 81 | 76 | 22.1 |
| D | 3 | 14 | 194 | 6.31 | 71 | 65 | 20.4 |
| D | 4 | 246 | 186 | 5.92 | 71 | 65 | 20.4 |
| D | 15 | 46 | 185 | 5.87 | 71 | 65 | 20.4 |
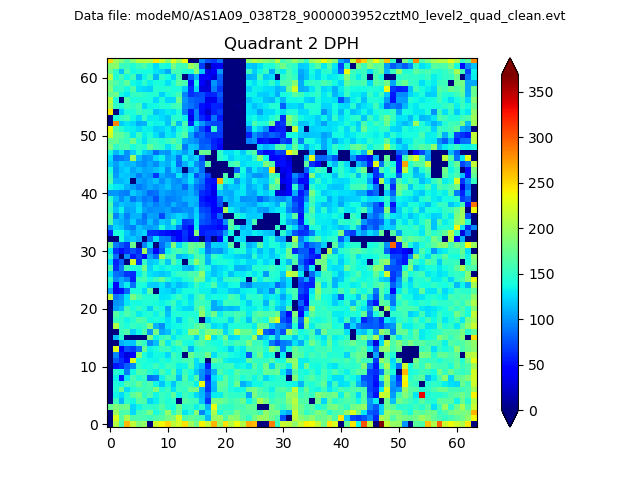
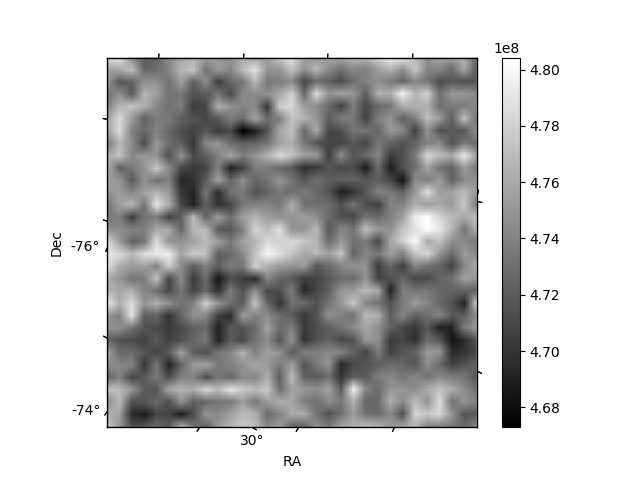
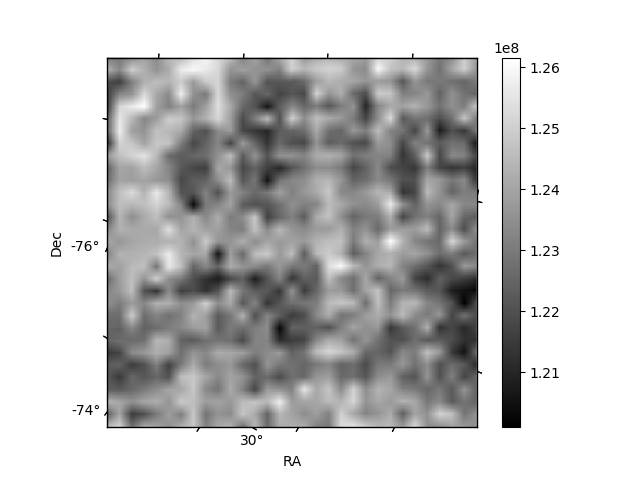
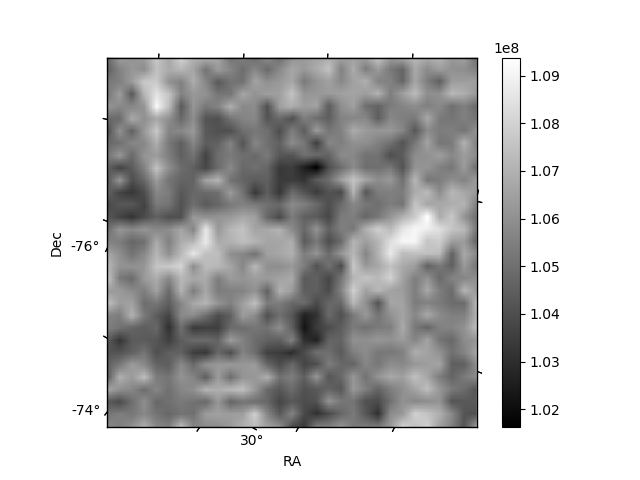
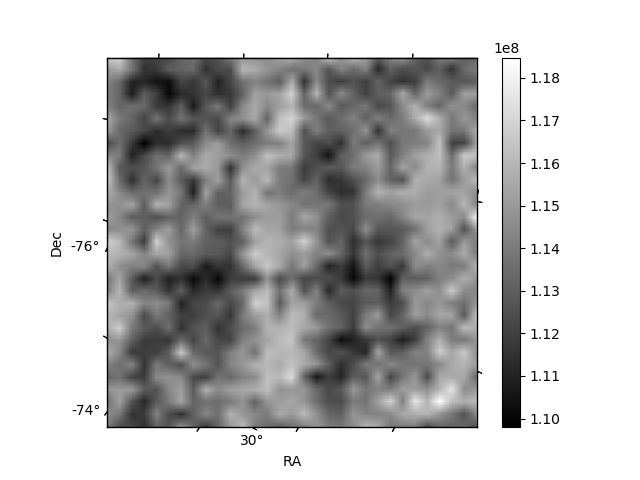
Histogram calculated using DETX and DETY for each event in the final _common_clean file
| Quadrant A | 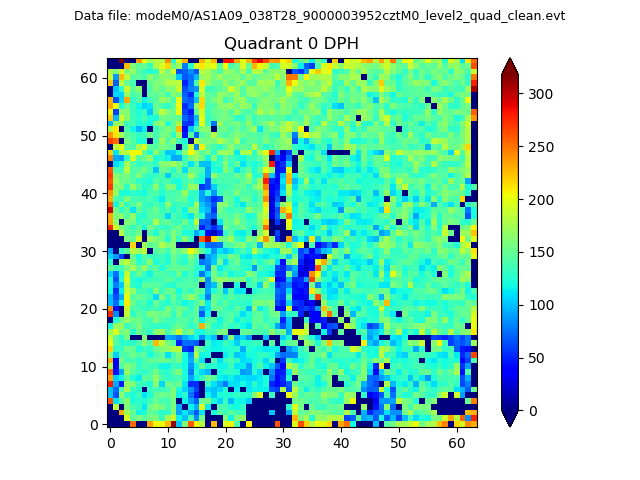 |
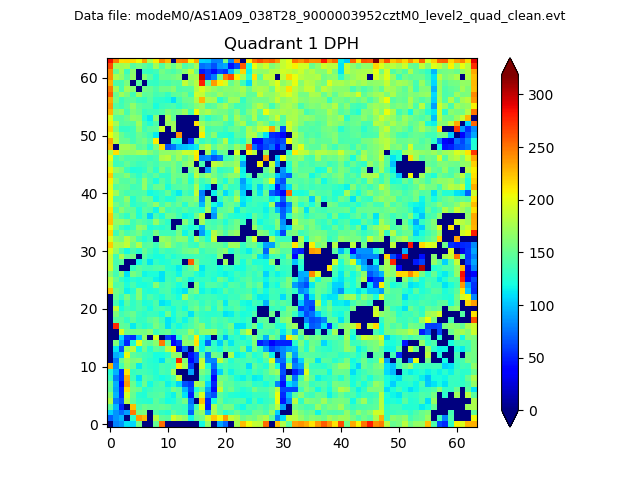 |
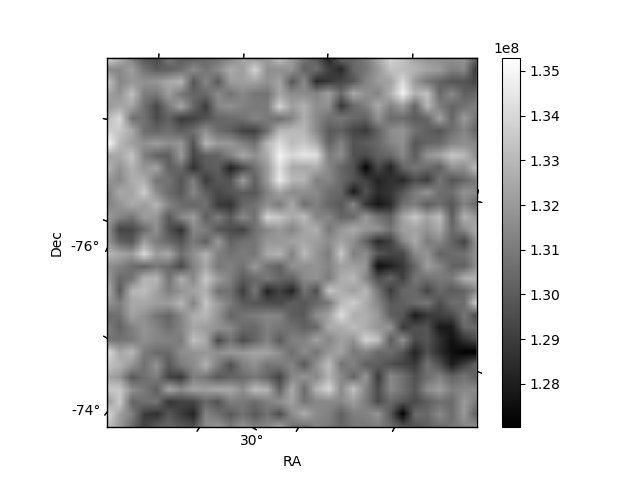
Quadrant B |
|---|---|---|---|
| Quadrant D | 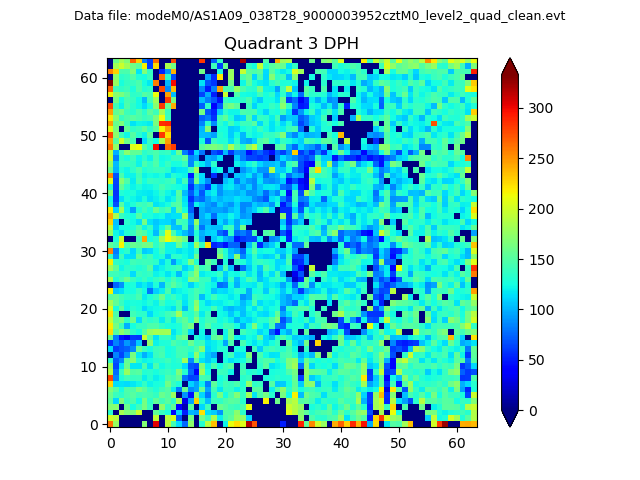 |
 |
Quadrant C |
| Plot type | Count rate plots | Images |
|---|---|---|
| Comparison with Poisson distribution Blue bars denote a histogram of data divided into 1 sec bins. Red curve is a Poisson curve with rate = median count rate of data. |
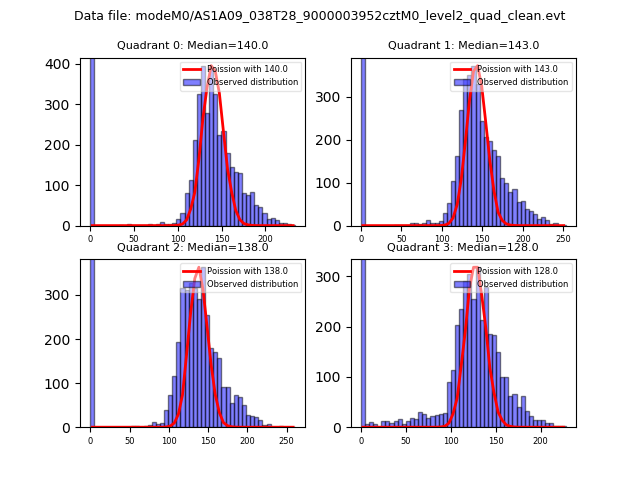 |
 |
| Quadrant-wise count rates Data is divided into 100 sec bins |
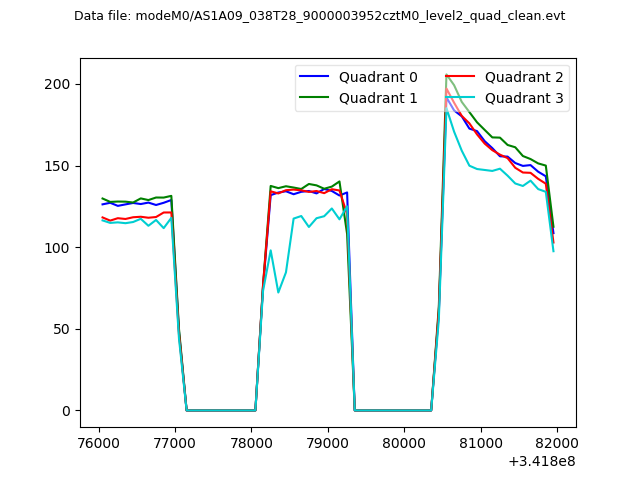 |
|
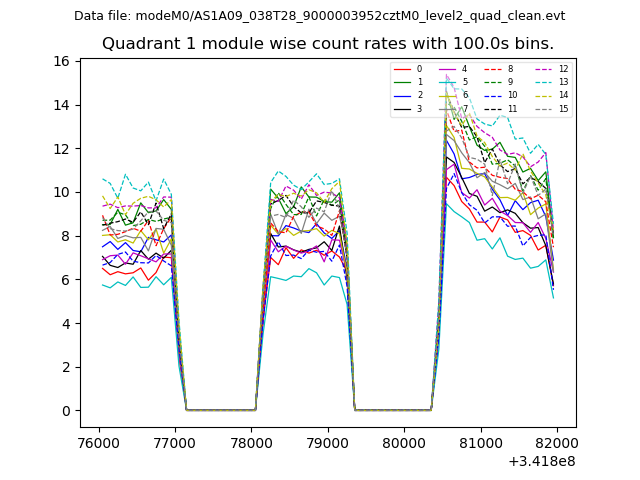
| Module-wise count rates for Quadrant A Data is divided into 100 sec bins |
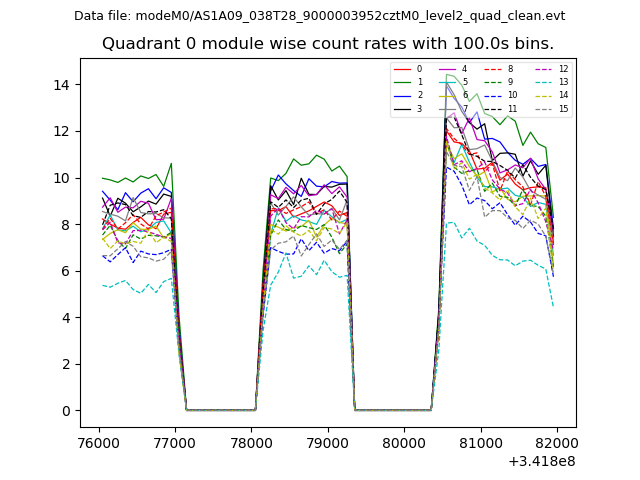 |
 |
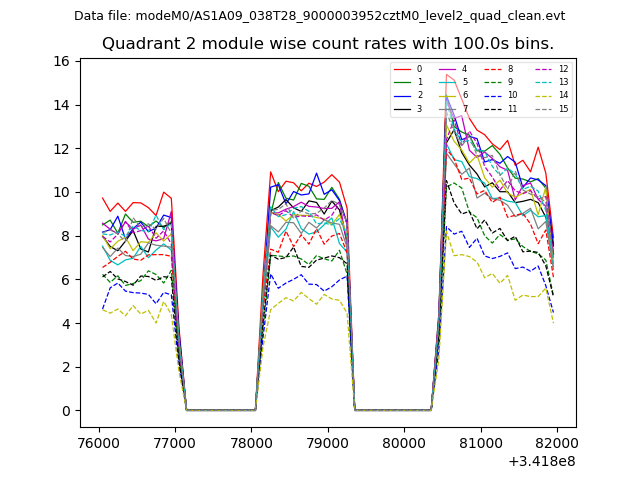
| Module-wise count rates for Quadrant B Data is divided into 100 sec bins |
 |
 |
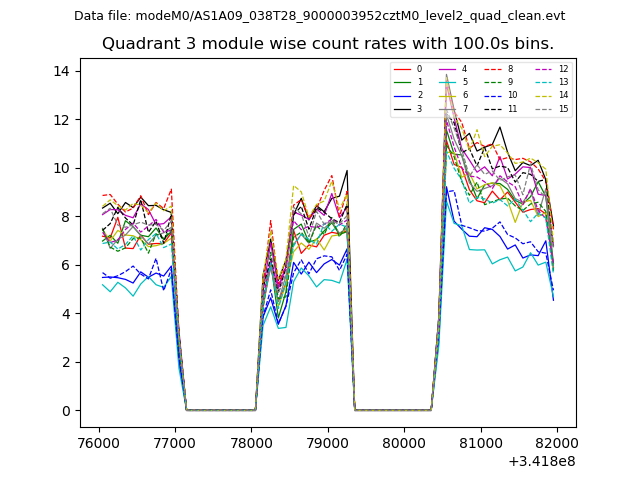
| Module-wise count rates for Quadrant C Data is divided into 100 sec bins |
 |
 |
| Module-wise count rates for Quadrant D Data is divided into 100 sec bins |
 |
 |
| Parameter | Plot |
|---|---|
| CZT HV Monitor | 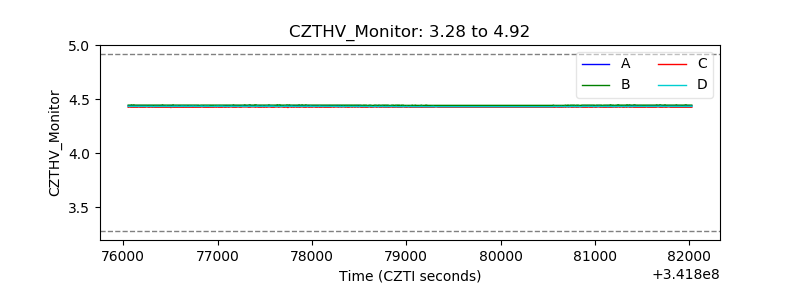 |
| D_VDD | 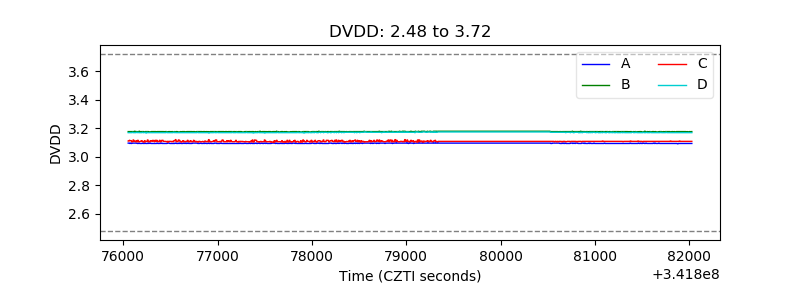 |
| Temperature 1 | 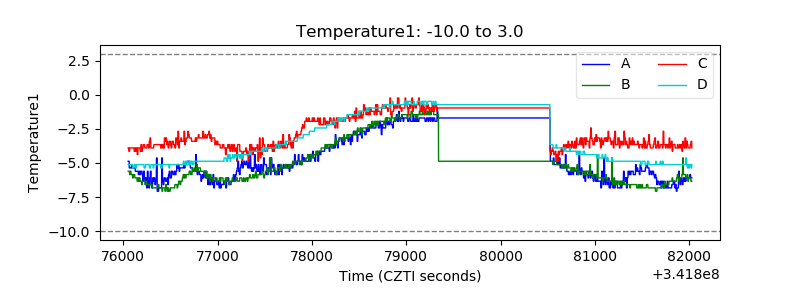 |
| Veto HV Monitor | 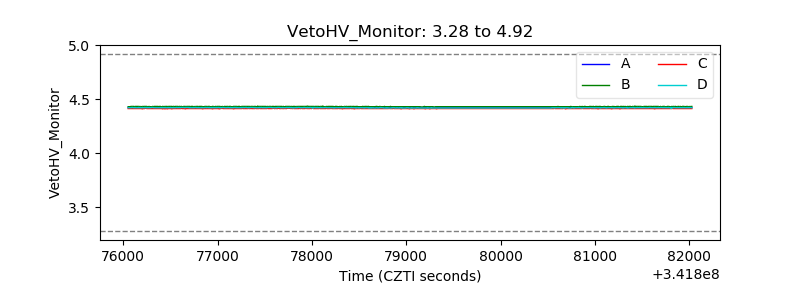 |
| Veto LLD | 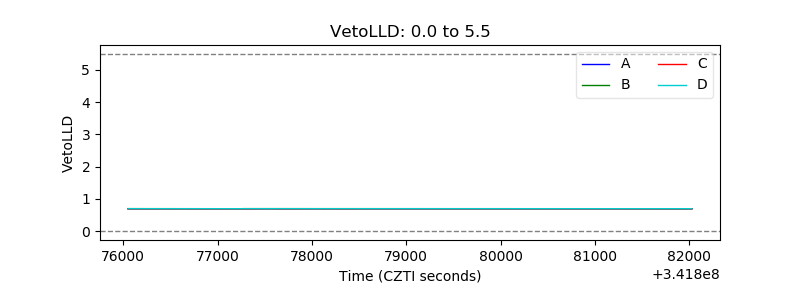 |
| Alpha Counter | 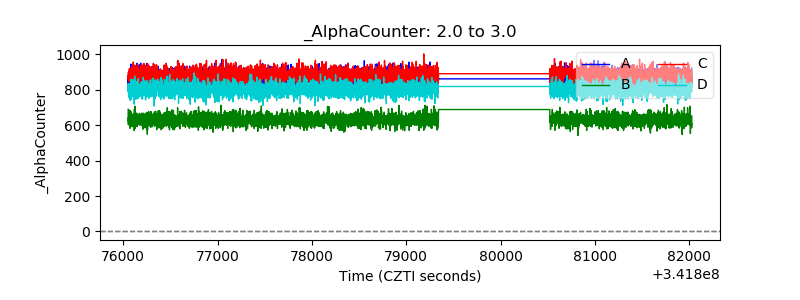 |
| _CPM_Rate | 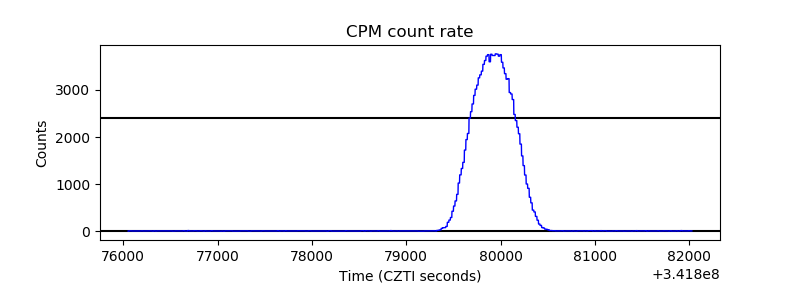 |
| CZT Counter | 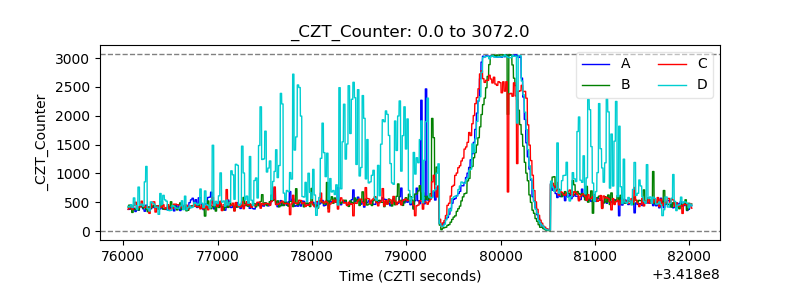 |
| +2.5 Volts monitor | 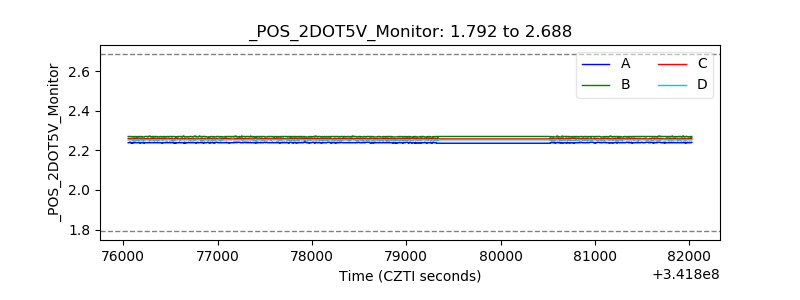 |
| +5 Volts monitor | 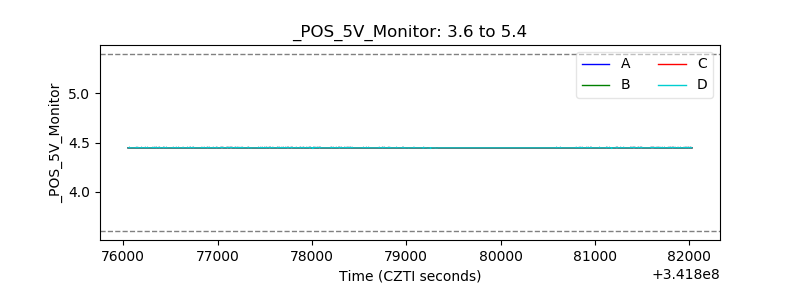 |
| _ROLL_ROT | 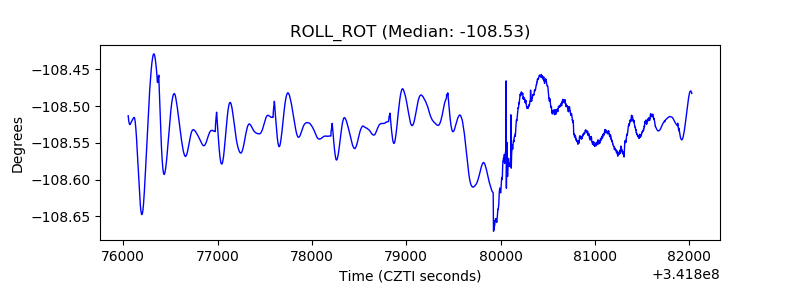 |
| _Roll_DEC | 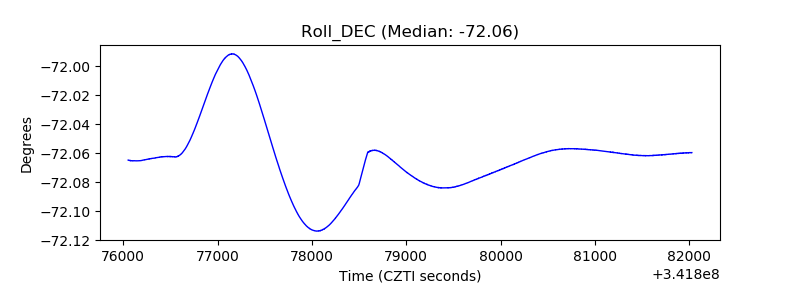 |
| _Roll_RA | 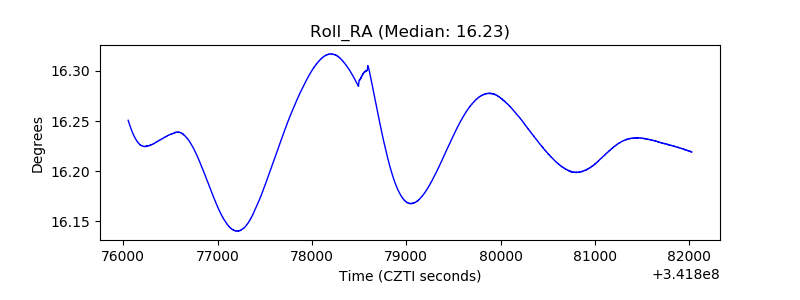 |
| Veto Counter | 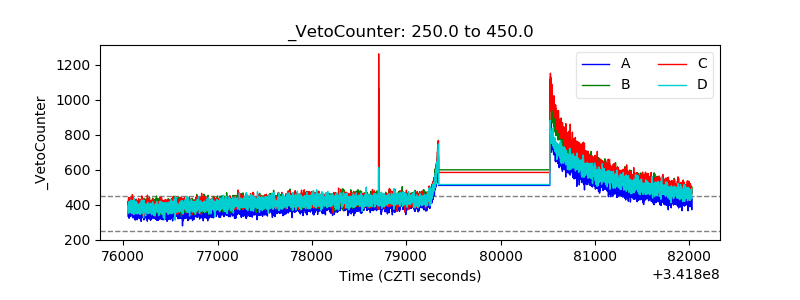 |