| Param | Original file | Final file |
|---|---|---|
| Filename | modeM0/AS1A09_038T28_9000003952_27543cztM0_level2.evt | modeM0/AS1A09_038T28_9000003952_27543cztM0_level2_quad_clean.evt |
| Size (bytes) | 389,044,800 | 73,408,320 |
| Size | 371.0 MB | 70.0 MB |
| Events in quadrant A | 2,232,502 | 488,893 |
| Events in quadrant B | 2,388,519 | 503,385 |
| Events in quadrant C | 2,297,254 | 479,974 |
| Events in quadrant D | 4,556,950 | 433,324 |
| Mode M9 | |||
|---|---|---|---|
| Quadrant | BADHDUFLAG | Total packets | Discarded packets |
| A | 0 | 12 | 0 |
| B | 0 | 12 | 0 |
| C | 0 | 12 | 0 |
| D | 0 | 12 | 0 |
| Mode M0 | |||
|---|---|---|---|
| Quadrant | BADHDUFLAG | Total packets | Discarded packets |
| A | 0 | 9479 | 0 |
| B | 0 | 10013 | 0 |
| C | 0 | 9588 | 0 |
| D | 0 | 16698 | 0 |
| Quadrant | Total seconds | Saturated seconds | Saturation percentage |
|---|---|---|---|
| A | 4512 | 33 | 0.731383% |
| B | 4512 | 76 | 1.684397% |
| C | 4512 | 67 | 1.484929% |
| D | 4512 | 603 | 13.364362% |
Noise dominated data is calculated using 1-second bins in cleaned event files. If a bin has >2000 counts, and if more than 50% of those come from <1% of pixels, then it is considered to be noise-dominated and hence unusable.
| Quadrant | # 1 sec bins | Bins with >0 counts | Bins with >2000 counts | High rate bins dominated by noise | Noise dominated (total time) | Noise dominated (detector-on time) | Marked lightcurve |
|---|---|---|---|---|---|---|---|
| A | 5692 | 4513 | 11 | 11 | 0.19% | 0.24% | 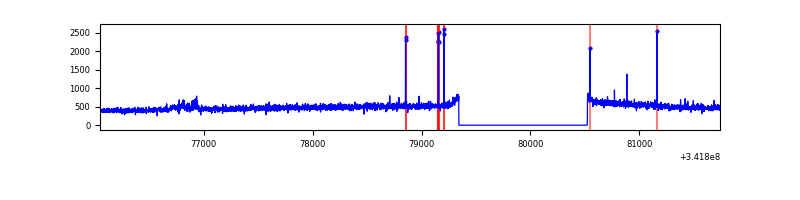 |
| B | 5692 | 4512 | 15 | 15 | 0.26% | 0.33% | 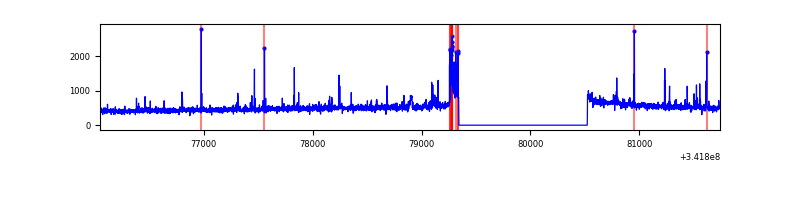 |
| C | 5692 | 4512 | 7 | 7 | 0.12% | 0.16% | 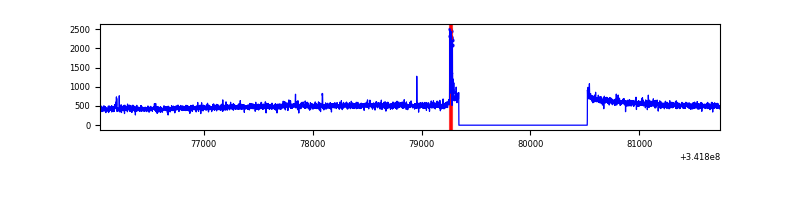 |
| D | 5692 | 4512 | 500 | 500 | 8.78% | 11.08% | 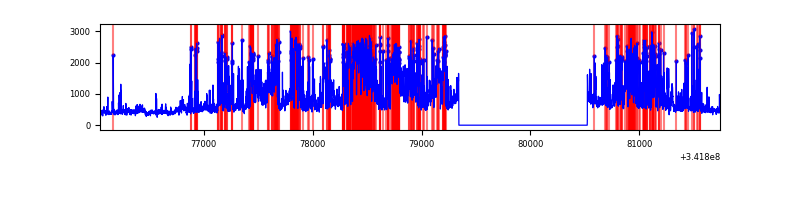 |
Top three noisy pixels from each quadrant. If the there are fewer than three noisy pixels in the level2.evt file, extra rows are filled as -1
| Pixel properties | Quadrant properties | ||||||
|---|---|---|---|---|---|---|---|
| Quadrant | DetID | PixID | Counts | Sigma | Mean | Median | Sigma |
| A | 6 | 16 | 28367 | 245.88 | 564 | 552 | 113.1 |
| A | 15 | 174 | 26820 | 232.2 | 564 | 552 | 113.1 |
| A | 13 | 254 | 7450 | 60.98 | 564 | 552 | 113.1 |
| B | 10 | 245 | 129164 | 1208.56 | 565 | 550 | 106.4 |
| B | 0 | 230 | 15597 | 141.39 | 565 | 550 | 106.4 |
| B | 15 | 32 | 14652 | 132.51 | 565 | 550 | 106.4 |
| C | 14 | 238 | 89994 | 695.09 | 552 | 555 | 128.7 |
| C | 2 | 16 | 35295 | 269.99 | 552 | 555 | 128.7 |
| C | 8 | 128 | 7652 | 55.16 | 552 | 555 | 128.7 |
| D | 1 | 52 | 2201745 | 17902.12 | 521 | 507 | 123.0 |
| D | 7 | 80 | 355314 | 2885.56 | 521 | 507 | 123.0 |
| D | 2 | 234 | 15816 | 124.5 | 521 | 507 | 123.0 |
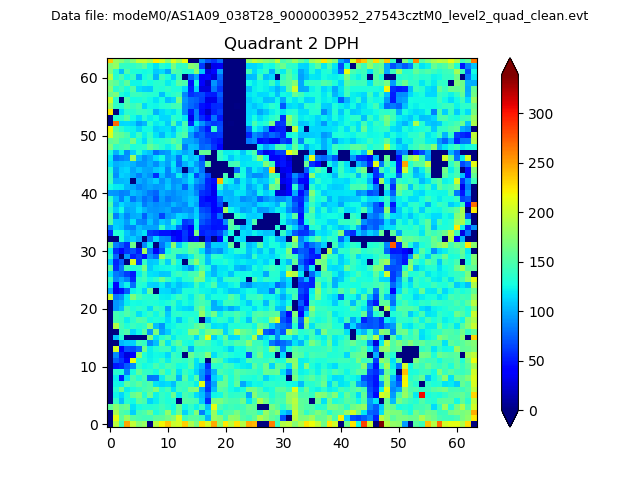
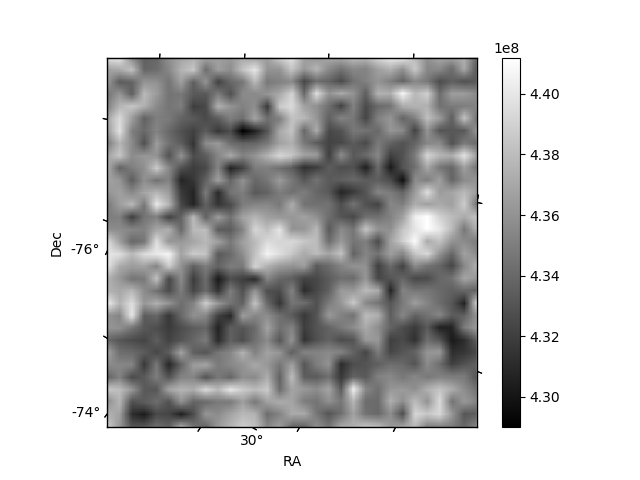
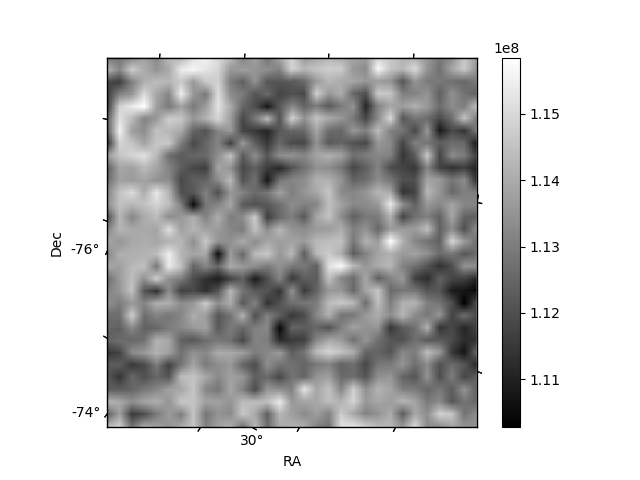
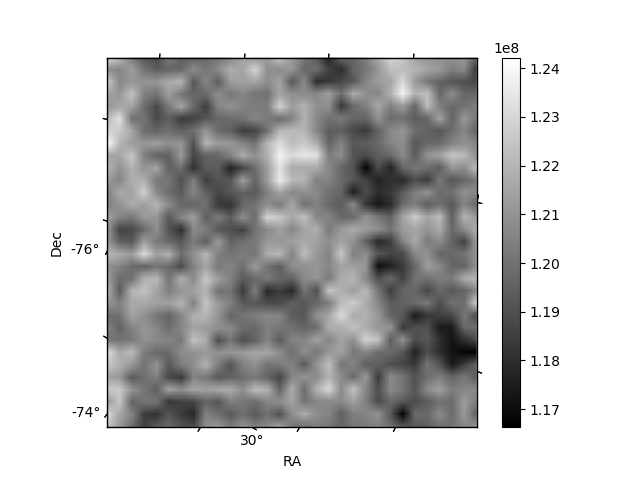
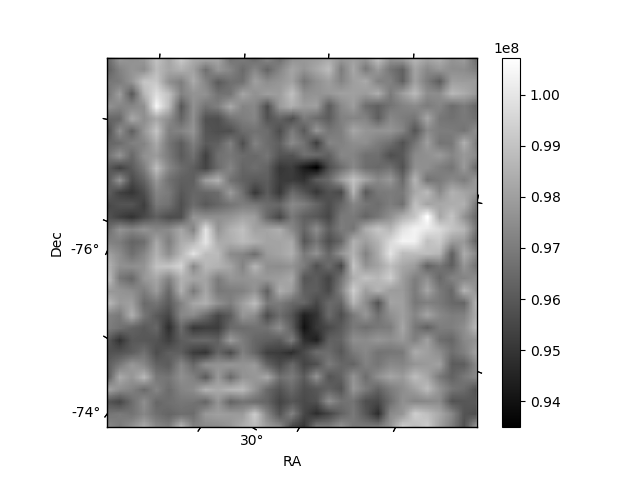
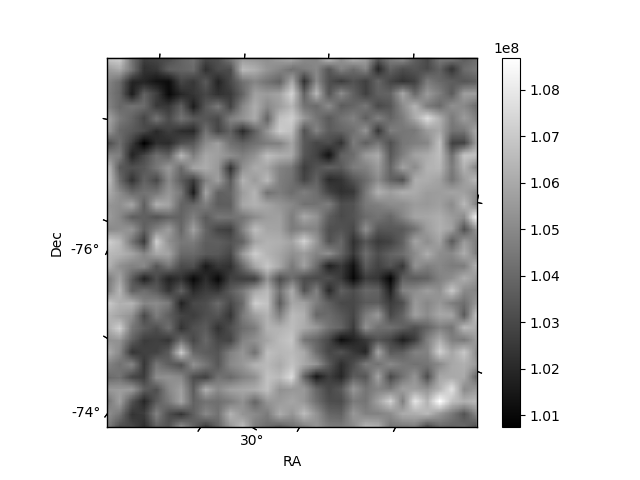
Histogram calculated using DETX and DETY for each event in the final _common_clean file
| Quadrant A | 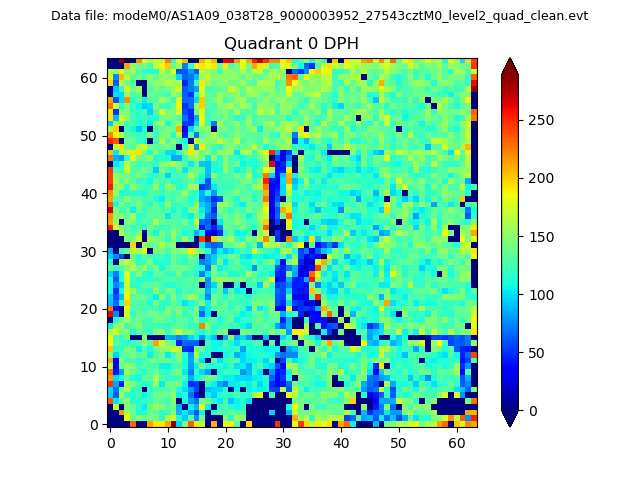 |
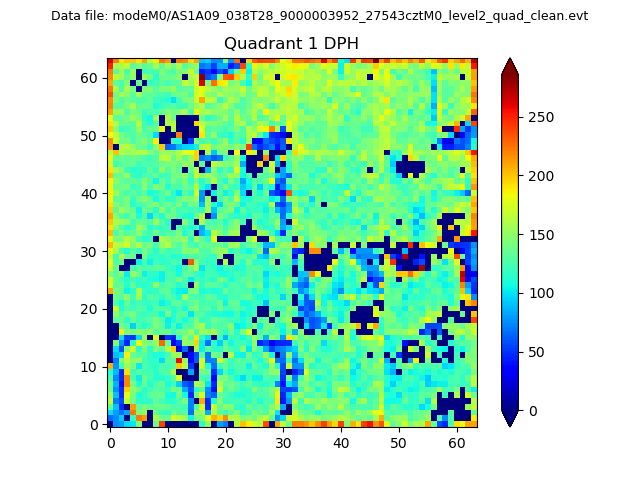 |
Quadrant B |
|---|---|---|---|
| Quadrant D | 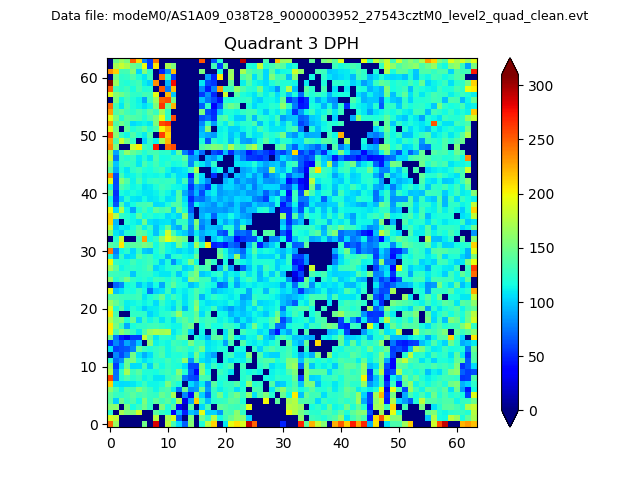 |
 |
Quadrant C |
| Plot type | Count rate plots | Images |
|---|---|---|
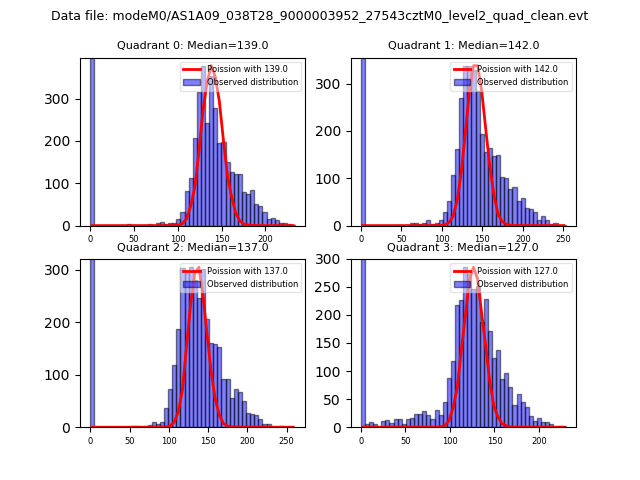
| Comparison with Poisson distribution Blue bars denote a histogram of data divided into 1 sec bins. Red curve is a Poisson curve with rate = median count rate of data. |
 |
 |
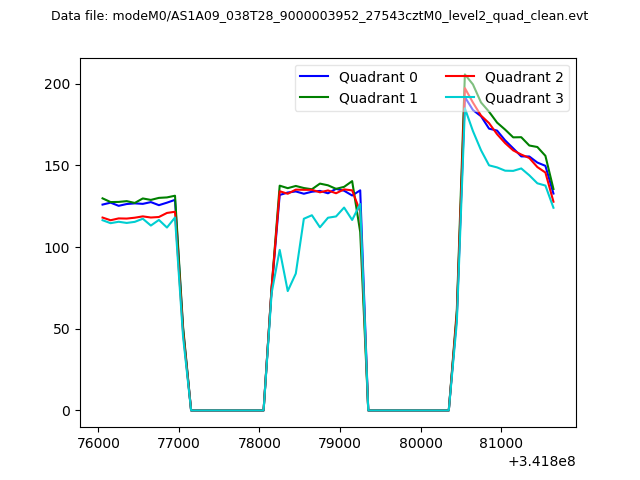
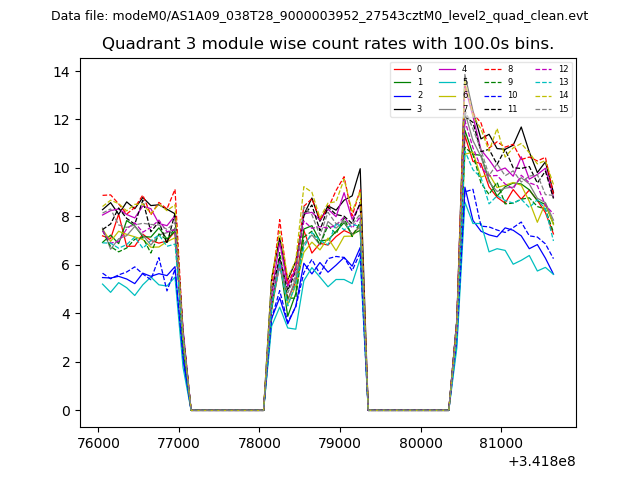
| Quadrant-wise count rates Data is divided into 100 sec bins |
 |
|
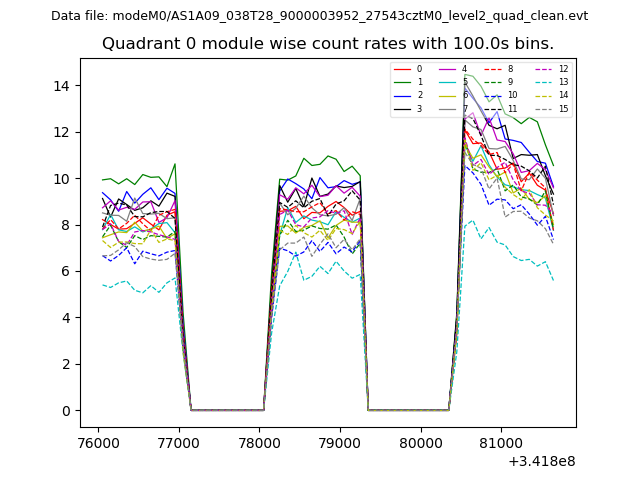
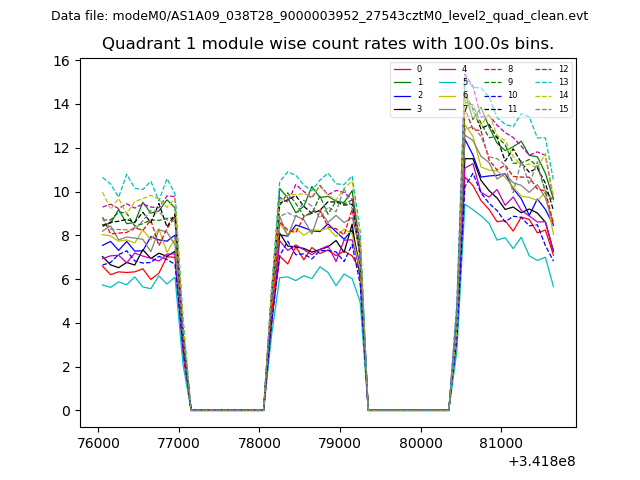
| Module-wise count rates for Quadrant A Data is divided into 100 sec bins |
 |
 |
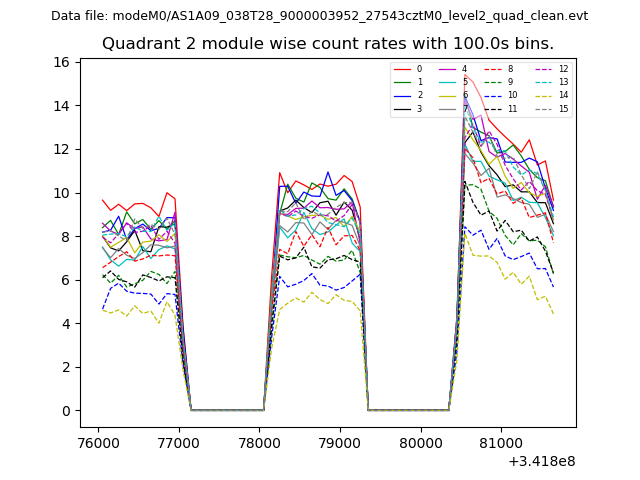
| Module-wise count rates for Quadrant B Data is divided into 100 sec bins |
 |
 |
| Module-wise count rates for Quadrant C Data is divided into 100 sec bins |
 |
 |
| Module-wise count rates for Quadrant D Data is divided into 100 sec bins |
 |
 |
| Parameter | Plot |
|---|---|
| CZT HV Monitor | 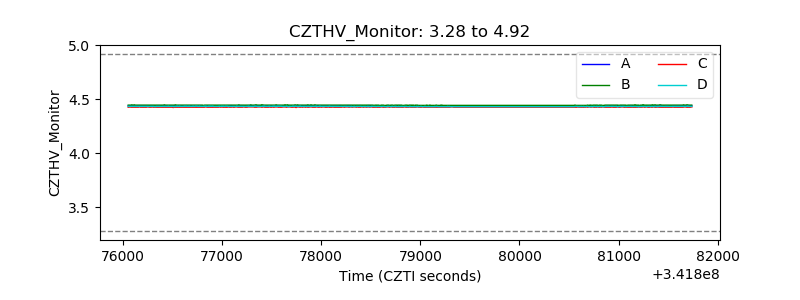 |
| D_VDD | 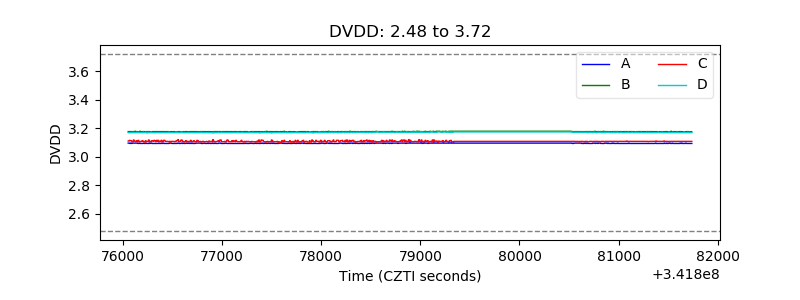 |
| Temperature 1 | 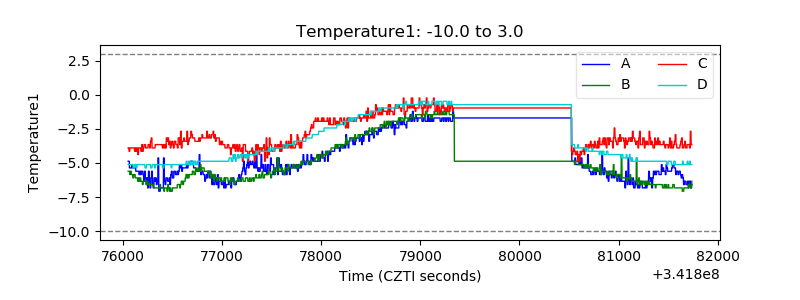 |
| Veto HV Monitor | 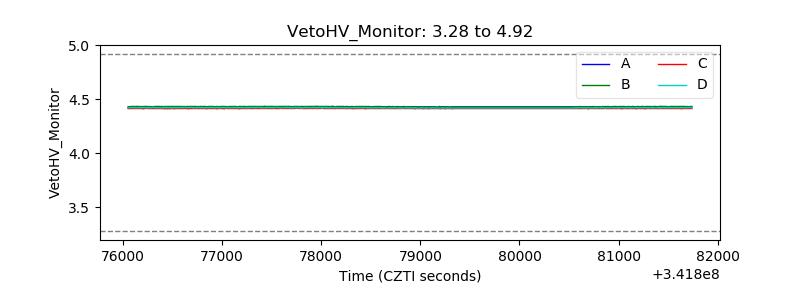 |
| Veto LLD | 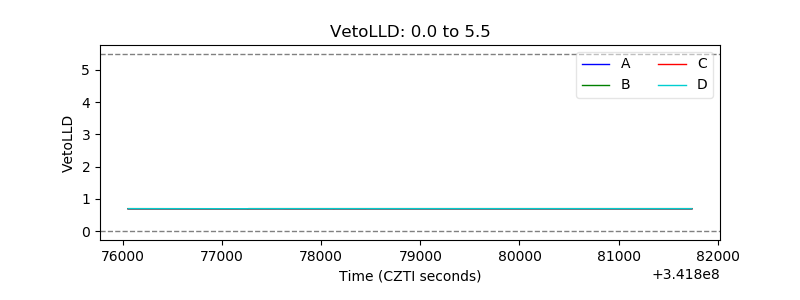 |
| Alpha Counter | 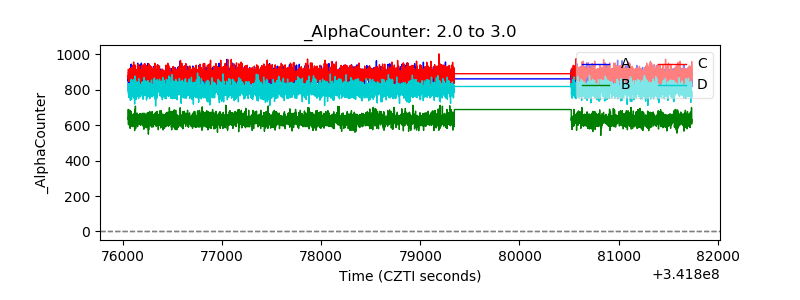 |
| _CPM_Rate |  |
| CZT Counter | 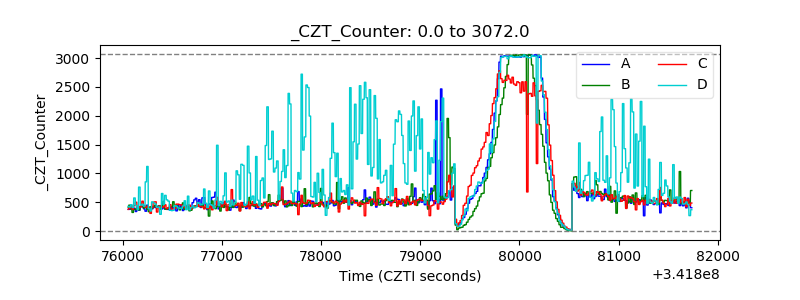 |
| +2.5 Volts monitor |  |
| +5 Volts monitor | 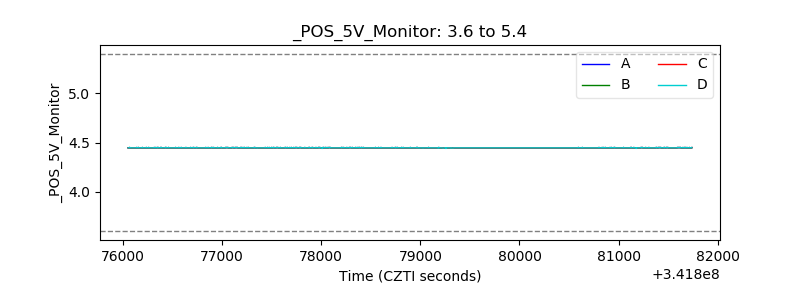 |
| _ROLL_ROT | 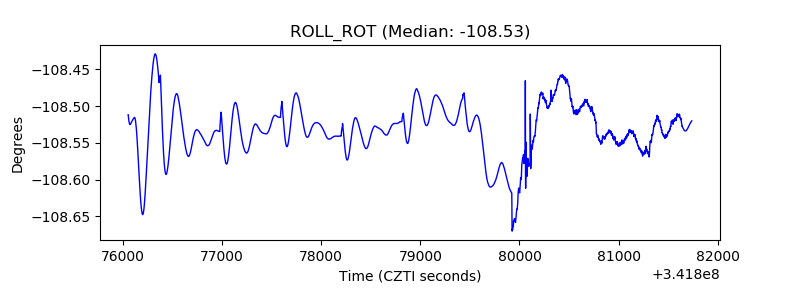 |
| _Roll_DEC | 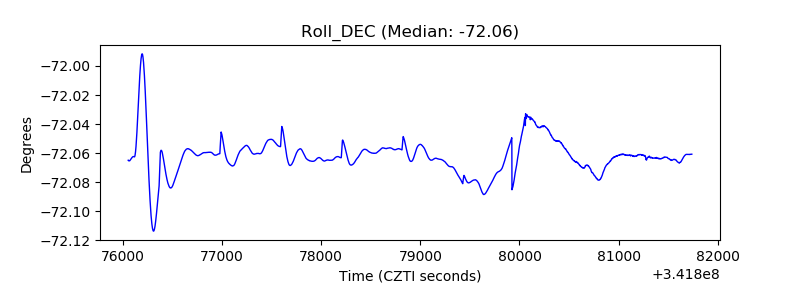 |
| _Roll_RA | 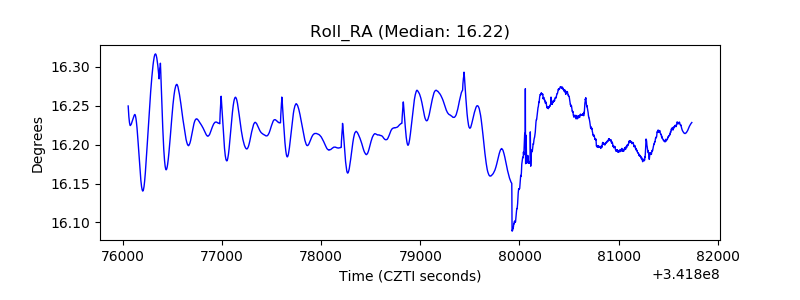 |
| Veto Counter | 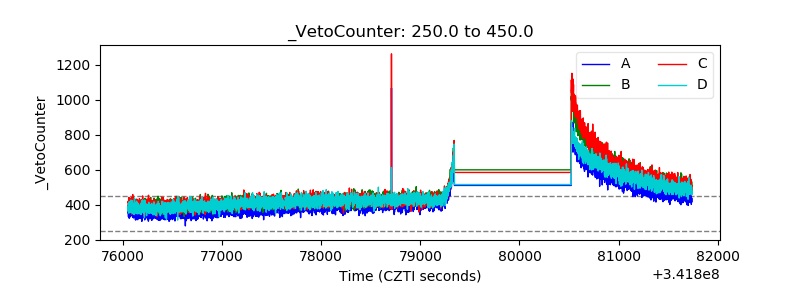 |