| Param | Original file | Final file |
|---|---|---|
| Filename | modeM0/AS1A09_038T29_9000003954cztM0_level2.fits | modeM0/AS1A09_038T29_9000003954cztM0_level2_quad_clean.evt |
| Size (bytes) | 193,204,800 | 95,088,960 |
| Size | 184.3 MB | 90.7 MB |
| Events in quadrant A | 1,226,056 | 438,095 |
| Events in quadrant B | 1,161,616 | 449,503 |
| Events in quadrant C | 1,224,902 | 434,654 |
| Events in quadrant D | 1,037,996 | 354,264 |
| Mode M0 | |||
|---|---|---|---|
| Quadrant | BADHDUFLAG | Total packets | Discarded packets |
| A | 0 | 36532 | 0 |
| B | 0 | 42733 | 0 |
| C | 0 | 37660 | 0 |
| D | 0 | 52188 | 0 |
| Mode M9 | |||
|---|---|---|---|
| Quadrant | BADHDUFLAG | Total packets | Discarded packets |
| A | 0 | 40 | 0 |
| B | 0 | 40 | 0 |
| C | 0 | 40 | 0 |
| D | 0 | 40 | 0 |
| Mode SS | |||
|---|---|---|---|
| Quadrant | BADHDUFLAG | Total packets | Discarded packets |
| A | 0 | 356 | 0 |
| B | 0 | 356 | 0 |
| C | 0 | 356 | 0 |
| D | 0 | 356 | 0 |
| Quadrant | Total seconds | Saturated seconds | Saturation percentage |
|---|---|---|---|
| A | 17411 | 83 | 0.476710% |
| B | 17411 | 727 | 4.175521% |
| C | 17411 | 218 | 1.252082% |
| D | 17410 | 1215 | 6.978748% |
Noise dominated data is calculated using 1-second bins in cleaned event files. If a bin has >2000 counts, and if more than 50% of those come from <1% of pixels, then it is considered to be noise-dominated and hence unusable.
| Quadrant | # 1 sec bins | Bins with >0 counts | Bins with >2000 counts | High rate bins dominated by noise | Noise dominated (total time) | Noise dominated (detector-on time) | Marked lightcurve |
|---|---|---|---|---|---|---|---|
| A | 21437 | 17412 | 0 | 0 | 0.00% | 0.00% |  |
| B | 21437 | 17389 | 0 | 0 | 0.00% | 0.00% |  |
| C | 21437 | 17407 | 0 | 0 | 0.00% | 0.00% | 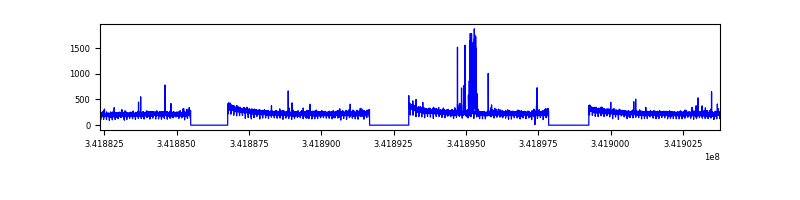 |
| D | 21437 | 17401 | 0 | 0 | 0.00% | 0.00% | 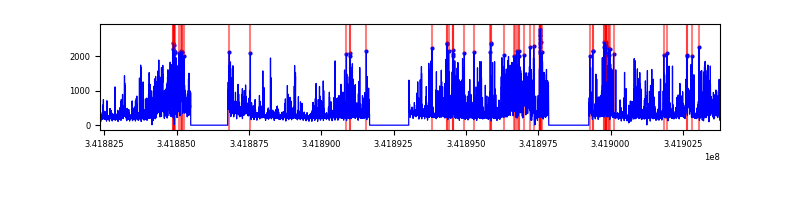 |
Top three noisy pixels from each quadrant. If the there are fewer than three noisy pixels in the level2.evt file, extra rows are filled as -1
| Pixel properties | Quadrant properties | ||||||
|---|---|---|---|---|---|---|---|
| Quadrant | DetID | PixID | Counts | Sigma | Mean | Median | Sigma |
| A | 0 | 29 | 1104 | 10.15 | 320 | 304 | 78.8 |
| A | 7 | 110 | 950 | 8.2 | 320 | 304 | 78.8 |
| A | 14 | 95 | 861 | 7.07 | 320 | 304 | 78.8 |
| B | 2 | 9 | 924 | 10.28 | 307 | 298 | 60.9 |
| B | 5 | 128 | 772 | 7.78 | 307 | 298 | 60.9 |
| B | 2 | 8 | 764 | 7.65 | 307 | 298 | 60.9 |
| C | 1 | 81 | 944 | 7.8 | 323 | 308 | 81.4 |
| C | 1 | 80 | 928 | 7.61 | 323 | 308 | 81.4 |
| C | 9 | 233 | 893 | 7.18 | 323 | 308 | 81.4 |
| D | 4 | 246 | 795 | 6.58 | 296 | 273 | 79.3 |
| D | 15 | 46 | 786 | 6.47 | 296 | 273 | 79.3 |
| D | 6 | 67 | 775 | 6.33 | 296 | 273 | 79.3 |
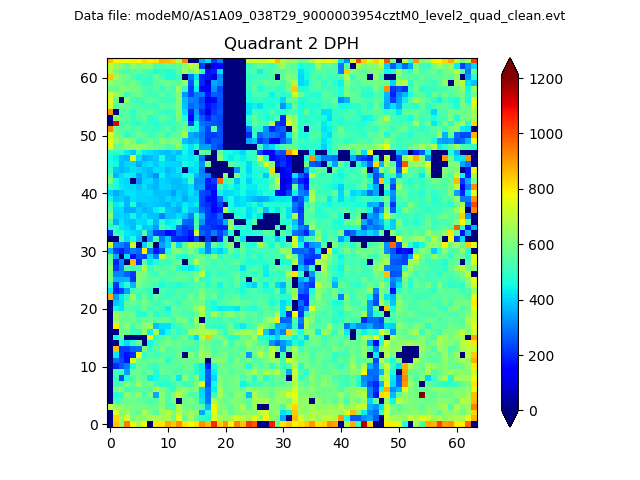
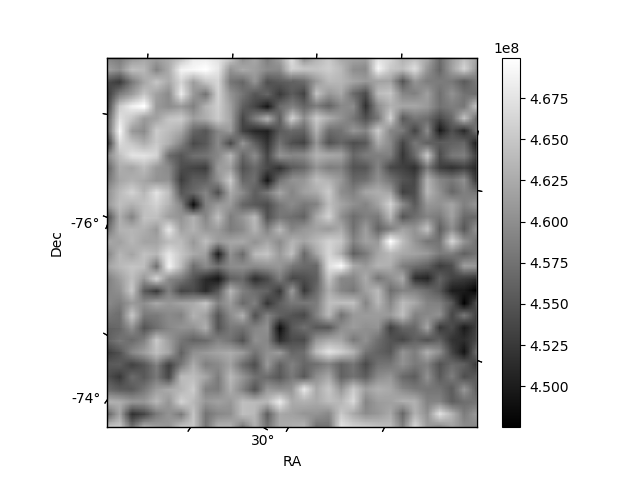
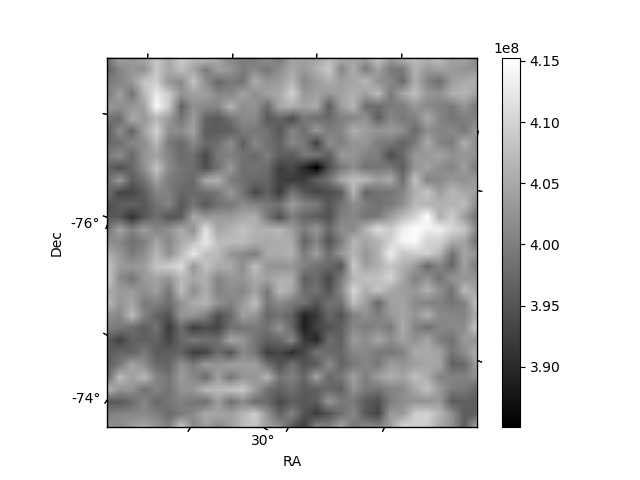
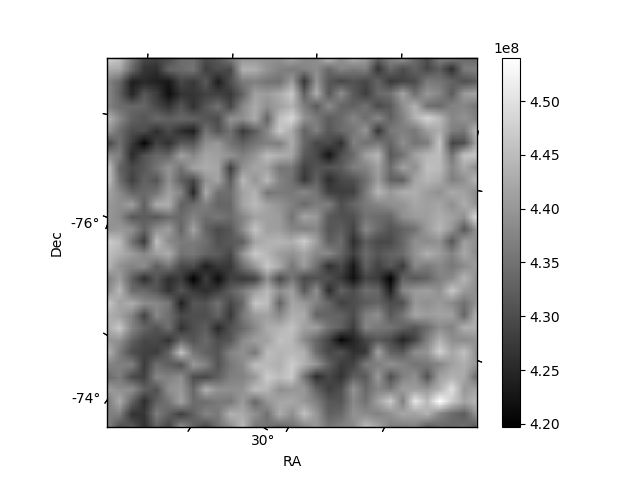
Histogram calculated using DETX and DETY for each event in the final _common_clean file
| Quadrant A | 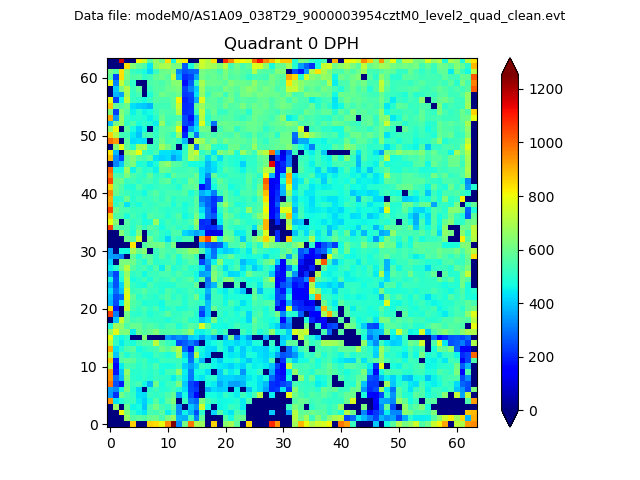 |
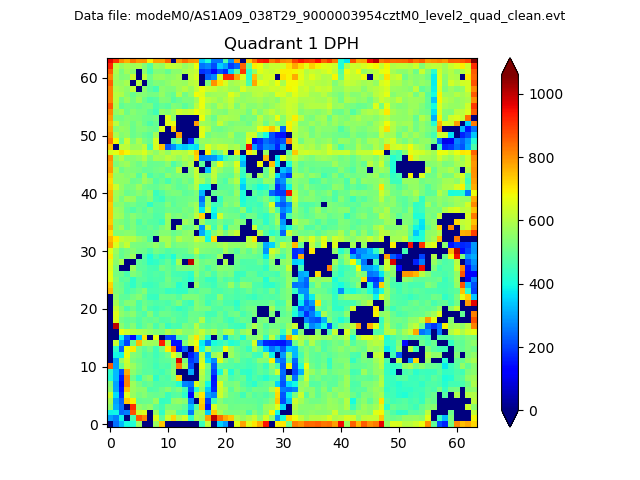 |
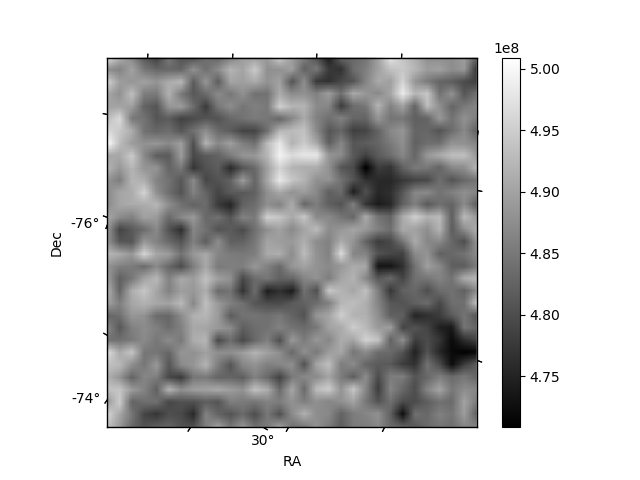
Quadrant B |
|---|---|---|---|
| Quadrant D | 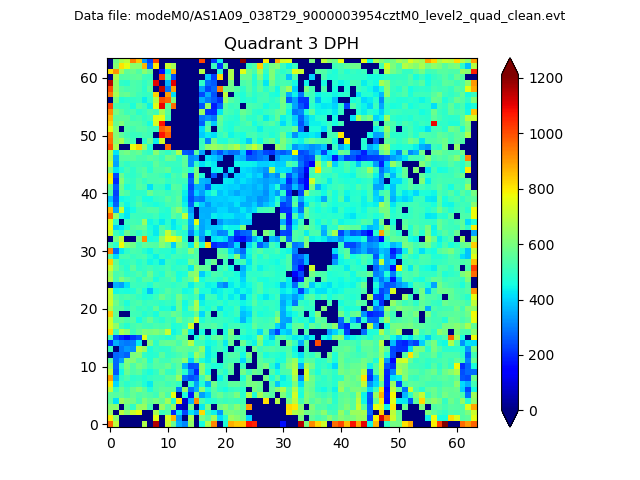 |
 |
Quadrant C |
| Plot type | Count rate plots | Images |
|---|---|---|
| Comparison with Poisson distribution Blue bars denote a histogram of data divided into 1 sec bins. Red curve is a Poisson curve with rate = median count rate of data. |
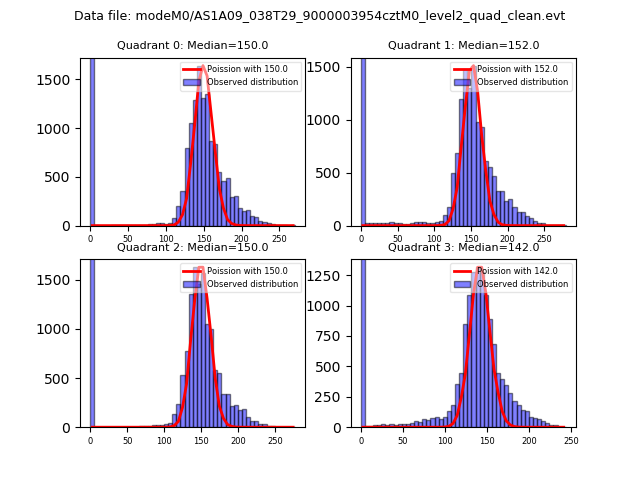 |
 |
| Quadrant-wise count rates Data is divided into 100 sec bins |
 |
|
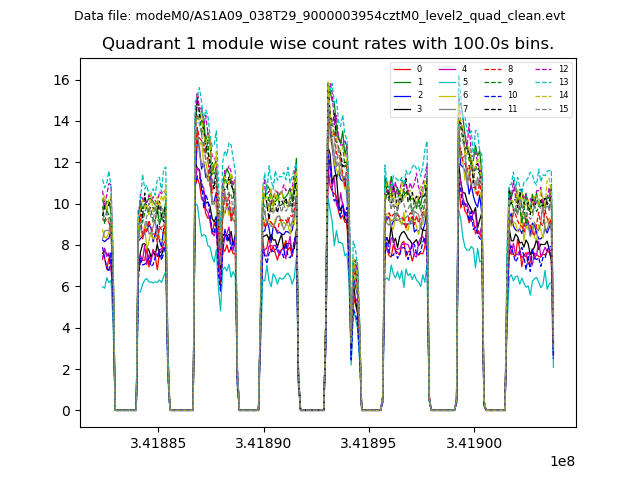
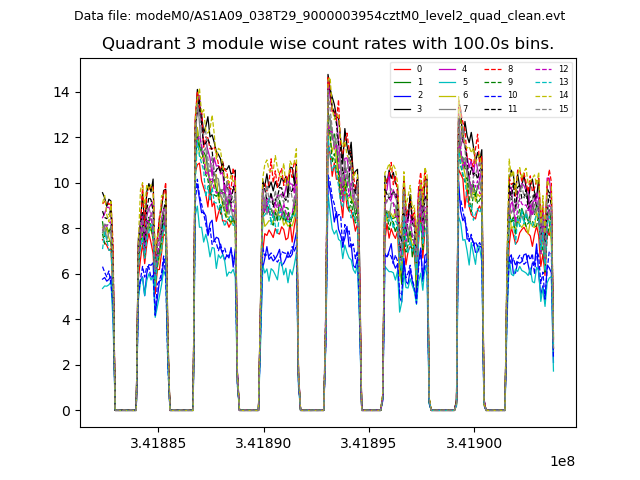
| Module-wise count rates for Quadrant A Data is divided into 100 sec bins |
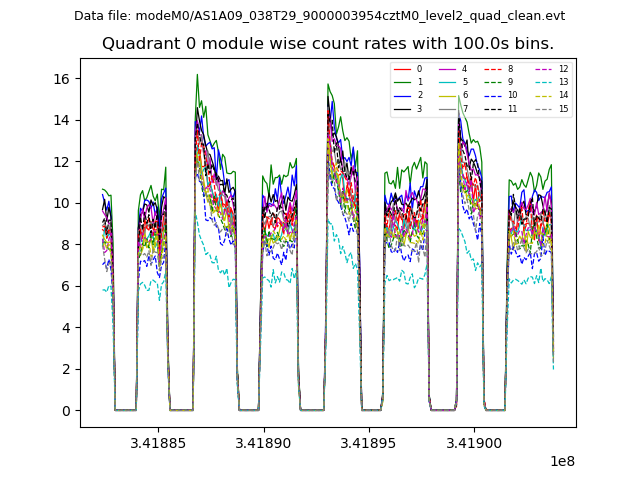 |
 |
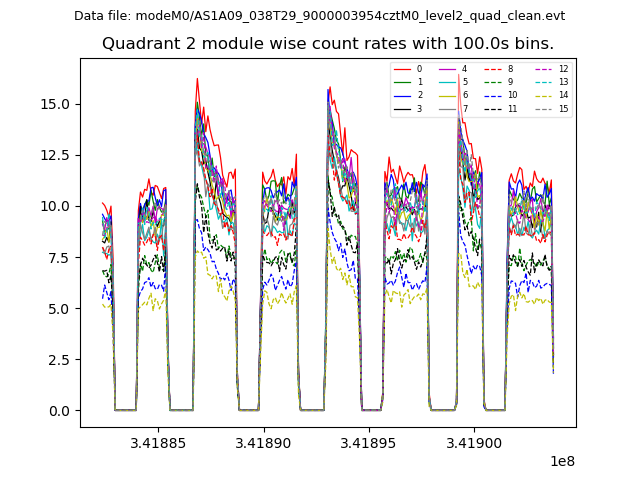
| Module-wise count rates for Quadrant B Data is divided into 100 sec bins |
 |
 |
| Module-wise count rates for Quadrant C Data is divided into 100 sec bins |
 |
 |
| Module-wise count rates for Quadrant D Data is divided into 100 sec bins |
 |
 |
| Parameter | Plot |
|---|---|
| CZT HV Monitor | 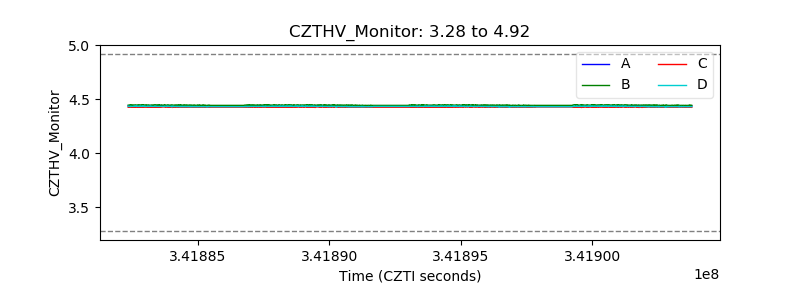 |
| D_VDD | 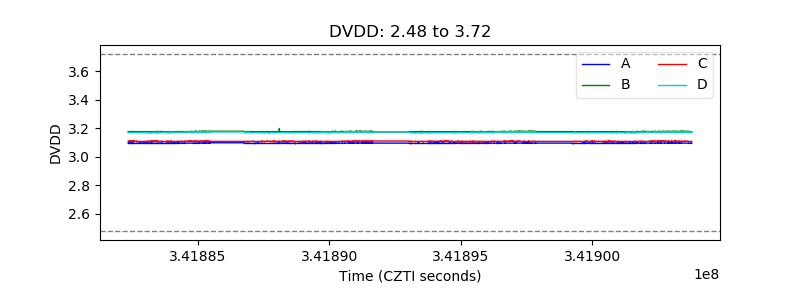 |
| Temperature 1 |  |
| Veto HV Monitor | 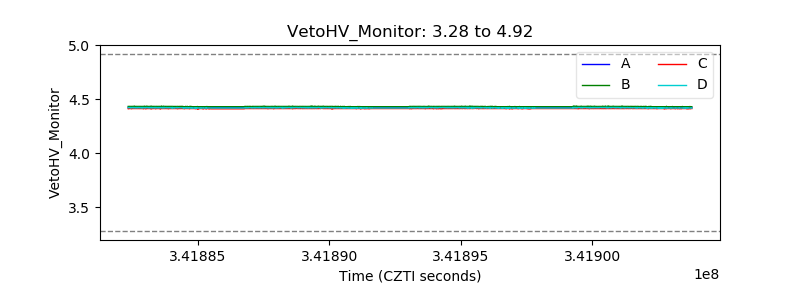 |
| Veto LLD | 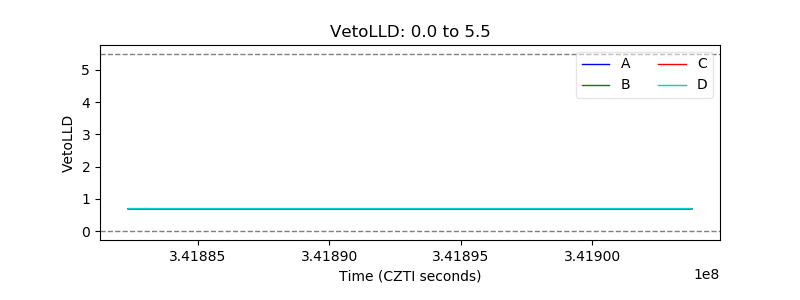 |
| Alpha Counter | 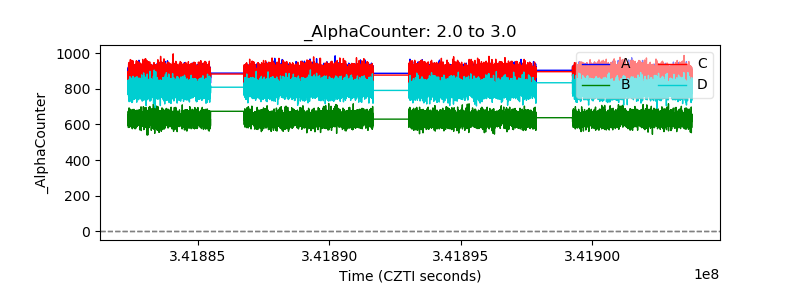 |
| _CPM_Rate |  |
| CZT Counter |  |
| +2.5 Volts monitor |  |
| +5 Volts monitor | 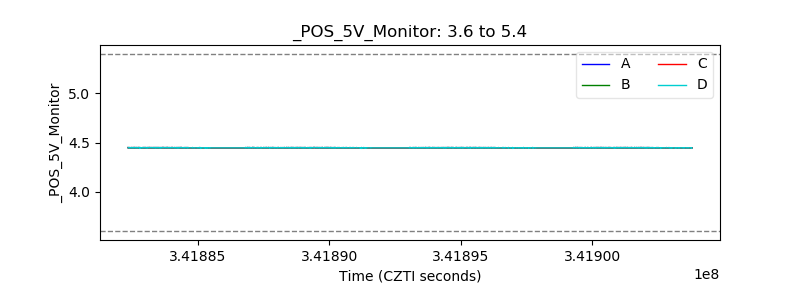 |
| _ROLL_ROT | 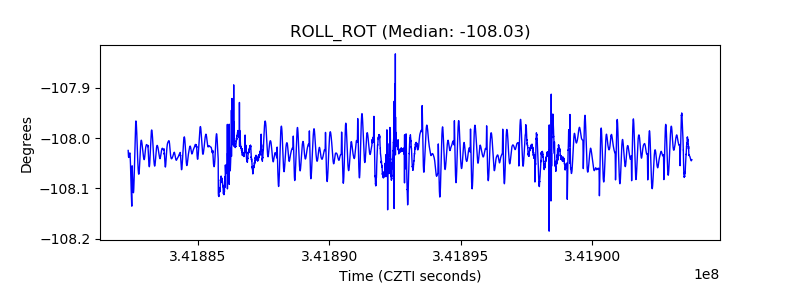 |
| _Roll_DEC | 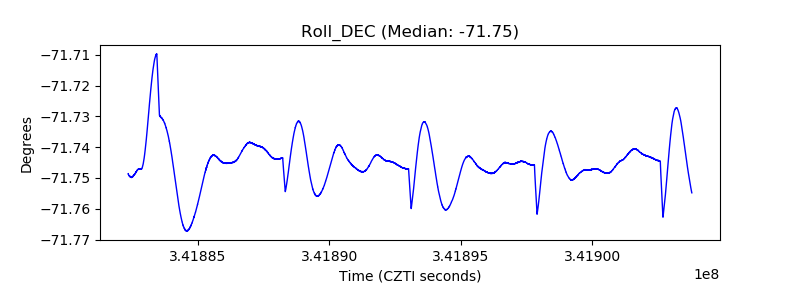 |
| _Roll_RA |  |
| Veto Counter | 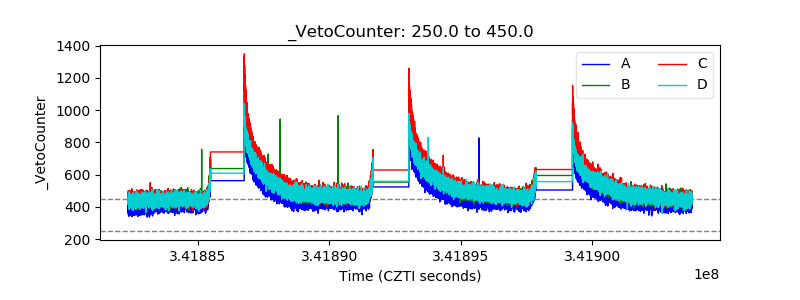 |